ENB - Enbridge: Thoughts On The Dominion Deal And Past Returns
2023-10-30 14:52:38 ET
Summary
- After reviewing the Dominion deal, I like the diversification it brings. I also assume that the deal will be accretive, albeit on a very small scale.
- I think ENB might be able to grow DCF/share at around 3%. Coupled with my assumed FCF yield of 8.2%, investors might be looking at low double-digit total returns.
- My DCF calculation leaves me to assume that ENB is a bit undervalued at the current price.
- The mediocre returns of the past were a result of ENB being highly overvalued a decade ago.
- I rate ENB and the Series F preferred shares with a "buy" and the Series L preferred shares with a "hold".
Author's Note: Since Enbridge Inc. is reporting in Canadian Dollars, all numbers refer to Canadian Dollars (unless stated otherwise).
Introduction
In this article, I will initiate coverage on my single-largest dividend position Enbridge Inc. (ENB)(ENB:CA). I bought my first shares in the aftermath of the pandemic in late September 2020, a time when the whole midstream sector took quite some time to recover from the lows. Around this time, I also bought my Keyera Corp. (KEYUF) (KEY:CA) shares, a company I have covered in the past.
I will start by giving a quick overview of the business and the financials before sharing my thoughts on the recently announced deal with Dominion Energy Inc. (D). I will then discuss the current valuation and share my thoughts on Enbridge's past returns before finishing up with a section regarding risks and a conclusion.
As a bonus, I will share my views on ENB's preferred shares at the end of the article. I recently took a look at all of the outstanding preferred shares and want to share my findings while highlighting one U.S. Dollar and one Canadian dollar-denominated preferred share.
Business Overview
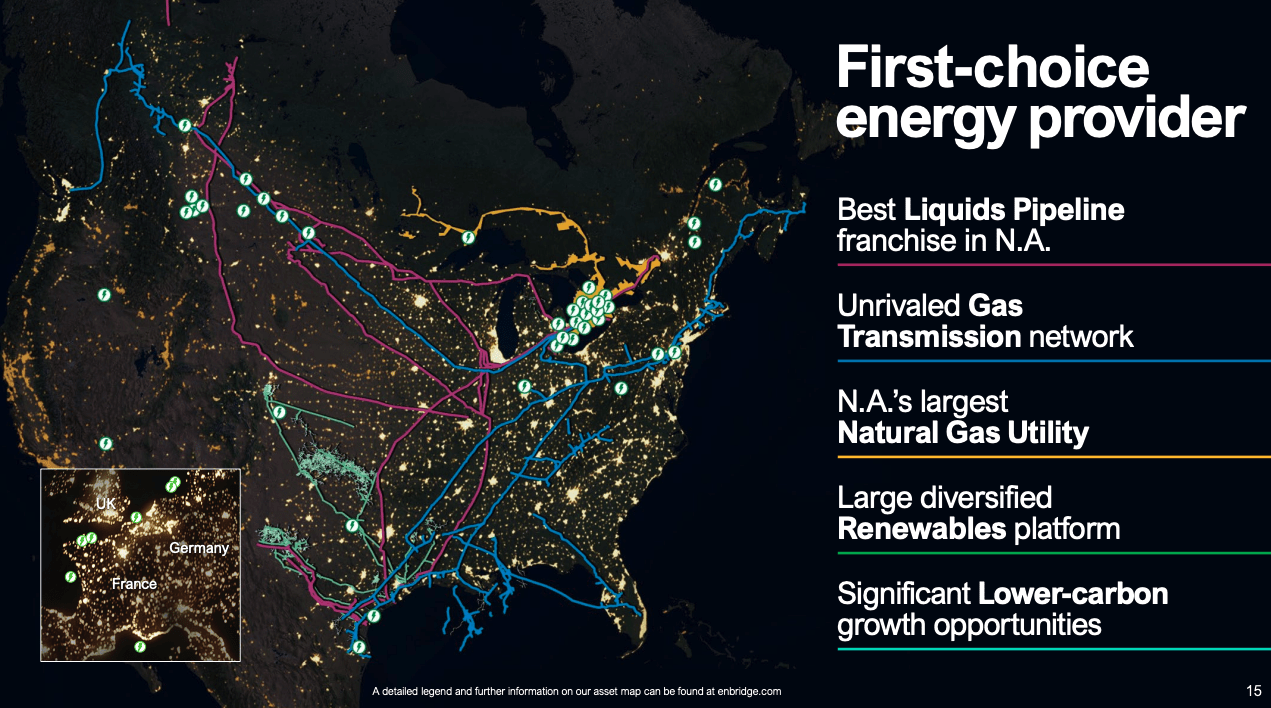
Since Enbridge is a frequently covered company on Seeking Alpha and most of my fellow Analysts usually start their articles with some sort of business description, I will try to keep this section short. I will only use three slides to outline what Enbridge is doing, starting with this slide from the last investor day ("Enbridge Day") showing Enbridge's assets:
ENB Asset Overview (2023 Investor Day Presentation - Slide 15)
Enbridge owns energy infrastructure assets and divides its business into four segments: (1) Liquids Pipelines, (2) Gas Transmission and Midstream, (3) Gas Distribution and Storage and (4) Renewable Power Generation.
As you can see in the slide above, Enbridge owns one of the largest pipeline networks in the U.S. and Canada. The company transports liquids and natural gas for its customers while charging a regulated toll fee for the usage of its services. One other thing to highlight here is that Enbridge follows its LNG export strategy by further expanding its natural gas pipeline network towards several future LNG export terminals in north-west Canada (Ksi Lisims LNG, LNG, Canada, Cedar LNG, Woodfibre LNG and Tilbury LNG) and the U.S. Gulf Coast (Rio Grande LNG, Texas LNG, Freeport LNG, Sabine Pass LNG, Calcasieu Pass, Cameron LNG and Plaquemines LNG). The story behind this strategy is that (a) the U.S. and Canada are expected to increase supply above demand, resulting in an increase in LNG exports (+100% until 2035 according to S&P Global Commodity Insights) and (b) shipping from Canada to Asia is faster than via the Panama/Suez canal.
The Gas Distribution and Storage business has been limited to Ontario until the recently announced deal to acquire three U.S.-based utility companies from Dominion Energy. The Ontario business is one of the largest integrated natural gas utilities and also one of the largest interconnected storage hubs in N.A. This business is highly regulated, resulting in very predictable, albeit limited, cash flows and growth.
As for the Renewable business, it is split up into two parts. In Europe, Enbridge usually acts as a Co-Investor together with the largest European utility companies like RWE (RWEOY), EDF Renewables or EnBW. In N.A., Enbridge operates solar and onshore wind assets. I especially like what Enbridge calls the solar self-power program, an initiative where they built solar parks near their pipelines to lower carbon emissions and, more importantly, achieve low double-digit returns on capital.
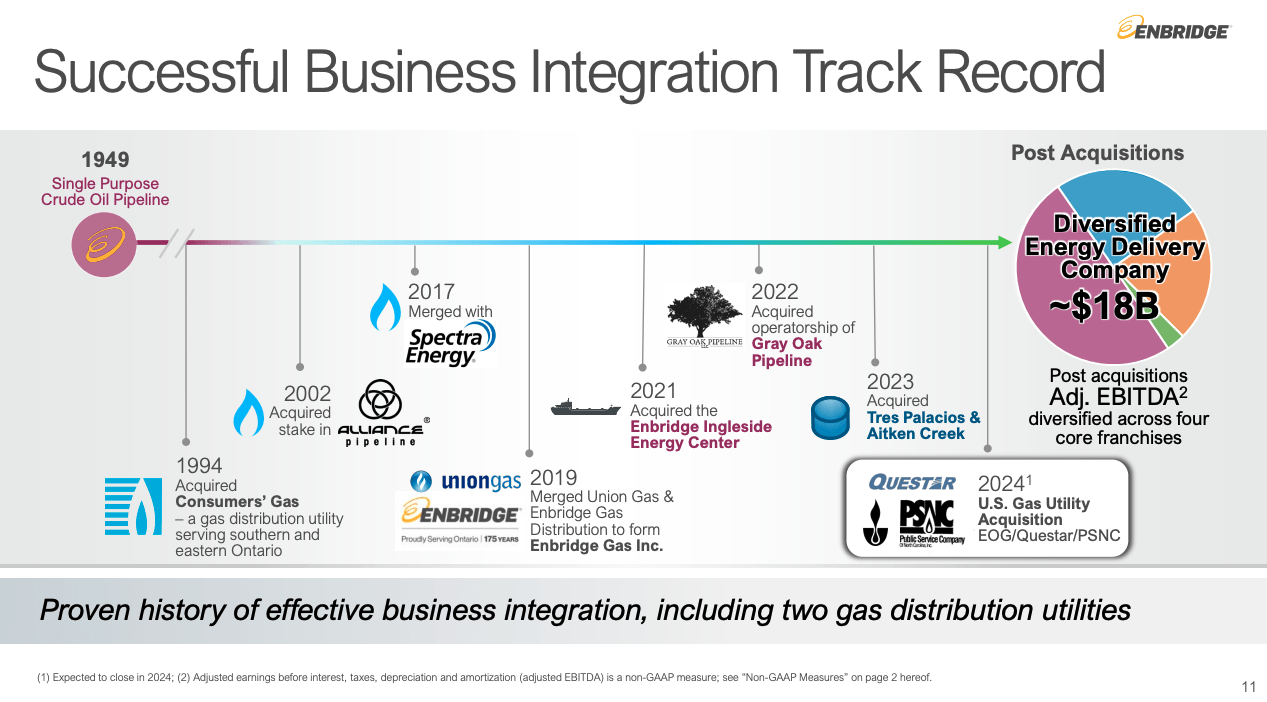
Now it is time for the second slide ( Source ):
Diversification since 1949 (Dominion Acquisition Presentation - Slide 11)
Here we can see how Enbridge managed to diversify from a 100% crude oil pipeline business into the energy infrastructure juggernaut it is today. The oil pipeline business as a percentage of the overall operations dropped from 100% to 50%, while natural gas transmission now accounts for around 25%, Gas Distribution and Storage for 20% and Renewables for 5% (post Dominion acquisition). If you prefer a pure play on oil pipelines, Enbridge isn't the right pick for you. In my opinion, such a diversified business is what I look for in a high-yield infrastructure stock like Enbridge. Safe, reliable and growing dividends with a bit of built-in growth through regulated inflation protection. That is what you get by investing in Enbridge.
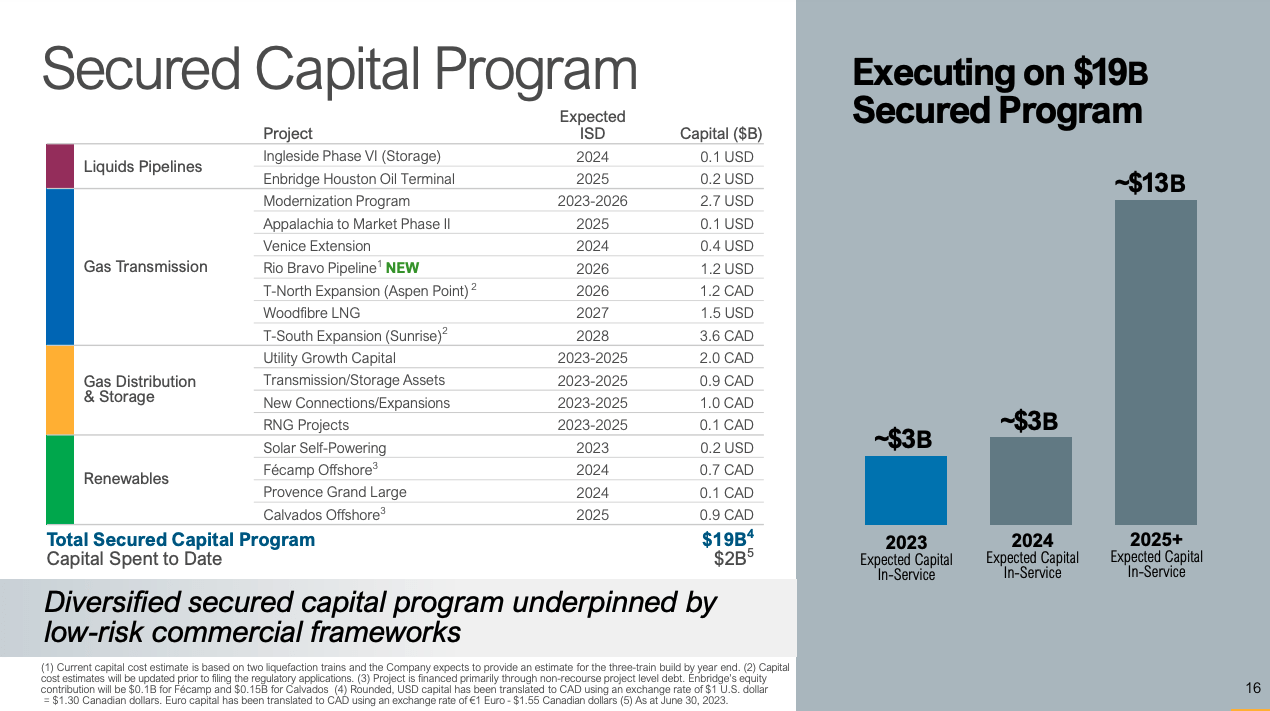
To finish this section up, I want to show you where Enbridge is headed in the future (besides the LNG export strategy I already mentioned earlier):
Future Capital Program (Enbridge Q2 23 Earnings Presentation - Slide 16)
Here we can see where Enbridge plans to invest in the next couple of years. Liquids Pipeline investments are supposed to be only $0.3 billion while Gas Transmission stands at $10.7 billion. Gas Distribution and storage investment will be $4 billion and Renewables $1.9 billion. It is safe to say that Enbridge will keep pushing towards diversifying its business even further, especially in Gas Transmission. If you are a believer in natural gas and LNG exports, you should consider Enbridge for your portfolio.
Balance sheet
I will start by taking a look at ENB's balance sheet. Here is a screenshot showing ENB's balance sheet at the end of Q2 23:
ENB Q2 23 Balance Sheet (Q2 23 Financial Statements)
The things that are of interest to me are (1) net debt and (2) Goodwill and tangible invested capital.
(1) Net debt
I calculated net debt as:
Cash and cash equivalents
- Short-term borrowing
- Current portion of long-term debt
- Long-term debt
= Net debt
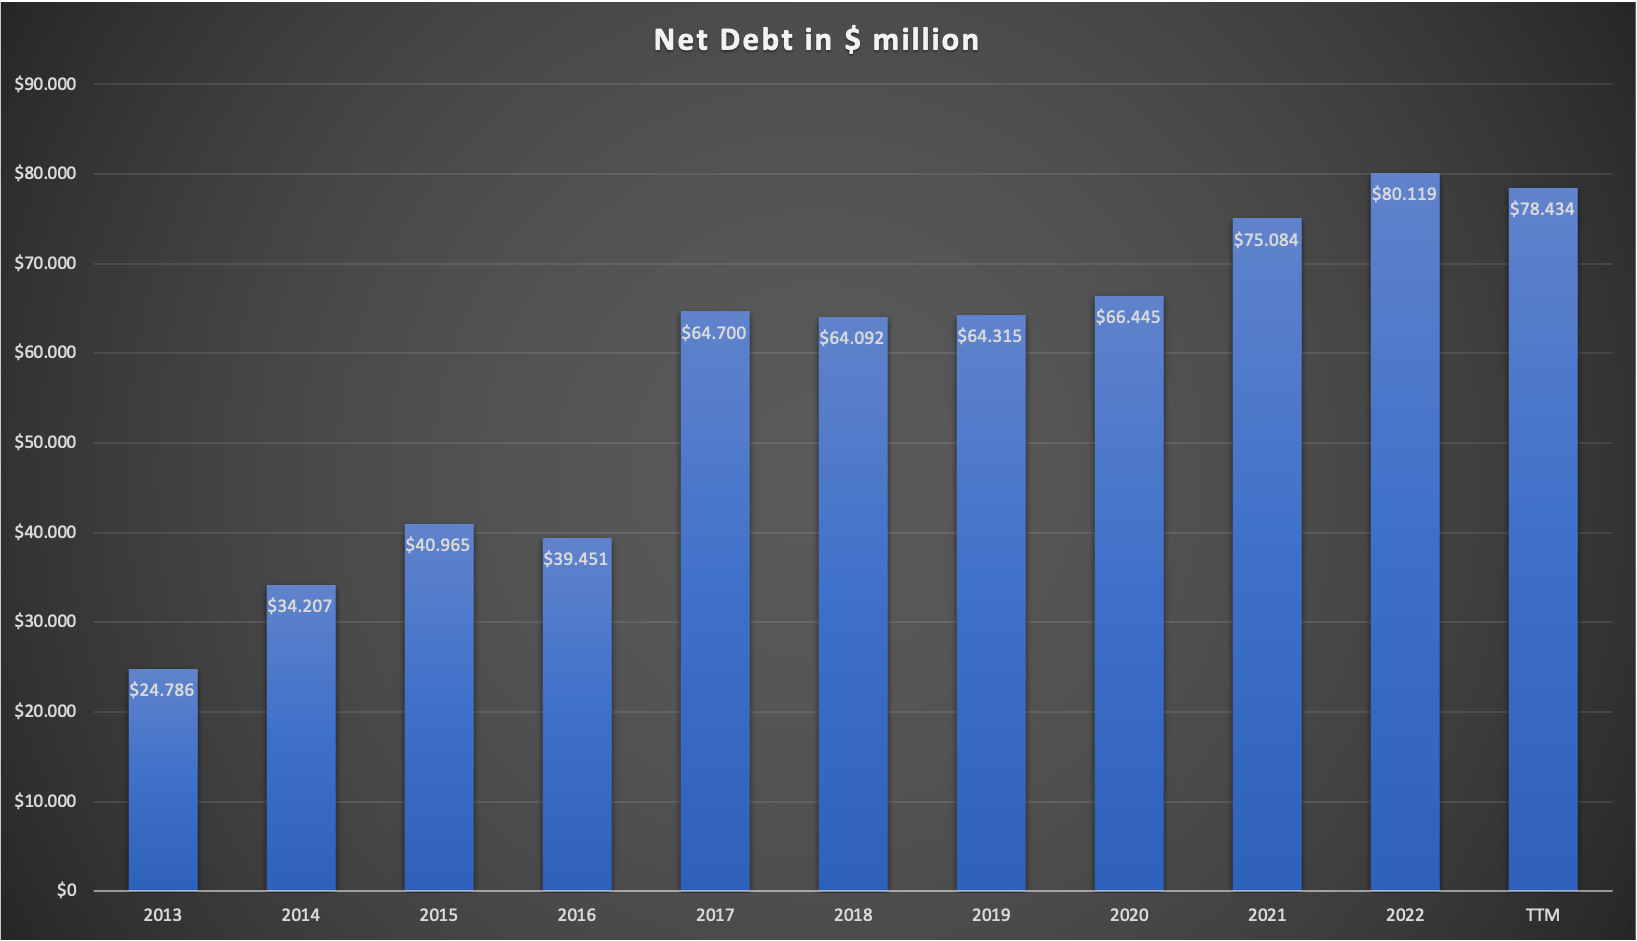
Net debt stood at $78.4 billion at the end of Q2 23, down from $80.1 billion at the of FY2022. Here is a chart showing the development of the net debt position since FY13:
ENB Net debt since FY2013 (Company reports - compiled by Author)
Enbridge has a very high debt position. Since the business model is very capital-heavy, that makes sense and is not necessarily worrying. The big debt jump in FY17 is a result of the merger with Spectra Energy which was announced on September 6, 2016. Enbridge financed the deal with cash/debt and newly issued shares (shares outstanding grew from 911 million in 2016 to 2,017 million in 2019, fully diluted weighted average for the FY).
Now only looking at total net debt wouldn't be sufficient without setting it in relation to ENB's earnings power. The most commonly used metric, which I will also use, is net debt to Adjusted EBITDA. Enbridge only reports Adjusted EBITDA since 2017 (with a number for the prior year 2016 being included), which is a bit disappointing but it will do the job. Here is a chart showing net debt to Adjusted EBITDA since FY2016:
ENB Net debt / EBITDA since FY16 (Company reports - compiled by Author)
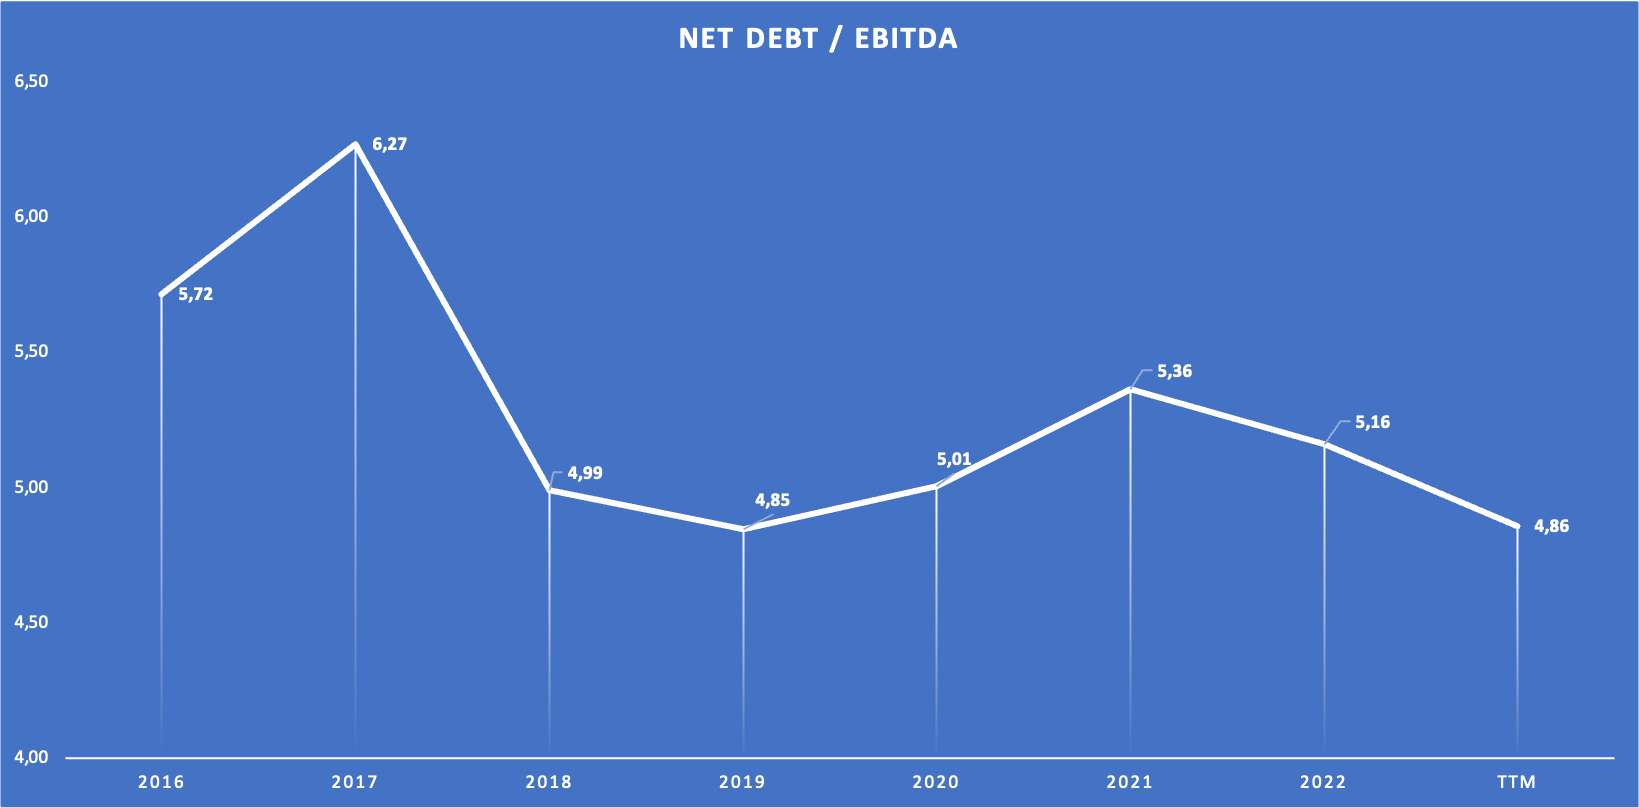
We can see that the ratio was at its highest in 2016 and 2017, the years of the aforementioned Spectre merger. According to ENB's Q2 23 earnings presentation (see slide 15), ENB sets its leverage target at 4.5x-5.0x (net debt /EBITDA). After reducing leverage a bit since FY2021, ENB currently sits at the upper end of this range. While leverage is high, this isn't uncommon for asset-heavy infrastructure companies like ENB. YTD2023 interest expense (as reported in the consolidated statement of earnings) amounts to $1,788 million, which would amount to $3,576 million annualized. With Adjusted EBITDA for the TTM of $16,145 million, the interest coverage stands at around 4.5x at the moment. Not the best, but sufficient.
(2) Goodwill and tangible invested capital
Let me first explain why this is important to me. If you have read some of my prior articles, you might recall that I usually use my version of the return of capital employed (ROCE) to gauge a company's quality/moat. My definition of ROCE is:
Operating Earnings (EBIT) divided by (Shareholders Equity + Long-term Liabilities - net cash if there is any)
This will usually yield some reasonable metrics. In the case of ENB, we have to make several adjustments to make this work. I will go over the adjustments needed for EBIT later and focus on the denominator for now. Since ENB is an asset-heavy business, we need to factor out bigger non-tangible items. In this case, this is the Goodwill ENB added to its balance sheet because of the Spectre merger. You might disagree with this and this is fine. My reasoning for this is that I want to know how much return on capital ENB can achieve on its tangible assets. So I will use the aforementioned formula like this:
Shareholders Equity + Long-term Liabilities - Goodwill = Tangible invested capital
There is no net cash so we don't have to bother with that position. Here is the result:
ENB Tangible invested capital (Company reports - compiled by Author)
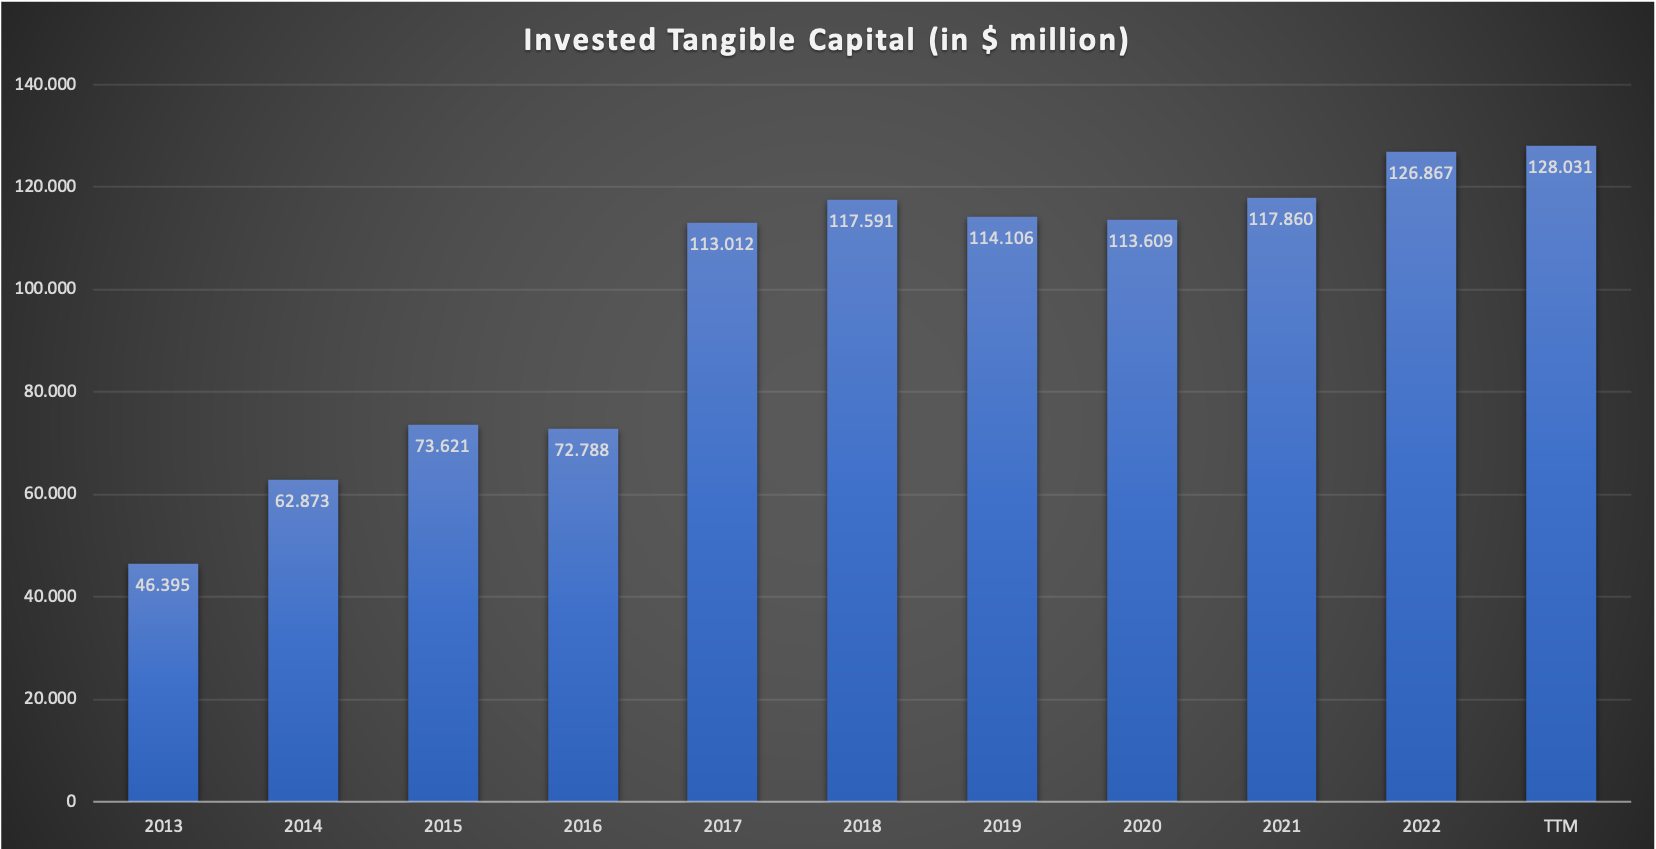
We want the invested capital to grow consistently and it does. The CAGR from FY13-FY22 comes in at 11.8% but is distorted by the Spectre merger. The CAGR from FY17-FY22 comes in at a more reasonable 2.3%. This number will be important later on so try to keep it in mind.
Earnings
I want to start by giving an overview of the reported earnings metrics since ENB changed its reporting in FY17. The main reporting metrics provided by ENB are:
- Adjusted EBITDA
- Distributable Cash Flow ((DCF))
- Adjusted Earnings
Adjusted EBITDA is the normal EBITDA, mainly adjusted for unrealized derivative fair value gains/losses and asset/goodwill impairments.
Adjusted Earnings is Adjusted EBITDA minus depreciation/amortization, interest expenses, taxes, earnings attributable to NCI and preference share dividends. It is a metric I will not use.
The most important metric for us is DCF. DCF is calculated as follows:
Adjusted EBITDA - maintenance CAPEX - interest expenses - income taxes - distributions to NCI + cash distributions from equity investments - preference shares dividends
So this is the equivalent of the classic Free Cash Flow ((FCF)) that we use for "normal" companies, just that we only deduct maintenance CAPEX here while we deduct maintenance and growth CAPEX for the calculation of FCF.
I will also use what I call Adjusted EBIT to calculate returns on capital. This is just Adjusted EBITDA minus depreciation and amortization.
Let's start with a chart showing all of the three metrics I will use:
ENB Earnings metrics since FY16 (Company reports - compiled by Author)
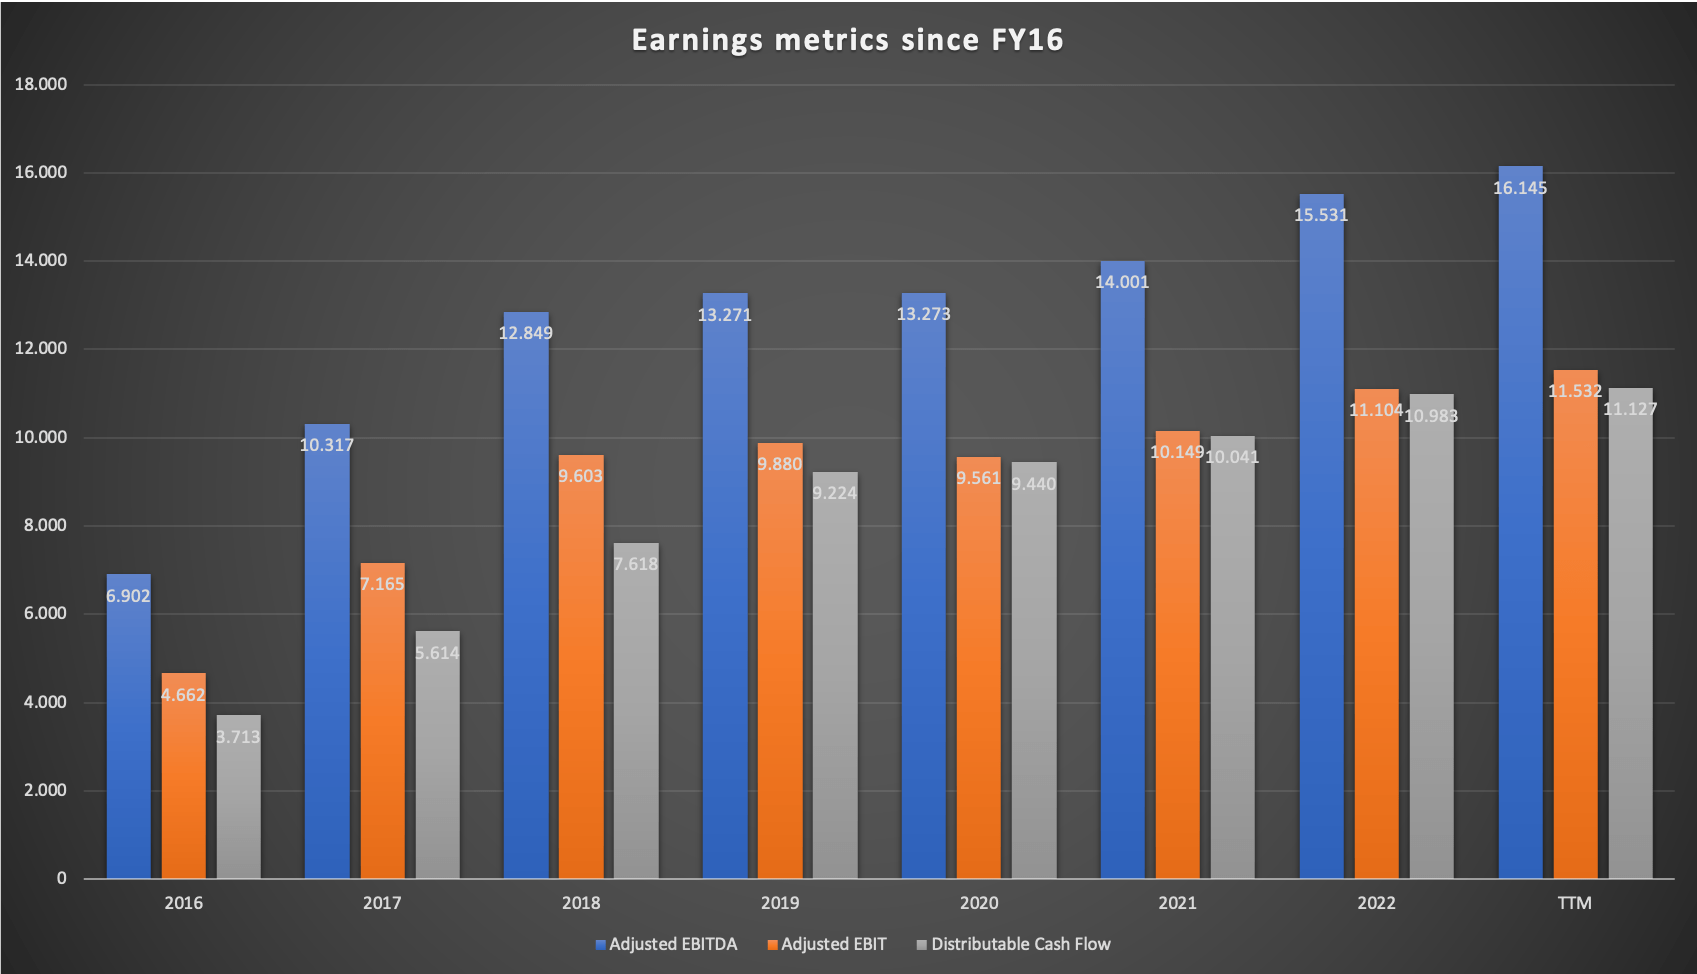
We can see that Adjusted EBITDA and DCF have steadily risen while Adjusted EBIT had one decline year in FY20. We can also see that the gap between Adjusted EBIT and DCF has closed over the past few years. The main reasons for this are (1) lower maintenance CAPEX and (2) lower distributions to NCI.
Since shares outstanding have risen from 911 million in FY16 to 2,025 million in FY22, let us also take a look at the per-share metrics to make sure shareholders got their share of the earnings growth. I will restrict this to the DCF per share since it is the most important metric for us:
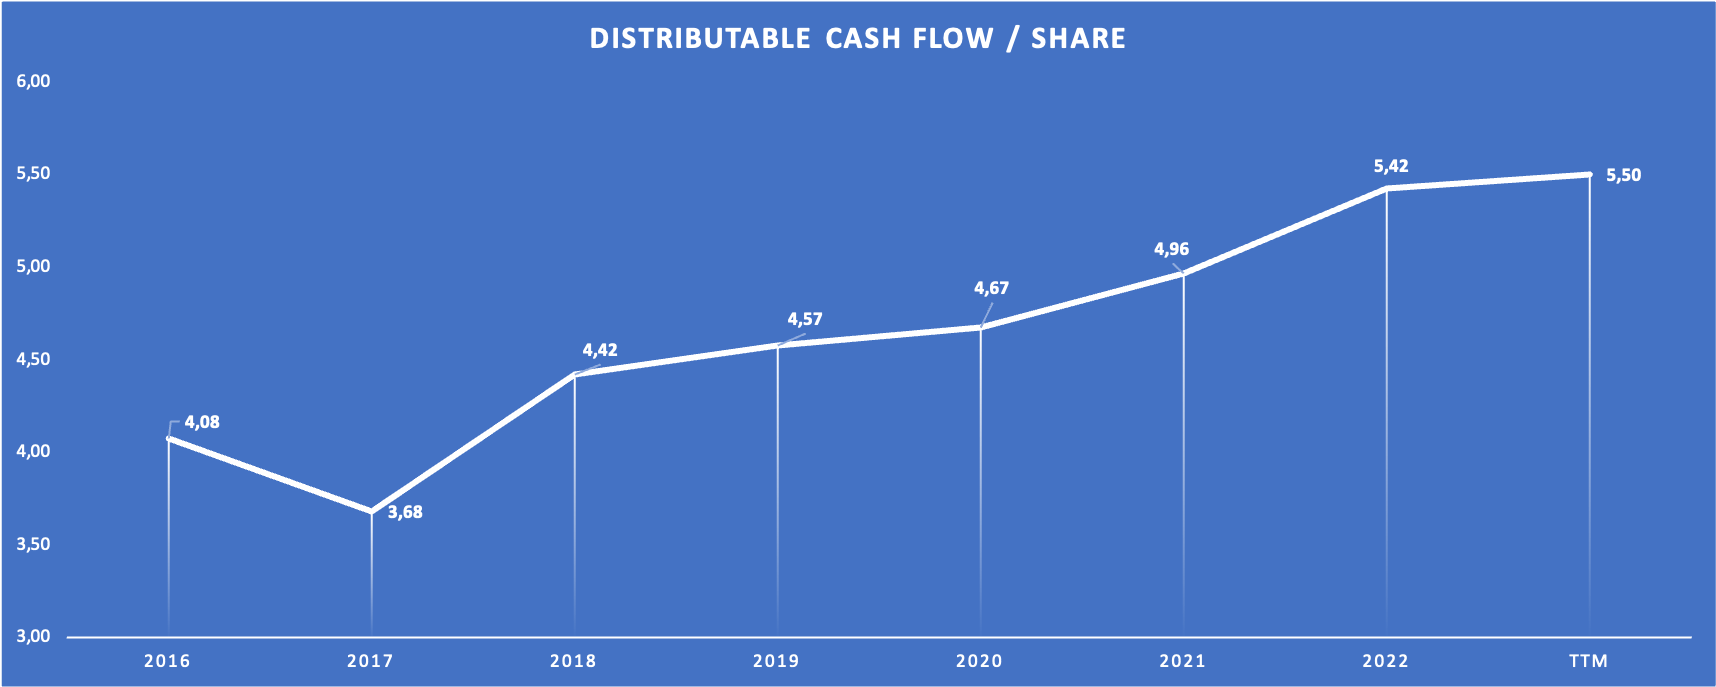
These are the charts I like to see. After taking a temporary hit in the year of the Spectre merger, DCF per share grew every year. The CAGR from FY16-FY22 comes in at 4.9% (this number will also be important later), a decent number for a high-yield company like ENB. As we can see in this slide from the last investor day, this track record has been going on since 2006 (ENB used Adjusted Earnings/share as the main reporting metric until 2015):
Per share earnings since FY06 (2023 Investor Day Presentation - Slide 80)
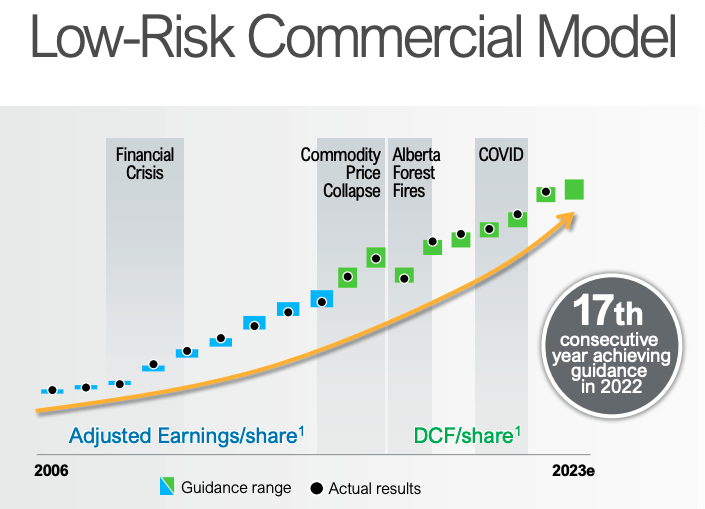
Another impressive thing about this chart is that ENB has done an outstanding job guiding earnings/DCF per share in the past. This is a testimony to the predictability of ENB's business model and cash flows.
Now I want to turn to the ROCE I mentioned earlier. I calculated what I called the "Invested Tangible Capital" and the Adjusted EBIT. Here is the chart showing my assumed returns on tangible capital (or the Adjusted ROCE) for ENB:
Returns on tangible capital (Author's estimated with numbers from company reports)
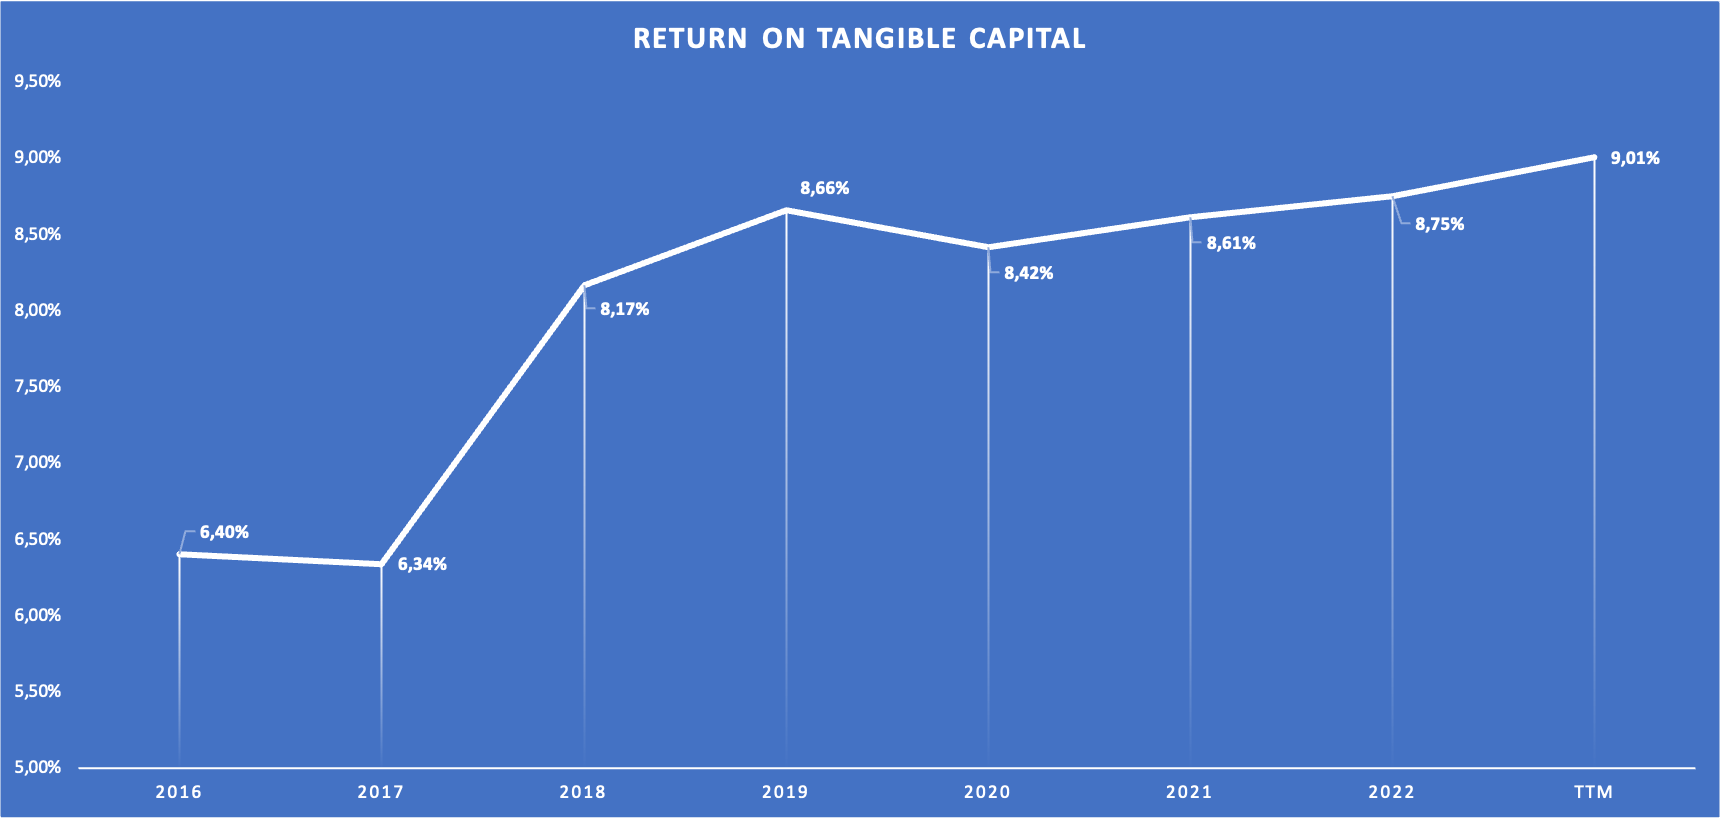
ENB was able to increase returns on capital after the Spectre merger to the high 8% range. 8-9% returns on capital are not great. That's why ENB doesn't deserve a high-valuation multiple and trades on a high yield. These numbers will be important later on so I will refer back to this later in the valuation section.
Lastly, I have to lose some words on ENB's dividend since it is one of the main (if not the only) reasons to invest in ENB. Here is a slide from the last investor day regarding ENB's consistent dividend payments:
ENB Dividend history (2023 Investor Day Presentation - Slide 84)
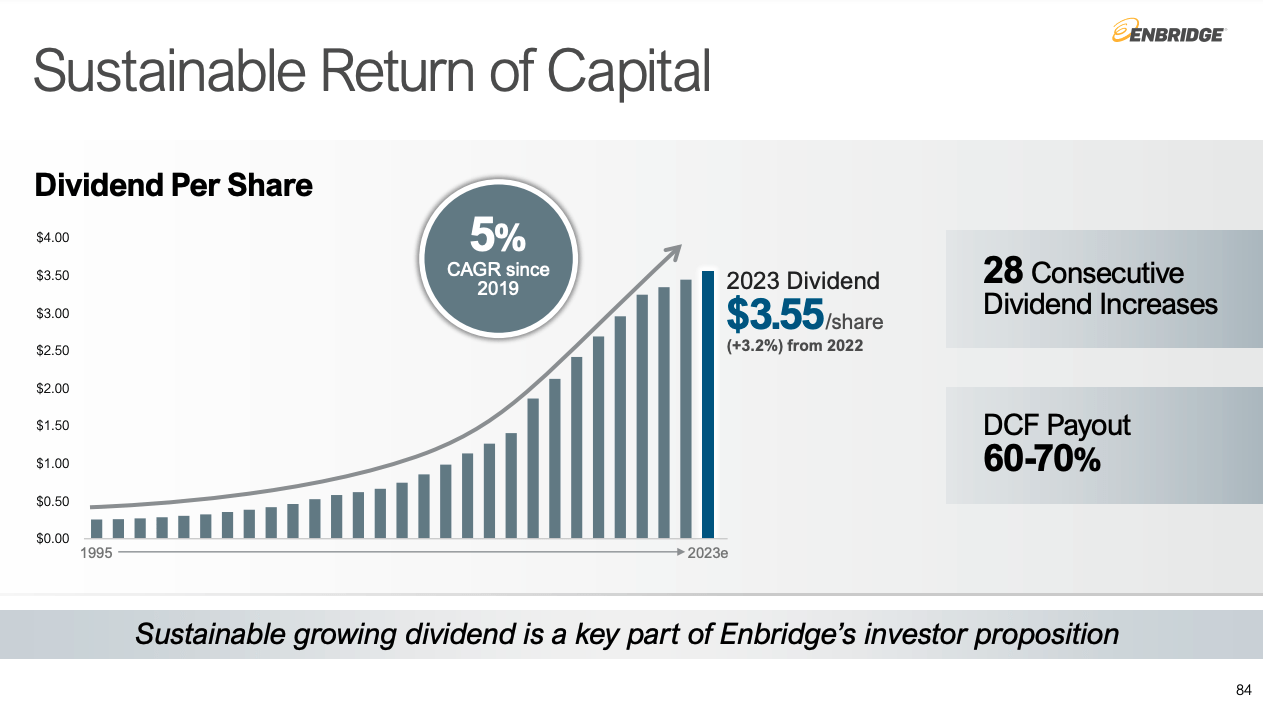
ENB has a dividend track record of 28 years and aims for a DCF Payout of 65% at the midpoint. According to this document showing ENB's dividend history, the dividend stood at $0.25 per share in 1995, the year before ENB started the aforementioned 28-year streak of raising the dividend. With the $3.55 per share that is currently paid for FY23 annualized, the dividend growth CAGR over the last 28 years came in at 10%. While we cannot expect such growth rates in the future, this track record is amazing.
Dominion Deal
On September 5, 2023, ENB announced the acquisition of three U.S.-based utilities (East Ohio Gas Company, Questar Gas Company and Public Services Company of North Carolina) from Dominion Energy. The purchase price amounts to $19 billion with around $13 billion of cash consideration and $6 billion assumed debt.
ENB planned to finance the deal by issuing 89,490,000 shares for $4 billion ($44.70 per share). The underwriters also had the option to purchase an additional 15% (which they used). So the dilution is 102,913,500 shares or 5% (with outstanding shares standing at around 2,024,000,000 before the offering). For the remaining amount, ENB has obtained debt financing commitments of $9.4 billion. I would have liked ENB to get this deal done without issuing new shares but so be it.
The more important question is if this was a good deal for ENB. Before going over the numbers, I want to address what this deal means for ENB's overall business. I highlighted earlier that this deal diversifies ENB's operation away from liquid pipelines and Gas Transmission toward Gas Distribution. Here is a slide from the transaction presentation showing what I mean:
Dominion Diversification (Dominion Deal Presentation - slide 8)
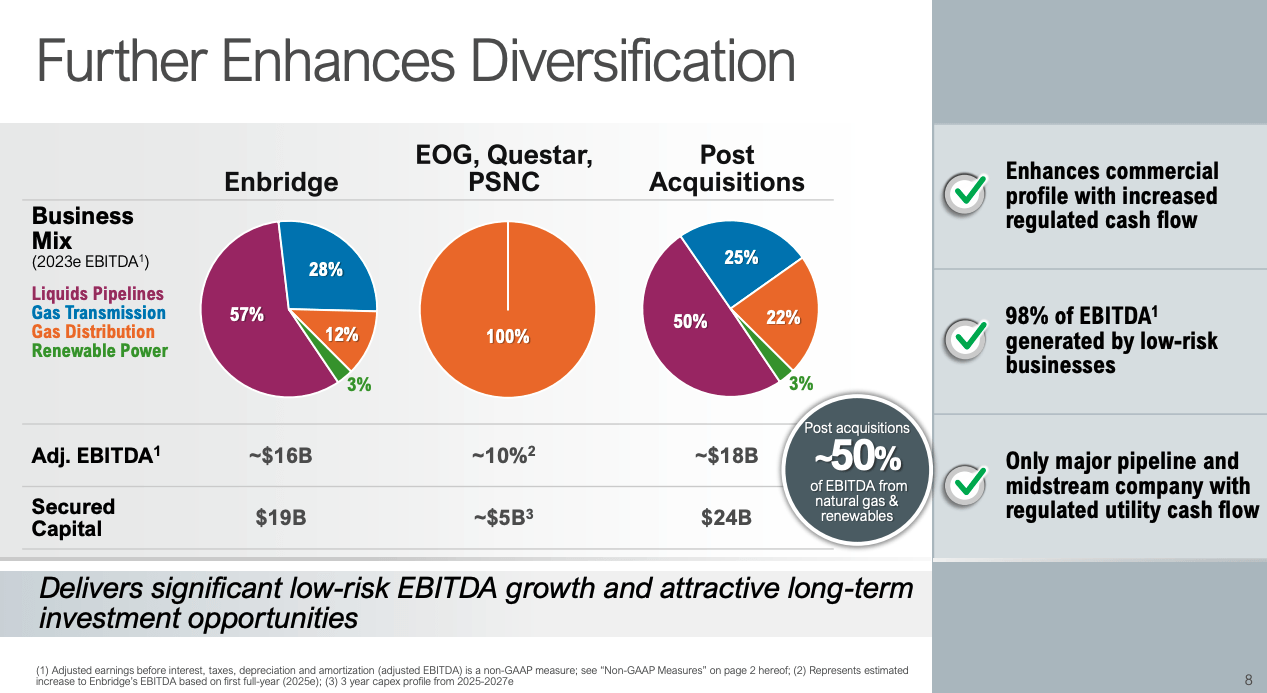
The deal nearly doubles the Gas Distribution exposure and reduces the liquids pipelines exposure to 50%.
I said earlier that before the deal, the Gas Distribution business was limited to Ontario. The deal now diversifies regionally inside the Gas Distribution business, as can be seen in the next slide from the presentation:
Gas Distribution Diversification (Dominion Deal Presentation - slide 9)
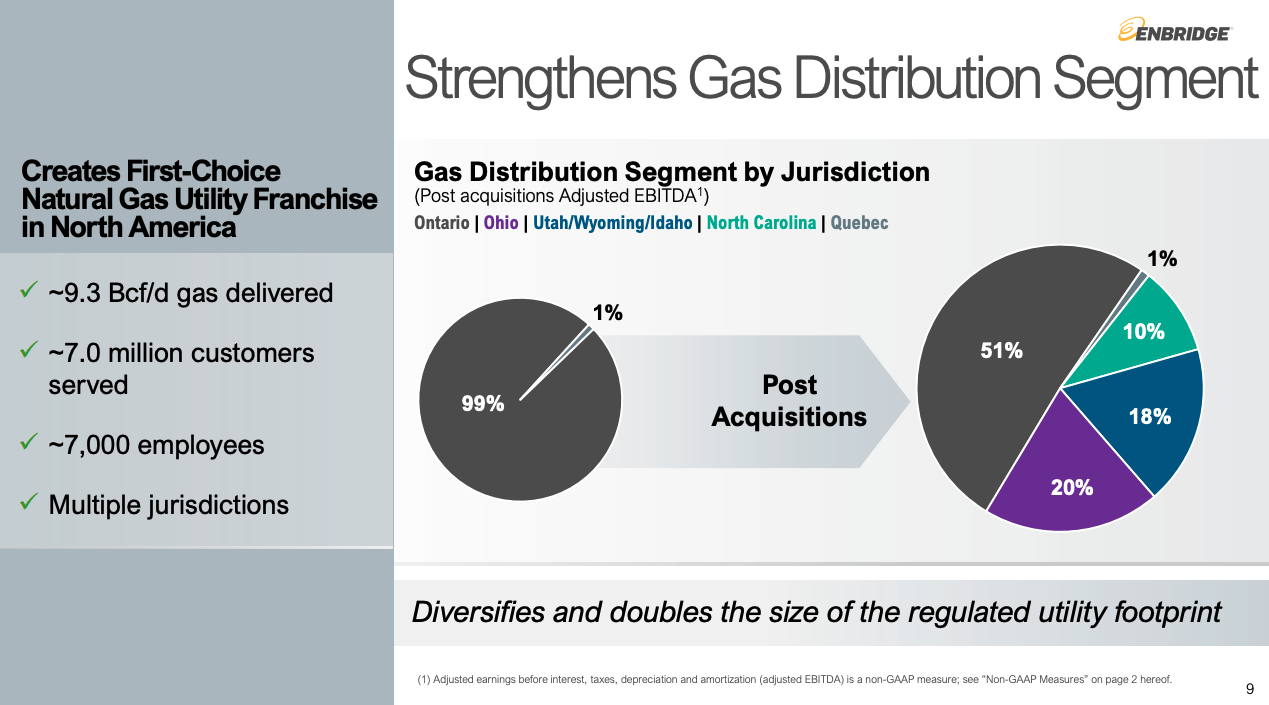
After the deal, the Ontario exposure of the Gas Distribution business will be reduced by close to 50%. So this deal diversifies ENB's business throughout the whole company. This should make ENB's business and cash flows even more resilient because issues in one region/segment are not that material to the overall business anymore.
Now let us go over the numbers. ENB says that they bought these assets at around 16.5x Price-to-Earnings (based on FY2023e) and that the deal is expected to be accretive in the first year of full ownership, which would be FY2025. 16.5x Price-to-Earnings sadly doesn't tell me anything because I need to how much DCF this translates to. What I do know though is that the Dominion assets are supposed to generate around $2 billion Adjusted EBITDA in FY2023 (see slide 8 from the presentation I showed you above, $18 billion post-acquisition minus $16 billion pre-acquisition = $2 billion). So ENB paid around 9.5x Adjusted EBITDA for these assets. Meanwhile, ENB is trading at 10.3x Adjusted EBITDA right now (EV/Adjusted EBITDA). This indicates that the deal might indeed be accretive.
But let us not stop here. ENB doesn't report DCF for each business segment so I don't know what the average ratio of DCF to Adjusted EBITDA for the Gas Distribution segment could be. I only know that DCF as a percentage of Adjusted EBITDA hovered around 70% on the consolidated level over the past few years. Let us just assume that this is also true on the Gas Distribution level. In this case, the acquisition should increase DCF by around $1.4 billion.
Now that we know this, we need to look at the financing side. Let's start with the equity financing. ENB currently trades at a DCF yield of 12.62% and they will issue $4.6 billion. So the cost of equity in $ numbers should be $4.6 billion x 12.62% = $581 million.
Since the $6 billion of assumed debt should already be included in the $1.4 billion added DCF above, this leaves us with $8.4 billion of cash consideration that needs to be financed. ENB's preferred shares like Series D, F and H (where the coupons reset not long ago) trade at yields a bit above 9%. So let us assume debt financing will have to take place at 9.2%. Then interest expense would be around $773 million per year (9.2%x$8.4 billion).
Now we can use these numbers to guess if the deal is accretive or not:
$1.4 billion added DCF - $773 million interest expense - $581 million equity cost = $46 million surplus.
So after my calculation, the deal should be accretive in the first year of ownership just as ENB stated in the announcement. The accretive effect will be negligible though.
Valuation
Author's note: Quick reminder that all numbers stated earlier referred to Canadian Dollars. For valuation purposes, I will add the US$ amount if needed.
There are currently 2,024,000,000 shares outstanding at $43.57 (US$ 31.39), resulting in a market capitalization of $88.2 billion (US$ 63.5 billion). With the DCF coming in at $11,127 million for the trailing twelve months ((TTM)), ENB currently trades at a DCF yield of 12.62%. So at first glance, ENB looks very cheap. But there is a problem. DCF only accounts for maintenance CAPEX and not for growth CAPEX. We know that ENB's guideline is to pay out 65% of DCF to shareholders, so this is what the company can pay out to us. The remaining 35% will be used as growth CAPEX. So the actual FCF equivalent for ENB is 65% x 12.62% = 8.2%, so basically the current dividend.
I believe that the long-term returns of any stock will be the sum of the FCF yield (what the company can pay out to us) and the FCF growth rate. In our case, we know that the FCF part of this equation is 8.2%. So now we need to gauge the future growth rates. This is where all the numbers come into play that I highlighted earlier as being important later on.
So the growth CAGR of the Invested tangible capital (after the Spectre merger) came in at around 2.35% over the past few years. Then we know that ENB achieves returns on invested tangible capital of between 8-9% while paying out 65% of profits as dividends. So if we were to use 8.5% as an estimate, future growth rates should be around 35% x 8.5% = 3%. This number might be slightly higher if ENB can achieve returns on capital above interest costs, which isn't the case in the current interest rate environment.
So the 3% expected growth rate is pretty close to the 2.35% growth rate in invested tangible capital. This makes sense as long as the returns on capital remain stable. DCF grew with a CAGR of 4.9% from FY16 to FY22, a bit higher than both metrics. This is the result of the fact that ENB managed to increase returns on capital from 8.17% in 2018 to 9.01% for the TTM. I wouldn't bet that they can manage to pull this off again in the future though. I think ENB might be able to pull off 3% DCF per share growth in the future. ENB's medium-term outlook calls for a CAGR of around 5%, a bit more optimistic than I am. So I think my estimates are rather conservative.
So now we can sum it up: 8.2% FCF yield (basically the current dividend) + 3% DCF growth = 11.2% pre-tax total-return potential. Combined with the fact that ENB's cash flows are very predictable, this would make ENB a buy today. However, ENB would never be buy-worthy under a dividend yield of let's say 7% (according to my logic).
All of the above assumes no changes in valuation, so we need to perform a supplemental DCF calculation to see the possible effects a rerating of the stock might have on total performance. I will use FCF per share of $3.57 ($43.57 share price x 8.2% FCF yield), 3% growth over the next ten years and 2% growth into perpetuity. The discount rate is set at 10% as I always do. Here is the result:
DCF calculation (moneychimp.com)
The fair value per share should be around $48.90 per share. I did the same for the US$ numbers and the fair value in US$ should be around US$35.20 per share.
So ENB looks slightly undervalued right now with an upside potential of around 10%.
Past returns
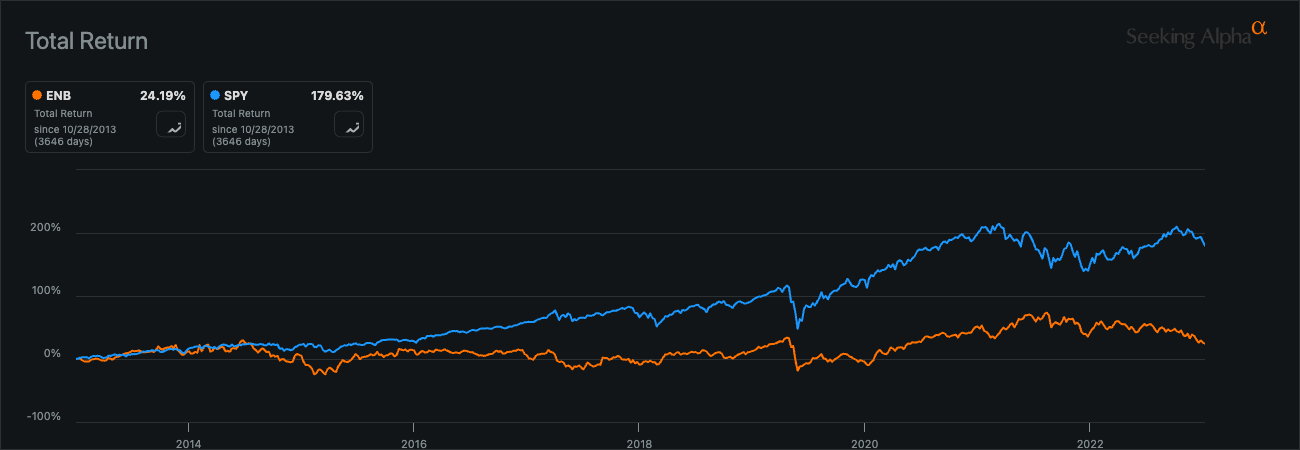
Now I want to turn to the usual bear case: The fact that ENB delivered terrible total returns over the past decade. Here is a chart from SA Charting showing ENB's total return over the past decade compared to the S&P 500:
As we can see, ENB underperformed the index by a wide margin. Now why was what?
First of all, ENB's performance without currency effects (in Canadian Dollars) came in at 63.52%, much higher than the 24.19% in U.S. Dollars. Sad for USD investors but this might as well go back in the other direction. This isn't that important, to be honest.
More importantly, the underperformance is solely attributable to valuation changes. ENB traded at $46.22 on the last day of December 2013. The dividend for FY13 stood at $1.26 per share. So back then, you bought ENB at a dividend yield of 2.73%. Remember that I highlighted earlier that ENB will never be a buy under a 7% dividend yield due to the nature of the business (low returns on invested tangible capital, fairly high payout ratio). Paying that much for Enbridge back then was close to insanity, assuming the payout ratio was the same.
But let us go a step further and assume that the valuation multiple back then was reasonable. To get the actual returns from an operating performance view we would then need to take the current dividend yield, the current price and adjust these to the valuation multiple back then. With the current dividend yield at 8.15%, we would need to multiply ENB's share price by 3 (8.15%/2.73%), resulting in a theoretical share price of $130.71 today (this is what ENB would have to trade at today if valuation multiples didn't change at all compared to 2013). That would be a CAGR of 12.24% solely due to operating performance, ignoring any valuation changes.
Past returns don't predict future returns. It always comes down to operating performance. Just because you overpaid immensely for ENB a decade ago doesn't mean that it is a bad investment today.
Bonus: ENB Preferred Shares
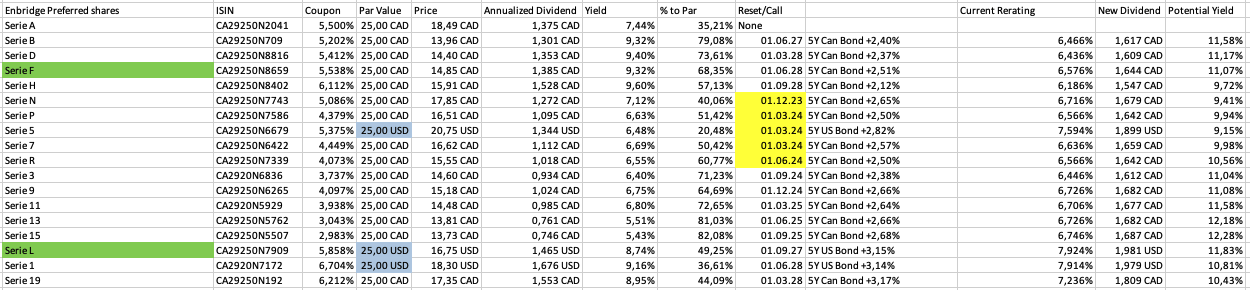
I recently took a look at all of ENB's preferred shares while using this overview from ENB's investor relations as a source. ENB has several preferred shares outstanding. Most of them are denominated in CAD but there are also some USD-denominated ones outstanding. Here is the overview I came up with:
I want to start by saying that you should not buy preferred shares on yield alone. In my opinion, preferred shares are an option for medium-term time frames due to the possibility of the shares rerating closer to par value. The higher interest rates led to a decline in all preferred issues. If you think that interest rates or financing conditions will brighten up in the next couple of years, preferred shares can pay you handsome dividends while waiting for this to occur. As financing conditions get better, preferred share issues will naturally rise to reflect these better financing conditions through their dividend yields.
The green shares (Series F and L) are the ones I want to highlight. The yellow marks are for the shares that will have their coupon reset in the upcoming months and the blue ones are the USD-denominated preferred shares. The "Yield" column refers to the current yield and the "Potential Yield" column refers to the yield if the shares would reset the coupon at the prevailing US/Canada 5Y bond yields.
ENB has a BBB+ or equivalent rating across all rating agencies. So we are looking at decent investment-grade preferred issues.
Series L (EBBNF)
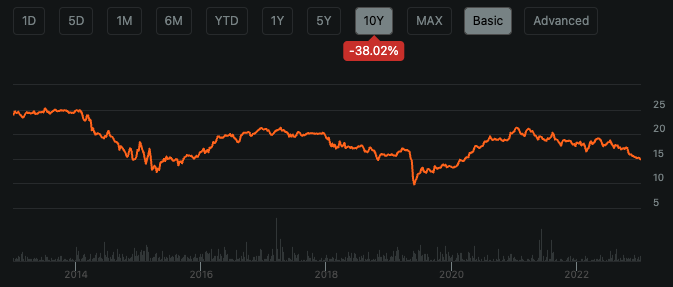
I want to start by highlighting the Serie L shares which are USD-denominated. The next coupon reset is going to take place on September 1, 2027. This is so far away that I won't discuss this any further. There is no way to predict US Bond yields so far out. At the current price of US$16.75, Series L trades at a yield of 8.74%. The upside to par value of US$25 is 49.25%. Since the underlying coupon sits at 5.858%, I don't think that it will be possible to capture all this upside if Bond yields decline. Here is a chart showing the trading range since April 2016:
We can see that the stock is trading as low as it did around the time of the Spectre merger but not as low as in the panic of the pandemic. However, it did trade in line with US Bond yields, which is not surprising. So if you think that yields will decline over the next let's say 3-5 years, you might get around 30-40% price appreciation besides a close to 9% dividend yield at a decent investment grade credit rating.
If you are not shy about investing outside of the USD, Series L looks unattractive in comparison to the CAD shares, especially Series F.
Series F ( ENB.PR.F:CA )
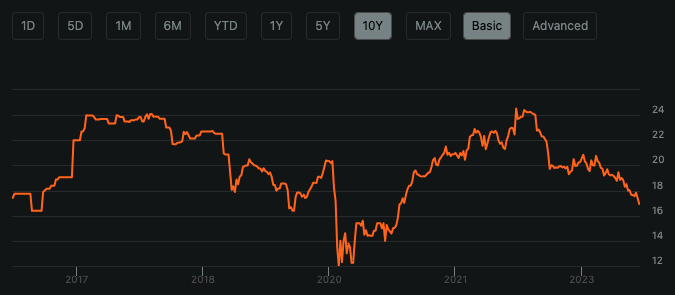
Series F is denominated in CAD and currently trades at a 9.32% dividend yield. With the current price sitting at $14.85, the upside to par value of $25 is 68.35%. However, if we look at the chart showing the historic trading range, we can see that Series F hasn't traded at $25 since 2014:
The coupon resetted recently with the next reset taking place on September 1, 2028. It makes sense that Series F hasn't traded close to par value over the past few years since the underlying coupon was set at around 4.69% in the prior 5-year window (from September 1, 2018 to September 1, 2023) and at 4% from September 1, 2013 to September 1, 2018. With the underlying coupon now sitting at 5.538%, chances that Series F might trade closer to par value are better than in the past. But just like Series L, even in the case that there might be only a 35% upside closer to the $20 range we have seen in the past, you would be looking at middle double-digit returns including the dividends.
In the end, it comes down to one question. Do you think Bond yields will stay as high as they are? I think chances are pretty good that rates will have to come down sometime soon since the governments simply can't handle the interest costs over the long term. According to this article from the Washington Post, U.S. interest payments in 2023 will rise to US$659 billion. Let that sink in for a moment. However, you can only answer this question for yourself.
Risks
Normally I would start with the valuation risk. With valuation (as defined by dividend yield as I have shown earlier) shrinking by two-thirds over the past decade, I think that valuation risks are close to non-existent at current prices. Additionally, my DCF calculation has shown that ENB seems to be undervalued right now.
I would say there are two main risks: (1) Declining returns on tangible capital and (2) Interest rate / Financing risks.
(1) Declining returns on tangible capital
As I have shown throughout this article, returns on capital have been slowly rising since 2018, the first year after the Spectre merger. If this were to reverse, we would look at a couple of years with zero growth. I can't gauge how likely this is. The only thing I know is that this will come down to the capital allocation decision of ENB's management. The fact that long-time CEO Al Monaco was replaced by Greg Ebel on January 1, 2023, can be seen as a positive or a negative. The Dominion deal is the first big deal under the new CEO and it remains to be seen if it will be a successful one. My calculations leave me to assume that ENB is at least correct regarding the statement that the deal will be accretive. The development of the returns on capital over the next few years will be testimony regarding the capital allocation decisions of the new management. It is a metric to keep an eye on in the future.
(2) Interest rate/Financing risks
This is important for the common shares and for the preferred shares, but for different reasons.
For the preferred shares, the risk is obvious. If Bond yields were to trade even higher or stay at the current level for a long time, you would walk away with "only" the dividend yields of around 8-9% pre-tax. Depending on your tax rate, this can be a decent or a mediocre return. In Germany, I have to pay around 26% taxes on my dividends. So this would leave me with only around 6-6,5% returns after taxes which is not that thrilling. While I outlined that I don't think Bond yields will stay at current levels, there is no way to know for sure.
For the common shares, the problem that arises with the current level of financing costs (equity or debt cost) is that ENB can't create additional value by financing at the moment. What I call "Value creation" takes place when a company consistently generates returns on capital above its cost of capital. This isn't the case for ENB right now. With returns on capital of approximately 8-9%, equity cost (defined as DCF yield) of above 12% and debt financing cost of above 9%, there is no way for ENB to generate additional value through any sort of financing. The Dominion deal is only accretive because they "only" pay $13 billion and seem to get $1.4 billion in DCF in return (return on capital of 10.77%).
Conclusion
Enbridge is a very well-diversified energy infrastructure business. With net debt to Adjusted EBITDA of 4.9x, the balance sheet doesn't look strong. However, this is not unusual for this type of business because ENB generates highly regulated and predictable cash flows. ENB generates around 8-9% returns on tangible capital and has been able to grow that capital base by around 2.3% per year since 2017, the year of the Spectre merger. DCF growth has outpaced the growth of the capital base by around 250 basis points because ENB managed to increase returns on capital slightly over that timeframe.
I laid out my thoughts regarding the Dominion deal in this article and I like it. It helps diversify ENB over its different business segments and also regionally inside the Gas Distribution segment. After doing the math, I am confident that the deal will be accretive, albeit on a very small scale.
I think ENB should be able to grow DCF (the most important earnings metric) by around 3% per year well into the future. Coupled with the FCF yield of around 8.2%, ENB should be able to generate low double-digit total returns from current valuation levels. Performing a supplemental DCF calculation leaves me to assume that ENB is also undervalued. I estimate ENB's fair value to be around $48.90 (US$35.20) per share.
While past returns (over the last decade) were mediocre compared to the wider market, the underperformance is solely attributable to ENB being highly overvalued ten years ago. Excluding valuation, ENB's operating performance was very good.
I presented another way of investing in the company by presenting two preferred issues. The main investment thesis for the preferred issues is a decline in Bond yields over the next couple of years while being paid high dividend yields for waiting until this decline occurs.
Risks mainly include the possibility of a decline in returns on tangible capital as a result of poor capital allocation and interest rate/financing risks.
Taking everything into account, I rate the common shares and the Series F preferred shares a "buy". I rate the Series L shares neutral, expressed by my "hold" rating.
For further details see:
Enbridge: Thoughts On The Dominion Deal And Past Returns