FLNC - Encore Wire: How To Create Value For A Pure Commodity
Summary
- Encore Wire Corporation produces and sells low-cost electrical wire and cable.
- Copper supply does not keep up with demand.
- Extremely favorable market conditions made company revenue and margins soar.
- From a conservative point of view, the share price seems fair.
Encore Wire Corporation (WIRE) interprets the ideal company model capable of transforming a commodity into a valuable asset for doing business. It has been able to optimize customer service and also innovate the product but above all, it is investing 5 times as much in depreciation to ensure production efficiency in the coming years. Extremely favorable market conditions made it possible to double the revenue and above all quadruple the EBIT margin in the last two years.
There are no guarantees that these conditions will persist in the next few years and this aspect represents the risk to run if you want to invest in a market where supply cannot keep up with demand. Precisely to protect myself from this important risk, I have implemented an extremely conservative valuation model and the share price seems to be fair.
I think that the exogenous conditions, the investments made and in progress may allow for further growth in the coming quarters and therefore my rate is Buy.
General Overview
Encore Wire Corporation produces and sells low-cost electrical wire and cable. The main application fields are traditional residential (28% in revenue terms that incorporates the new trends in renewable energy, and EV charging solutions), Industrial (automotive, oil & gas, battery plants, and others), and commercial. Other field applications are Data Centers, Healthcare, and Renewables.
The company sells wire and cable in the US mainly through independent representatives and minimally directly through their sellers. The main customers are wholesale distributors (the three main customers represent 10% of the company revenue).
The Company business strategy is focused on three main pillars:
- Customer service: high customers service level is one of the main elements on which the operations are built
- Production efficiency: low-cost production system is the other fundamental element in which the company invests through automated equipment and integrated production processes.
- Product innovation: the core product is quite a commodity (copper) and Encore is innovating through the use of different colors in wire and cable that allows obtaining various advantages in terms of speed assembly control, inspection, and also in terms of safety.
A further element on which the company focuses is the creation of an inventory large enough to meet the demand of customers who are increasingly reducing stocks in their warehouses.
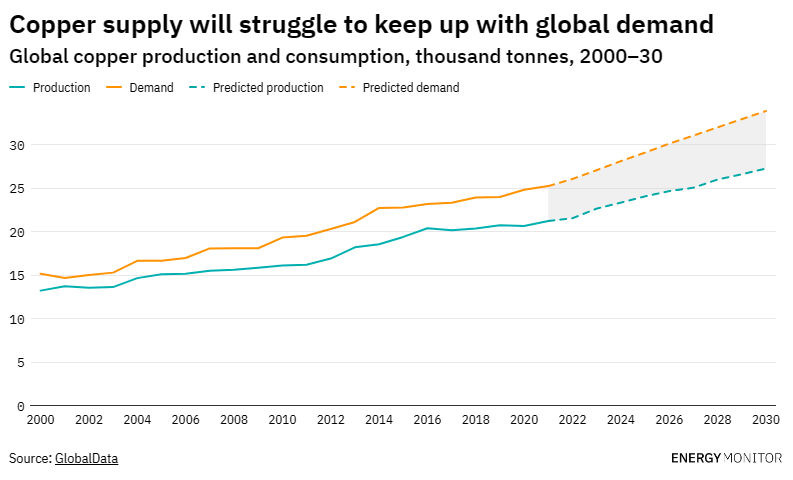
Market supply and demand
The graph shows the trend of demand (yellow line) and supply. We are witnessing a demand deficit that appears to be structural and long-term (30 years). The other data that emerges concerns the spread which seems to widen more and more.
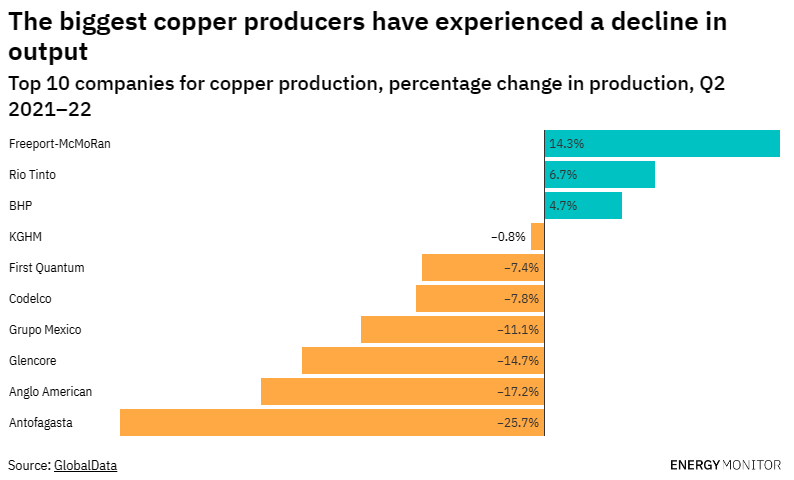
If we move on to analyze the copper production by the major producers in the world we can see how substantially most of them have reduced their production.
It, therefore, seems that we are in a period in which market demand is increasing and producers are instead slowing down. The main causes could be attributed to economic factors such as the high development costs of the mines (when compared to the selling price of copper) and the high capital required to develop and implement new projects.
A final qualitative element could be the search for a product with superior qualitative characteristics compared to the production quantity.
The above could explain the particular moment that the market is going through which, according to the management, is predominantly determining the trend of the business much more than the cost of the raw material does.
And so when folks are just watching Comex, it's certainly part of the story, but it's less important part of the story as the shape and availability of shapes to run these wire plants. So the fact that there's been an unbelievably tight market on the shape of rod that feeds wire plants, I mean the last time it was this tight, it was probably '95, '96 timeframe when there was this type of lack of availability of rod to feed these wire plants.
Source: Encore Q3 Earnings Call
Financial & Highlights
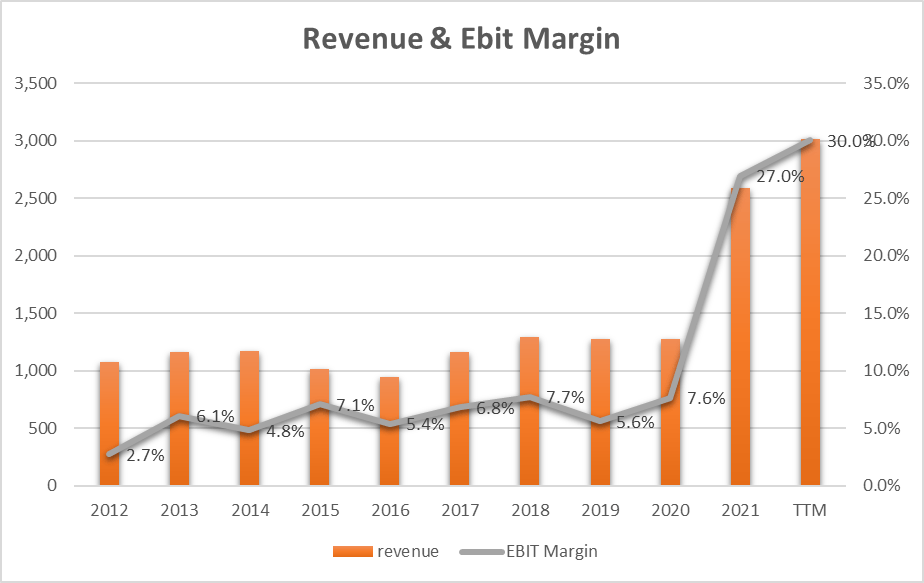
Revenue (yellow bars) remained almost constant through 2019 after which we saw a 103% explosion in 2020. The question that arises is how is all this possible?
As we can read from the 2021 Form 10-K :
The 103.0% increase in net sales dollars in 2021 versus 2020 is primarily the result of a 104.7% increase in copper wire sales. Sales dollars were driven higher by an 84.7% increase in the average selling price of copper wire, coupled with a 10.8% increase in copper wire pounds shipped. Average selling prices for wire sold were driven higher by rising copper commodity prices.
We can therefore state that 84.7% of the merit of this great result is due to the increase in the selling price of copper and this represents an exogenous factor independent of the company's capacity. However, there is still a 10.8% organic growth which instead can be attributed to the direct management of the business.
Moving on to 2022, we can note that also in this case the revenue increased by 22% compared to 2021. Reading the Q3 Form 10-Q :
The 22.0% increase in net sales was primarily the result of a 12.5% increase in copper wire sales, driven by a 4.3% increase in the average selling price of copper wire and a 7.9% increase in copper wire unit volume shipped. Fluctuations in sales prices are primarily a result of raw material input costs and availability, order specifications, and overall product demand in the market.
Also in 2022, we can see how growth is always attributable to an increase in the price of raw materials but also to a further 7.8% of organic growth.
Concerning the EBIT Margin (grey line), we can see how this has quadrupled going from 7.6% in 2019 to 30% in 2022.
To understand how this is possible, we need to analyze the composition of the direct costs that determine the Gross Margin.
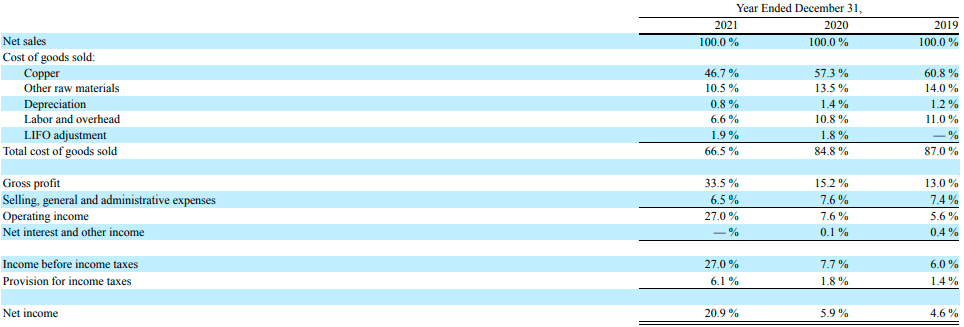
Looking at the Gross Profit we can see how this exploded in 2021 to 33.5% thanks mainly to a decrease in the incidence of the cost of copper which went from 57.3% to 46.7%. An incidence of the cost of the raw material seems to have an extraordinary incidence in the order of 10%.
Free Cash Flow and CapEx
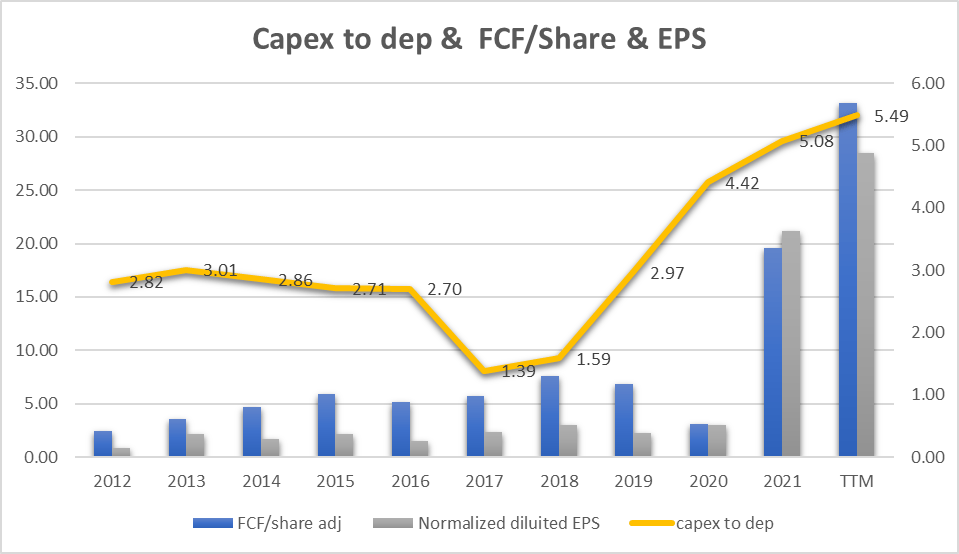
The blue bars represent the FCF/Share and mirror the trend of the EPS. This underscores a company's ability to consistently convert earnings into cash flow. The yellow line indicates the ratio between CapEx and Depreciation. We can see how until 2019 the company invested in a ratio of 1.39 to 2.97 times the assets. The ratio is high but represents a stable and probably characteristic trend of investments in technology for the production plant.
What catches the eye is instead the ratio of the last two years which has exceeded the value of 5. The company is investing enormous amounts of money in production plants. This is fueled by a large amount of Cash Flow and underlines a very aggressive strategy for future growth.
Going into the detail of the CapEx:
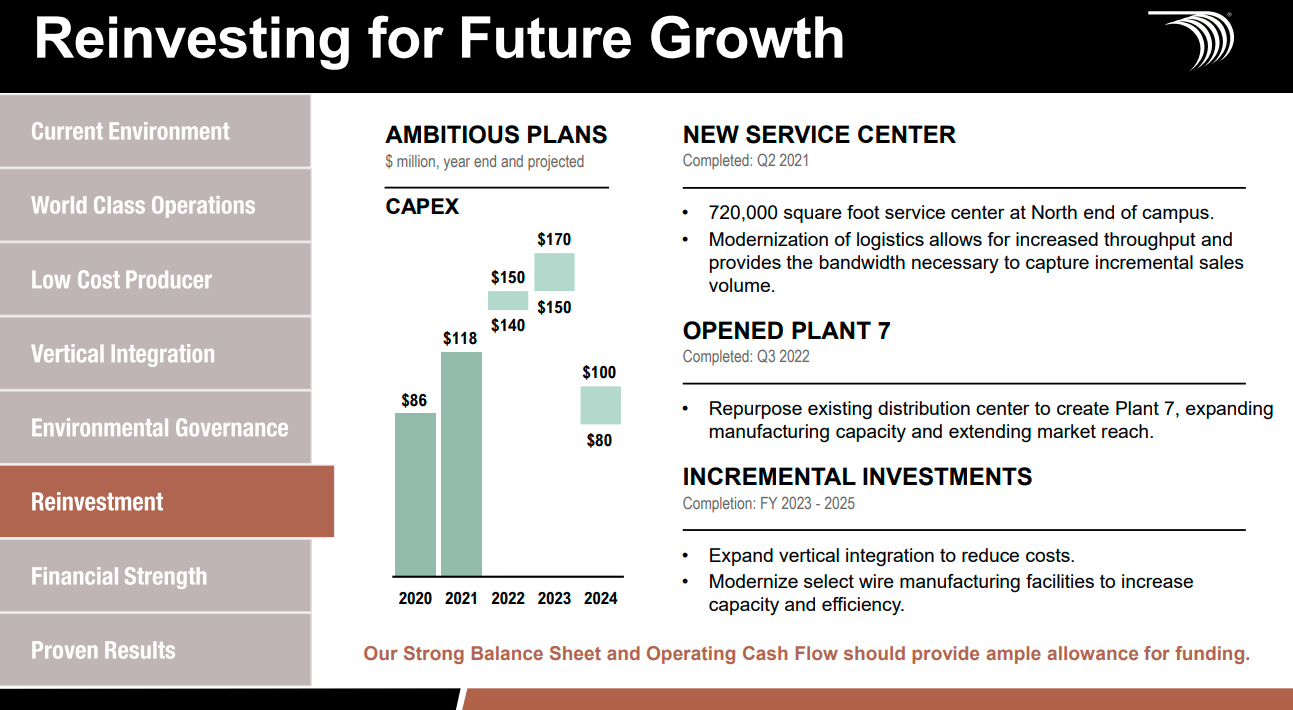
We can see that a substantial increase in investments aimed at increasing production efficiency is also expected for 2023. Starting from 2024, however, the company expects a return to normal by halving the forecast of investment spending.
Earnings Power Value Model Valuation
Assuming that the cash profit remains constant over the long term, I use the EPV (earnings power value) method to calculate the share price.
We saw in the previous paragraph how the revenue and margin data are 'doped' by a 'raw material price' effect and to define a more conservative evaluation I decided to adjust the EBIT and also the CapEx (which we have seen to be vastly overestimated).
I defined an EBIT Margin equal to that of 2021 decreased by a 'raw material cost' factor equal to 10%. This is an estimate that originates from the arguments made in the previous paragraph. EBIT Margin therefore adjusted to 17.6%. At the same time, I also adjusted Revenue assuming organic growth of 10.8% and 7.9%. The table below shows the adjusted data:
| 2020 |
| 2021 |
| 2022 |
| Revenue growth |
| 10.8% |
| 7.9% |
| adj. Revenue |
| 1,277 |
| 1,415 |
| 1,527 |
| EBIT Margin |
| 7.6% |
| 17.6% |
| 17.6% |
| EBIT |
| 97.5 |
| 249.5 |
| 269.2 |
The method starts with EBIT. The second step is to add depreciation and amortization and then subtract stay-in-business CAPEX.
Also, CAPEX is adjusted to a more standardized and estimated value of $80M
The result is the Cash Trading Profit
I then subtract the taxes by calculating the amount using the actual tax rate that the company pays.
The result is the After-Tax Cash Trading Profit
At least to calculate the total company enterprise value I divide the After-Tax Cash Profit by the interest Rate I define as fine for this kind of Company (WIRE is a low-medium-risk company so I decided to use 8%)
The result is the Total Company Earnings Power Value. Dividing the result by the total number of shares we find the value per single share.
The table below shows the calculation for WIRE
| EBIT |
| 269.22 |
| Dep & amort |
| 25.20 |
| CAPEX |
| -80.00 |
| Cash Trading Profit |
| 214.42 |
| TAX |
| 6.10% |
| TAX |
| -13.08 |
| After TAX cash profit |
| 201.34 |
| Interest Rate |
| 8% |
| EPV |
| 2516.78 |
| Share in issue |
| 18.3 |
| EPV per share |
| 137.5 |
$137.5 represents the share price valuation using the EPV method with the mentioned adjustment. If we compare the data with the current market price ($133) we see that the current price could be seen as fair.
Peers comparison
To compare WIRE with similar companies in terms of market capitalization in the Electrical Components and Equipment industry I have defined the following peers:
Vicor Corporation ( VICR )
Fluence Energy, Inc. ( FLNC )
Array Technologies, Inc. ( ARRY )
EnerSys ( ENS )
Enovix Corporation ( ENVX )
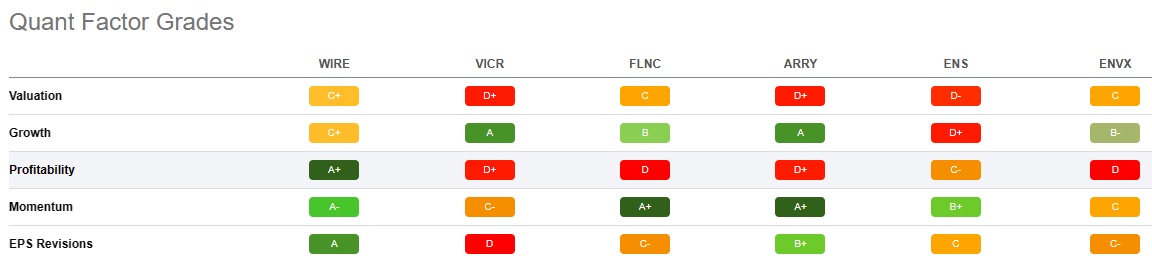
Using Seeking Alpha's Quant Ratings we have a 'Strong Buy' verdict related to the 'Hold' or 'Sell' or 'Buy' rating of the others company.
From the Quant Factor Grades point of view, we can see how WIRE is outstanding in Profitability and has the best grade also in EPS Revision. Growth and Momentum parameters show that other peers have the best grades. Only in Valuation, the grade is not good with 'C+' but is the best choice if compared to the others company. This comparison allows us to understand how at this moment WIRE is experiencing good momentum and has the ratios in its favor if compared with similar companies.
Risks
In 2021 supply chain constraints impacted the final product price in a very positive way. In 2022 copper price positively impacted the final product price. These are the exogenous fact that has exploded the revenue and also the margins in the last two years.
It is also certain that these levels of profitability cannot be guaranteed in the future precisely because of the volatility of the copper market and also because of the high competitiveness of the market itself. Copper is the main material accounting for the largest share of direct costs. Should the copper market change the wind, WIRE could encounter risks in terms of revenue and above all the operating margin. The large investments made or planned are a further element of risk precisely if the margins should become thinner.
Conclusion
Encore Wire Corporation is going through a particularly favorable market moment. The elements of a deficit in demand and the copper price represent two exogenous factors that have been driving higher revenue and profits for two years. The company is making cash and is investing the money in making its production plants more efficient and also in buying back its shares. The share price valuation seems to be fair (very conservative valuation) and market growth forecasts could support further company growth in the next few years. My rate is Buy.
For further details see:
Encore Wire: How To Create Value For A Pure Commodity