AVGO - Energy In Tech Out
2023-08-14 11:54:22 ET
Summary
- The tech sector has driven the market higher this year due to strong year-over-year financial performance and the emergence of AI as a primary growth catalyst moving forward.
- However, over the past month, the price of oil has risen and there has been a subsequent and noticeable rotation out of tech and into the energy sector.
- A complex push-pull is going on in the market due to a variety of variables: The price of oil, inflation, and the Fed Funds rate, just to name a few.
- Today, I'll discuss how those factors impact both the tech and energy sectors, and what investors can expect in the second half of the year and going forward.
- Despite the recent move higher, the energy sector is still relatively undervalued from a P/E and yield perspective - not to mention being half the percentage of the S&P500 (4.5%) as compared to 2010 (9%).
As you know, the tech sector is largely responsible for driving the market higher this year on a strong bounce-back in the sector's financial performance after being pummeled by the 2022 bear market. The tech recovery was further fueled by the emergence of AI as a positive go-forward catalyst. This, of course, has been great for the Vanguard S&P 500 ETF ( VOO ), which is +17% year-to-date, considering that in aggregate the SPDR Tech Sector ETF ( XLK ) and the SPDR Communication Services ETF ( XLC ) equate to an estimated 35.6% of the entire S&P500 ( 26.9% and 8.7% , respectively). It's been even better for the Invesco Nasdaq-100 Trust ( QQQ ) - which is +38.5% YTD.
Yet over the past few weeks there has been a rotation out of tech and into the energy sector. Indeed, over the past month the SPDR Select Energy ETF ( XLE ) has outperformed both the XLK and XLC ETFs by a significant margin (see chart below). Indeed, during the first 29 trading days of Q3, the S&P 500 Energy Sector Index has climbed 9.7% .
Prior to the last three years, the energy sector was arguably the worst sector in the entire market for over a decade. Yet despite the energy sector's strong performance over the past three years - and being the direct beneficiary of Russia's conflict with Ukraine that arguably broke the global energy (and food) supply chains - the XLE is still a relatively unloved sector. I say that because today the XLE ETF makes up only 4.5% of the S&P500 - roughly half of its weight in 2010 ( 9% ).
Seeking Alpha
As a result, and despite the excellent run in energy stocks over the past three years, the sector is arguably still a value: According to Yahoo Finance , the XLE ETF currently has a TTM P/E of only 8.3x and yields 3.67%, both of which are very attractive as compared to the broad S&P500 ( P/E=25.5x and a yield of 1.54% ).
There's currently a very dynamic and relatively complex push-pull going on between the tech and energy sectors. This week, and over the past month, the momentum traders behind the energy trade have been winning. Today I will discuss the factors behind this dynamic push-pull and what investors can expect going forward.
Technology vs. Energy: Macroeconomic Factors
A globally traded commodity market like oil and gas is impacted by a variety of factors that can have a complex relationship with each other and on prices. My followers know, I have long considered the price of oil to be the dominant factor with respect to inflation - and we know that the rate of inflation can directly impact interest rates. We also know that U.S. interest rates can impact the value of the U.S. dollar which in turn impacts the foreign currency translation ("FX") on the revenue of technology companies that generate a significant portion of sales overseas. That being the case, let's take a closer look at how these considerations impact the push-pull dynamic between oil (i.e. energy stocks) and the tech sector. I'll start with oil because it's the main determinant of inflation in my opinion, and which, as I will later explain, directly impacts the valuation of technology stocks.
Oil Supply
Despite the false narrative that the world is somehow facing a shortage of oil supply, nothing could be further from the truth. Indeed, as I explained in a previous Seeking Alpha article, we live in an Age of Energy Abundance . The U.S. shale fracking revolution has resulted in 10s of billions of bbls of proven oil and gas reserves that can be easily and very profitably drilled (with a near 100% success rate) and brought to market within a couple of months over existing pipeline infrastructure. In addition, we have elephant discoveries like offshore Guyana while the oil sands of Canada have abundant bitumen reserves (a whopping 160 billion bbls worth).
As I pointed out in my recent Seeking Alpha article on the Fidelity Energy ETF ( FENY ), Exxon ( XOM ) grew its Permian and Guyana production in Q2 by a whopping 20% yoy . Exxon is well on its way to achieving its ultimate goal in Guyana: Deploying six FPSOs, or Floating Production Storage and Offloading Vessels, by the end of 2027 in order to bring Guyana's production capacity to more than 1.2 million bpd .
In Q2, Chevron ( CVX ) grew its Permian production to 772,000 boe/d or +11% year-over-year. As the slide below from its Q2 presentation shows, Chevron has an inventory of more than 6,600 drilling locations in the Midland and Delaware Basins and plans to grow production to well over 1 million boe/d by 2030 and then will hold it at that level for at least a decade:
Chevron
ConocoPhillips ( COP ), the No. 3 largest US O&G producer, has one of the largest Permian leaseholds and had Q2 Permian production of 709,000 boe/d . - that's up from 634,000 bpd in Q2 of last year (+12%).
Meantime, on the natural gas front, last year the U.S. quickly ramped up natural gas production to replace cut-off Russian supply to the EU. As a result, last year the U.S. became the world's No. 1 LNG exporter. Which, as I have pointed out, proved that shale actually still is a "short-cycle" resource - just as energy company CEO's had been marketing it to be for over a decade (that is, at least until President Biden asked them to raise production on account of the Russian invasion of Ukraine and $120/bbl oil). Currently, United States domestic natural gas production is at an all-time high and so is total United States petroleum production.
The point here is that despite the popular narrative that the U.S. is somehow not energy independent or that somehow President Biden would "kill the energy companies," nothing could be further from the truth.
That said, obviously shale reserves must be actually be drilled, completed, and brought to market in order to ultimately impact supply and price. But after the "lost decade" of pitiful returns in the energy sector, when the idiotic "drill baby drill" mantra caused over-production into an already over-supplied market, the shale producers have discovered discipline and are spending $10s of billions on emphasizing stock buybacks instead of drilling - and in many cases, even over giving shareholders a fair shake on the dividend (i.e. like with Exxon, Chevron, and ConocoPhillips). The fact is, as high as U.S. oil production is today, it could be considerably higher with relatively modest increases in the cap-ex budgets of the major players.
Meantime, as the chart below from Statista shows, Canada has nearly doubled oil production over the past 20 years:
Statista
Meantime, Saudi Arabia recently announced it would continue its previously reported 1 million bpd production cut through September. Reuters quoted an unnamed source as saying Saudi's cut may be "extended, or extended and deepened." Shortly after that announcement, Russia jumped on board by saying it would cut oil exports by 300,000 bpd in September. As a result, and combined with previous OPEC+ cuts, those countries are keeping multiple millions of bpd off the global market.
So, clearly the planet has an abundance of oil and gas - so that isn't the problem. In my opinion, the problem is we are still burning too much of it and, as a result, quite literally burning up the planet as well.
Oil Demand
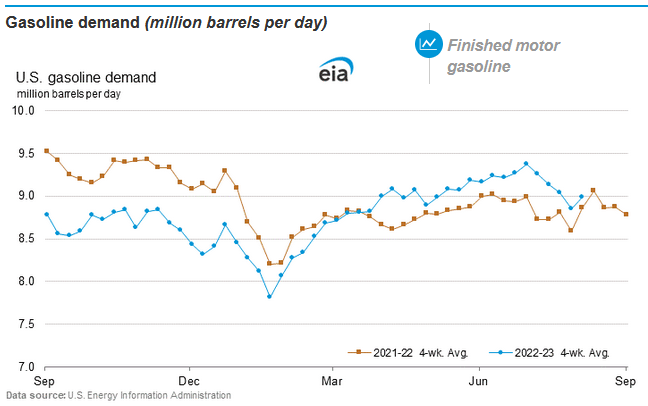
But of course as long as oil demand is strong and can soak up the current (restrained) production, prices will be strong too. From that standpoint, U.S. consumers responded to significantly lower gasoline prices this summer to demand more gasoline as compared to last year:
In this week's EIA Petroleum Status Report , we found out that:
- Total motor gasoline inventories were down by 2.7 million bbls from last week and are currently about 7% below the 5-year average.
- Total products supplied over the last four-week period averaged 20.7 million bpd - up 2.9% from the same period last year.
- Jet fuel demand continues to be very strong, and was 4.3% as compared to the same four-week period a year ago.
- At 445.6 million barrels, total crude inventories (excluding the Strategic Petroleum Reserve) is slightly below the five-year average.
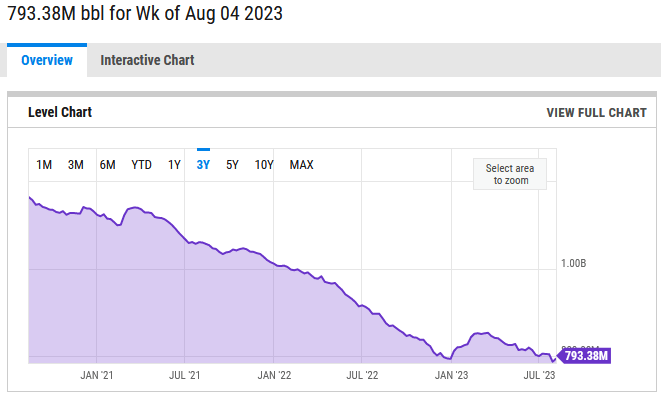
Speaking of the SPR, it currently has 348 million bbls, up from 347 million last week but down significantly from 470 million bbls one year ago (see Analysis: The Strategic Petroleum Reserve ). Net-net, according to YCharts total U.S. crude oil inventory according is down significantly over the past three years:
Meantime, the EIA reported last week that global oil demand is set to expand by an estimated 2.2 million bpd to 102.2 million bpd this year , with China - the world's No. 1 oil importer - accounting for more than 70% of that growth. And just yesterday, the U.S. and China agreed to double the number of weekly round-trip flights between the two countries (from 12 to 24). That will result in additional jet-fuel demand in a global travel market that is already quite robust.
The bottom line when it comes to global oil supply and demand: Restrained supply by U.S. shale producers and OPEC+, a significant drawdown in the U.S. SPR last year to mitigate the worst impacts of Putin's invasion of Ukraine, and combined with a general global recovery in oil demand has led to a tightening global oil market and a higher oil price. As a result, and predictably, oil company stock prices have risen inline along with the higher price of oil:
High Priced Oil: Its Impact On Technology Sector
Last year, the price of Brent crude skyrocketed to over $120/bbl after Russia invaded Ukraine. The invasion, and its huge and negative impact on the energy and food supply chains, resulted in boosting inflation - which was already high and rising from the pandemic - even higher. In response to seemingly runaway inflation, the U.S. Federal Reserve was forced to begin increasing the Fed Funds rate (see chart below). That resulted in a strengthening U.S. dollar and a wicked bear market sell-off in the tech sector due to the combination of a strong FX headwind that would reduce bottom line profits for big global tech companies, and due to expectations of lower demand due to the potential of an imminent recessionary macro environment.
I know the chart below is somewhat busy, but it shows the interplay between these variables quite nicely:
Starting from the left, you can see that Brent (in purple) was leading inflation - as measured by the Consumer Price Index ("CPI") in orange - higher. Tech stocks were still doing well because the thought process at the time was that inflation was transitory because pandemic-induced supply change disruptions were finally beginning to resolve themselves after vaccines were made available. However, starting at the beginning of 2022, you can see that Brent crude (and CPI) began to rise as tension rose over Ukraine. The tech sector - represented by the XLK ETF in green - began a sell-off that only accelerated when the invasion actually took place in February and which caused Brent Crude to temporarily jump to over $130/bbl.
President Biden, after being rebuffed by U.S. shale producers and supposed ally Saudi Arabia, responded by releasing significant volumes of oil from the SPR. In parallel, the EU's natural gas supply chain was totally and surprisingly quickly reconfigured away from Russian supplies, and the price of Brent began to fall. And CPI eventually followed it lower. That led investors to think the worst of inflation was over and to the big tech rally over the first six months of this year. However, on the far right of the chart above, you can see the turn higher that oil began on July 1. You also can see the beginning of a drop in tech stock shortly afterward.
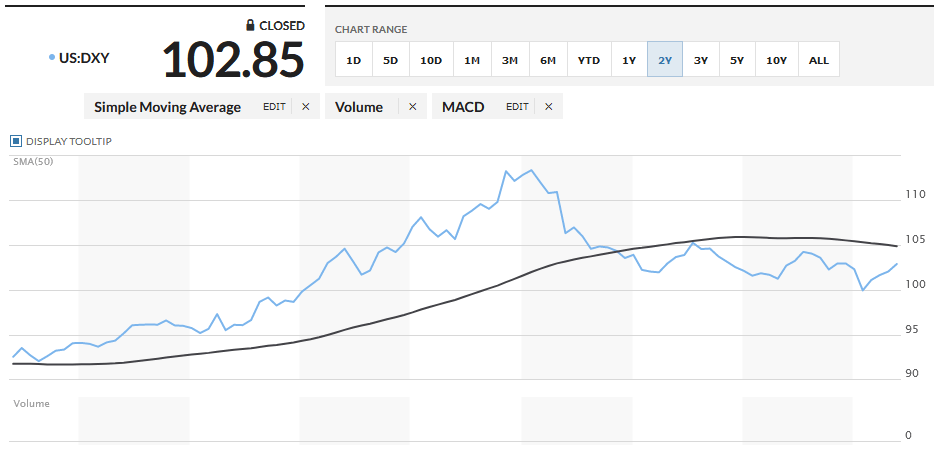
Last week's July CPI report came in at 0.2%, as expected. But while energy prices are down 12.5% yoy, they're rising and no doubt investors are watching it very closely. Shelter was 90% of the inflation number, and is still a serious problem. On a yoy basis, July CPI rose 3.2%. That compared with an expected 3.3% yoy rate. While that is progress, it's still above the Fed's target rate of inflation (i.e. 2%). Still, the U.S. Dollar Index (shown below) rose for the week. I consider the DXY index to be an anticipatory indicator as it typically moves in advance of expected developments. Regardless of whether that theory is right or wrong, clearly the strengthening of the index last year was a primary factor in creating an FX headwind for global tech stocks that was a primary catalyst for the bear market.
For example: Note that in Q2 of FY23 (the quarter ending Dec. 31) Microsoft ( MSFT ) reported diluted GAAP EPS that was -11% yoy, but +2% in terms of constant currency. In other words, FX was a 13% headwind to MSFT's bottom line earnings primarily because the value of the U.S. dollar peaked at the end of the year (see chart above). Due to the U.S. Dollar's fall since then, MSFT's most recent quarterly diluted EPS faced only a 6% headwind. That being the case, if the price of crude oil rises, and the rate of inflation rises along with it (which it no doubt will), the market will start pricing in additional increases in the Fed Funds rate. That will likely cause the U.S. Dollar Index to strengthen again. That will lead, once again, to a stiffening FX headwind for the tech sector and a subsequent revaluation of their discounted future cash flows going forward.
We're already seeing expectations of this scenario playing out. Broadcom ( AVGO ) - one of my favorite technology holdings - recently broke through its 50-day moving average after an AI-fueled rally. Once through the 50-day, AVGO hit quite an air pocket on the way down:
Summary and Conclusions
I find the interplay between the global energy markets and the U.S. tech sector to be both complex and fascinating. Currently and clearly, crude oil supply/demand fundamentals and various geopolitical and macroeconomic considerations favor the energy sector over the tech sector - at least in the near term. Momentum traders have obliged with an "Energy In, Tech Out" strategy.
That said, my followers know that I advise them to build a well-diversified portfolio and hold it through the market's up-n-down cycles. They also know I feel it's critical to have exposure to both the energy and technology sectors, albeit for different reasons: Energy for income and a hedge against inflation, tech for excellent growth and long-term wealth accumulation.
With that in mind, a title of "Energy In, Tech Out ( For Now )" may have been more appropriate for this article. I say that because long-term investors would make a big mistake to go overboard energy and to exit tech. Consider this:
- Big U.S. shale producers are going to continue growing production, albeit it at a modest pace. These companies typically have breakeven points under WTI=$40/bbl. Note that WTI closed Friday at $83.19/bbl - so shale companies obviously have a huge incentive to bring more product to market. I expect more supply than expected to come onto the market in the not too distant future.
- I suspect many OPEC producers, jealous of Saudi Arabia, are likely to start cheating on their production quotas as Brent nears $90/bbl.
- The new Trans-Mountain pipeline is expected to go in-service early next year. That will bring an additional 590,000 bpd of Canadian oil sands crude to the global market.
- Meantime, Guyana production continues to ramp up.
The fact is, and despite the newly found discipline of U.S. shale companies, higher crude prices are typically met with increased supply. That said, I do expect the second half of this year to be very strong for the energy sector. But stick with the oil producers and refiners (like Phillips 66 ( PSX ), which is just killing it on high diesel crack spreads - see the previously referenced article on the FENY ETF for details - and not the natural gas producers. I say that because there's an abundance of natural gas, and despite growing U.S. LNG export capacity, pure-play natural gas producers are faced with growing associated nat gas volumes from Permian shale producers that are targeting oil. In addition, older shale wells simply get gassier over time - and the U.S. has thousands of older shale wells. See The Demise of NYMEX Gas (Not To Mention Waha) .
Meantime, higher gasoline prices will likely motivate consumers to only accelerate the transition to EVs - of which global sales already are booming (which, I would note, is a boon to the semiconductor sector).
On the tech side, the recent sell-off could continue for a while longer and result in giving investors who have heretofore missed much of the tech rally a second chance to get into some of the higher-quality companies. I say that because:
- The 2022 bear market was a wake-up call for many tech companies that, as a result of their success, had gotten bloated and were not good stewards of shareholder capital. Today, they're much more efficient. Today, the best and biggest tech companies are generating very strong free cash flow.
- AI is real, and for some companies it is a primary and positive catalyst for earnings now: Nvidia ( NVDA ) and Broadcom, for example.
- To get maximum benefit of running AI algos on LLMs (Large Language Models), companies must migrate to the cloud in order to keep AI processors fed with low-latency high-bandwidth data. So, the "big 3" in the cloud (Amazon ( AMZN ), Microsoft, and Google ( GOOG )( GOOGL )) will continue to be market leaders going forward.
- At some point, the Federal Reserve will likely have to cut the Fed Funds rates. Currently, Goldman Sachs expects the first cut to happen in Q2 of next year .
I've been reporting on some of these trends on Seeking Alpha. For instance, in the article Q2 Surprise: Google Generated $2 Billion More Free-Cash-Flow Than Microsoft , I reported that Google continues to be a FCF machine and generated $21.8 billion in FCF in Q2 and a FCF yield of 29.2% of total revenue (up a whopping 11 percentage points yoy). GOOG ended Q2 with $118 billion in cash and has a forward P/E of 23.3x. False predictions that ChatGPT was somehow going to kill Google Search pushed GOOG stock down into the low $90's back in February (I added to my position). Any significant pullback in GOOG (say under $110) in the current "correction" would be a gift for investors who have yet to establish a position in the stock.
The previously mentioned article on Google also cleared up the false narrative that somehow migration to the cloud is no longer a primary catalyst for the hyperscalers. That is simply not the case - AI being one big reason why. Meantime, note that widely followed tech analyst Dan Ives agrees with me that any pullback in tech stocks will likely be "short-lived." So, get ready to pounce. Indeed, Broadcom already is very attractive in my opinion: It has a forward P/E of only 19.7x and - after being one of the best dividend growth stocks over the past decade (if not the best) - pays out an $18.40 annual dividend good enough for a 2.2% yield. Meantime, CEO Hock Tan noted the impact of the AI and the cloud could quadruple Broadcom's Ethernet Switch revenue in FY23 during the Q1 conference call :
In fact, in 2022, we estimated our Ethernet switch shipments deployed in AI was over $200 million. With the expected exponential demand from our hyperscale customers, we forecast that this could grow to well over $800 million in 2023.
Bottom line: Let your energy stocks run. If you want to take some profits in order to reduce your exposure at the top of a cycle, you will likely get a great chance over the next few months. For tech stocks, it's just the opposite: Prepare to pick up shares at bargain prices. I'm not as upbeat on Apple ( AAPL ) as I'm on equities like Google, Broadcom, the Van Eck Semiconductor ETF ( SMH ), and the Fidelity MSCI IT ETF ( FTEC ) - all of which I expect will grow faster than Apple over the next year or two.
Lastly, and to put thing into a broader perspective, I'll end with a 10-year total returns chart comparing the Energy XLE and its two biggest components (Exxon and Chevron), with the tech XLK and a few leading tech stocks and funds:
As you can clearly see, long-term investors that bought and held tech through all the market's ups-n-downs over the past decade have been very well rewarded and done much (much) better than O&G related equities. Odds are that will be the case for the coming decade as well.
For further details see:
Energy In, Tech Out