FNGU - Energy Plays - Uranium Oil And Gas - Are Near-Term Exhausted; May Lead To Revival In Technology Space (Technical Analysis)
2023-10-03 23:46:34 ET
Summary
- Energy thematic plays - uranium, oil & gas - look near-term exhausted. I was bullish in August, and now recommend taking profits.
- The rallies in uranium and oil & gas have coincided with the rise in bond yields and USD. These moves began in early August.
- Pullbacks in energy stocks could now lead to a softening in bond yields and the USD, which would likely lead to rebounds in the technology space.
- NVDA, TSLA, and META are holding up very well, showing relative strength.
In the past few weeks, I shared my views on the energy thematic play. I was bullish on both the uranium and oil & gas sectors.
Both sectors have done very well since and now look near-term exhausted. I would recommend taking some profit on long positions, and not buying at current levels.
As the breakouts in uranium and oil & gas coincided with the breakouts in the USD and bond yields, I think a reversal lower in the former two will likely lead to weakness in the latter two. If so, risk sentiment is likely to improve.
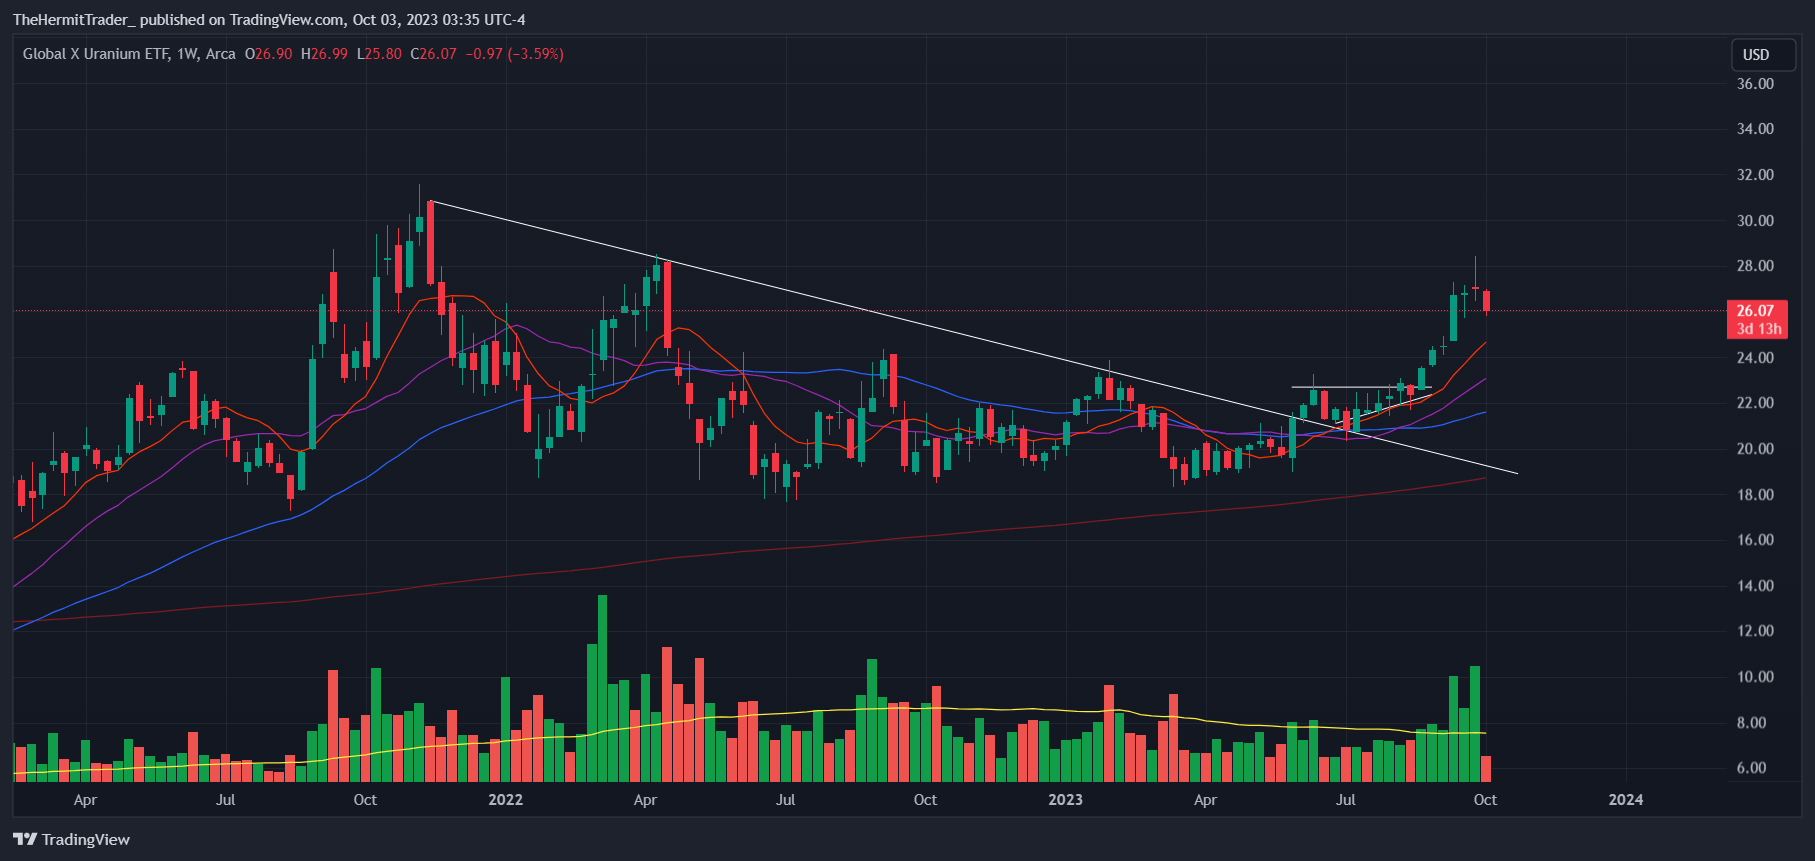
The uranium theme was first shared on 2 August here when the sector ETF ( URA ) was trading at $22.60. I wrote that URA was on the verge of breaking out strongly, and since then, the ETF has touched highs of $28.42 (+26%), and last closed at $26.07.
Weekly Chart: URA
From the weekly chart, we may observe that URA put in an inverted bearish candle in the previous week. This candle came when prices were on a steep, almost exponential trajectory, which is unsustainable.
While URA remains on a strong uptrend, I think what is likely to happen here would be consolidation / range-bound price action, with both the 10- and 20-week moving averages catching up with price. We are likely to see some back and forth around current levels.
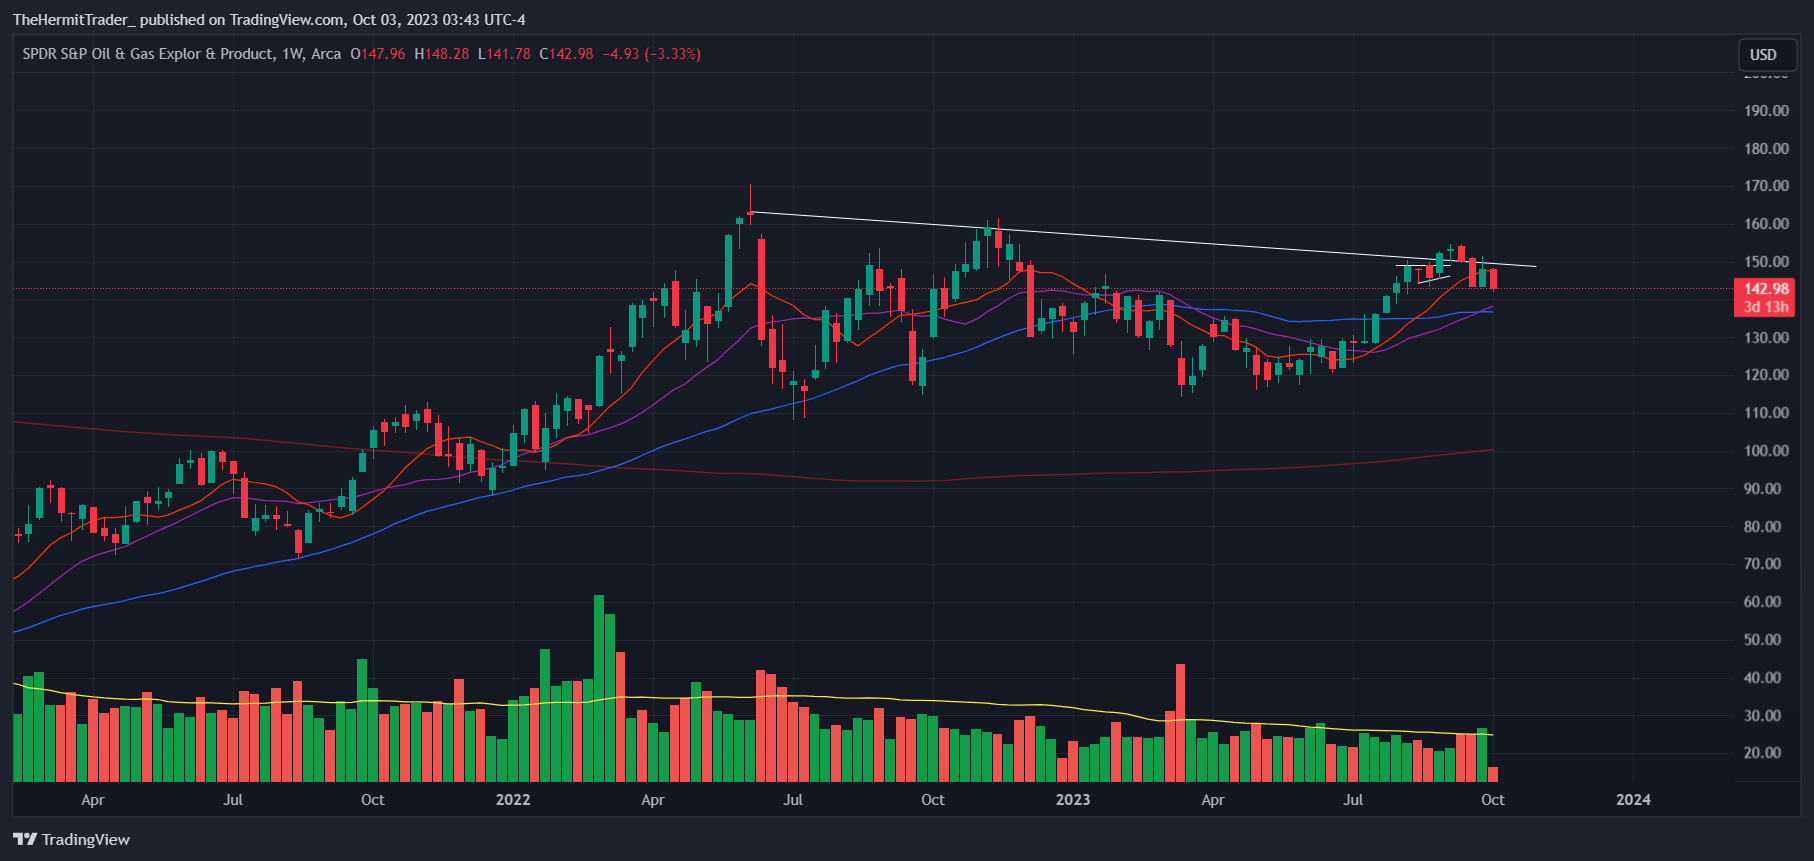
The oil & gas sector started to push higher around the same time as uranium. Similar, to URA, the oil & gas explorers ETF ( XOP ) has also met with some resistance of late. For XOP, this comes near downtrend resistance.
Weekly Chart: XOP
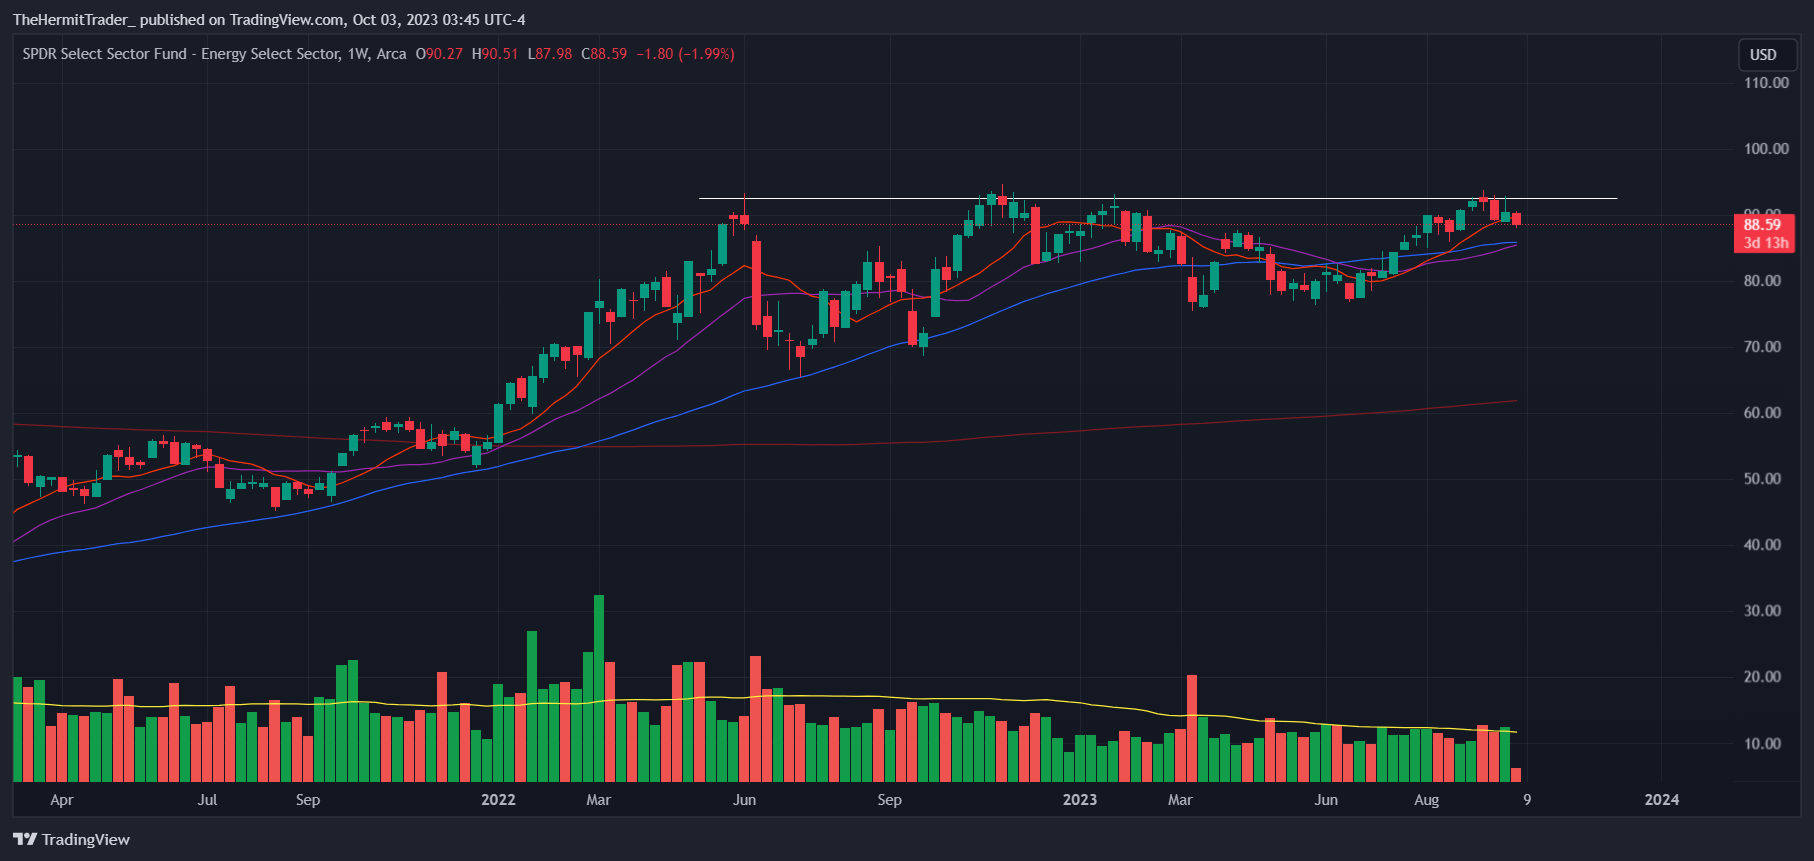
Energy ETF ( XLE ), which has a higher concentration of larger-cap energy names, also met with resistance at the key $93 pivot. So we have XOP and XLE struggling to break out of their big ranges, even though URA succeeded.
Weekly Chart: XLE
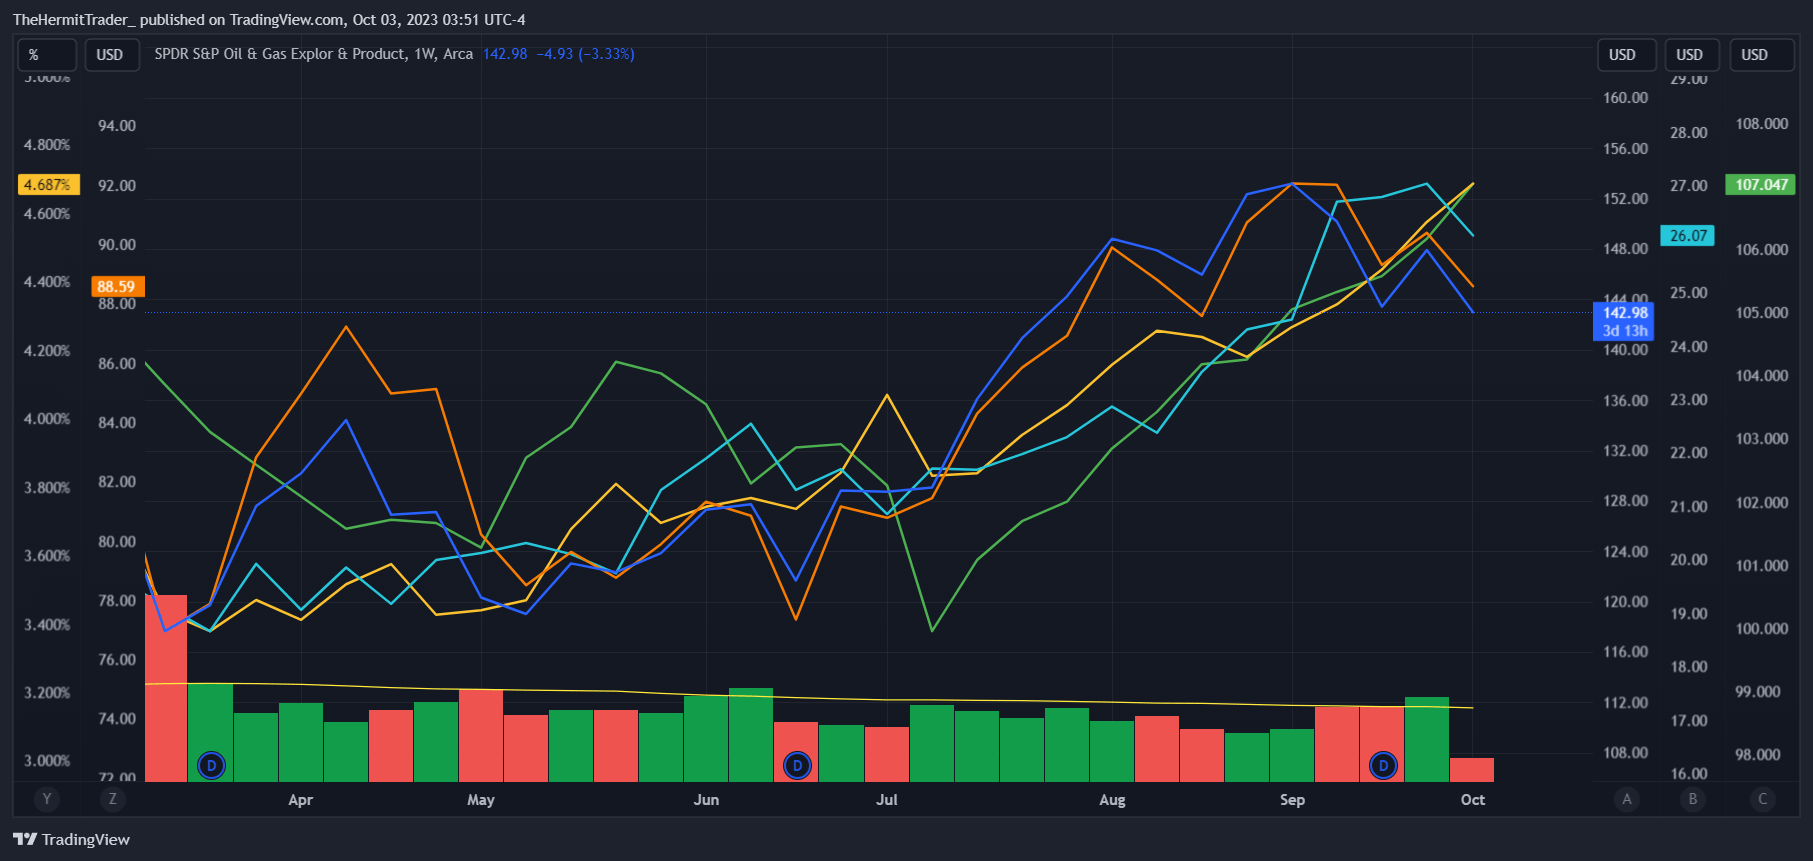
The price action in the energy theme is important because bond yields and the USD broke out at the same time as uranium and oil & gas.
We may observe the positive correlation in prices of XOP, XLE, URA, US10Y yield, and the dollar index ( UUP ) since July.
Weekly Chart: XOP (purple), XLE (orange), URA (teal), US10Y yield (yellow), Dollar Index (green)
At the moment, the pullbacks in energy thematic plays have not (yet) led to pullbacks in bond yields and the USD. In fact, the latter two have pushed higher. The question is "which camp is wrong"?
If bond yields and the USD show weakness, then I think a sector that could benefit would be growth / technology.
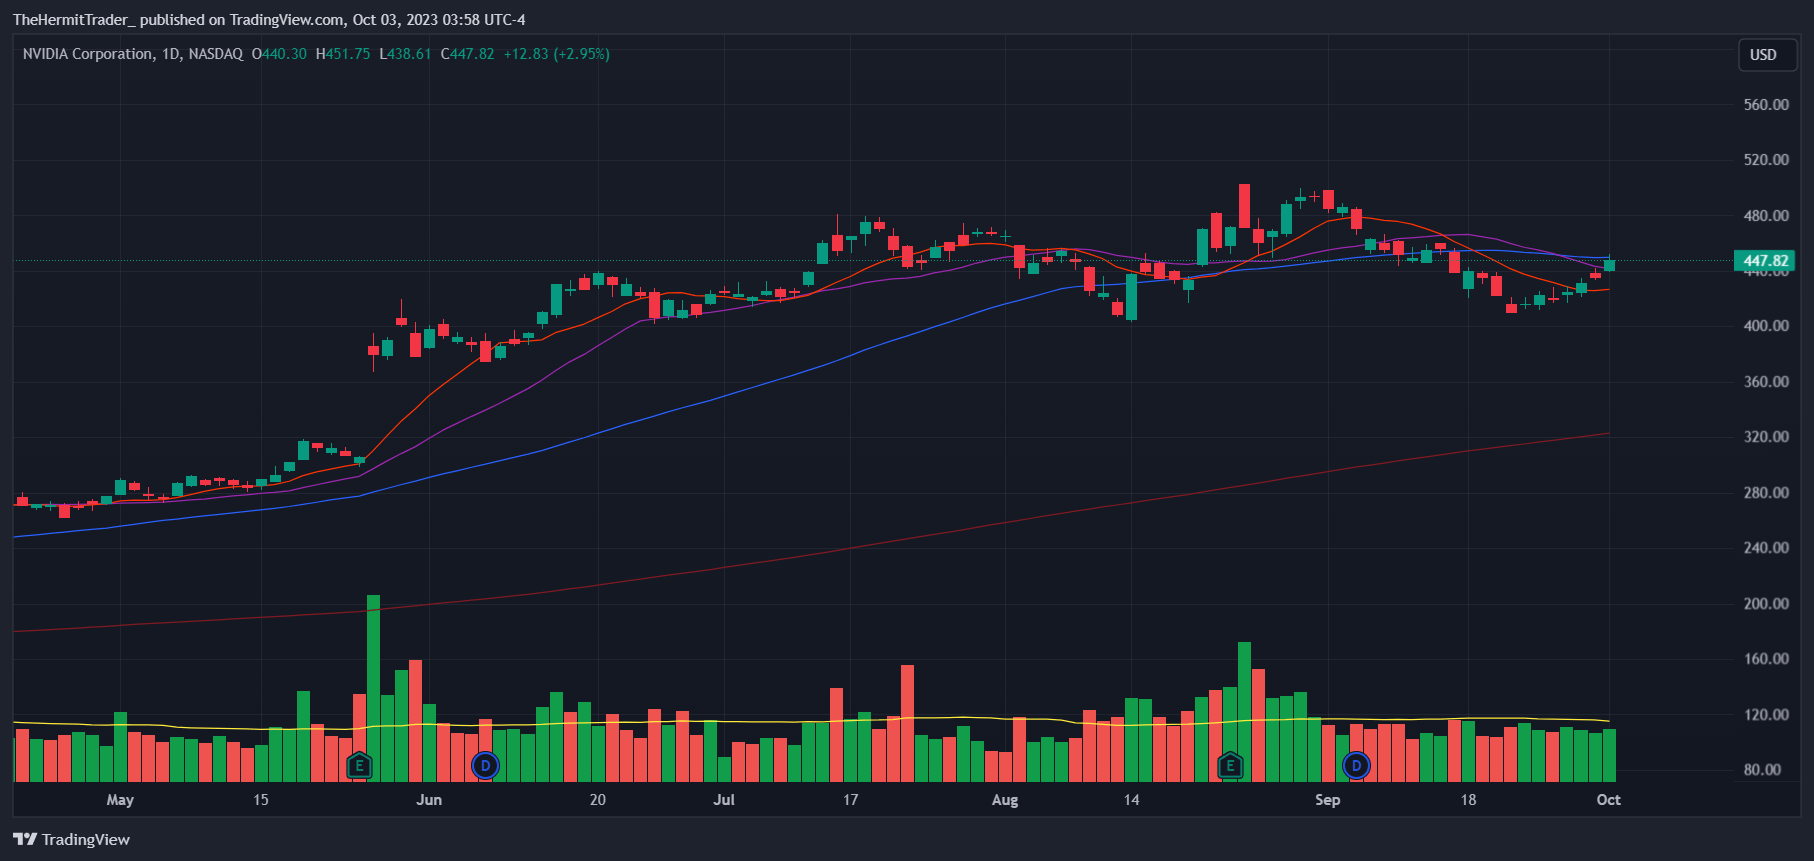
At the moment, some mega-cap technology stocks are holding up well. NVIDIA ( NVDA ) has reclaimed above its key moving averages on the daily chart.
Daily Chart: NVDA
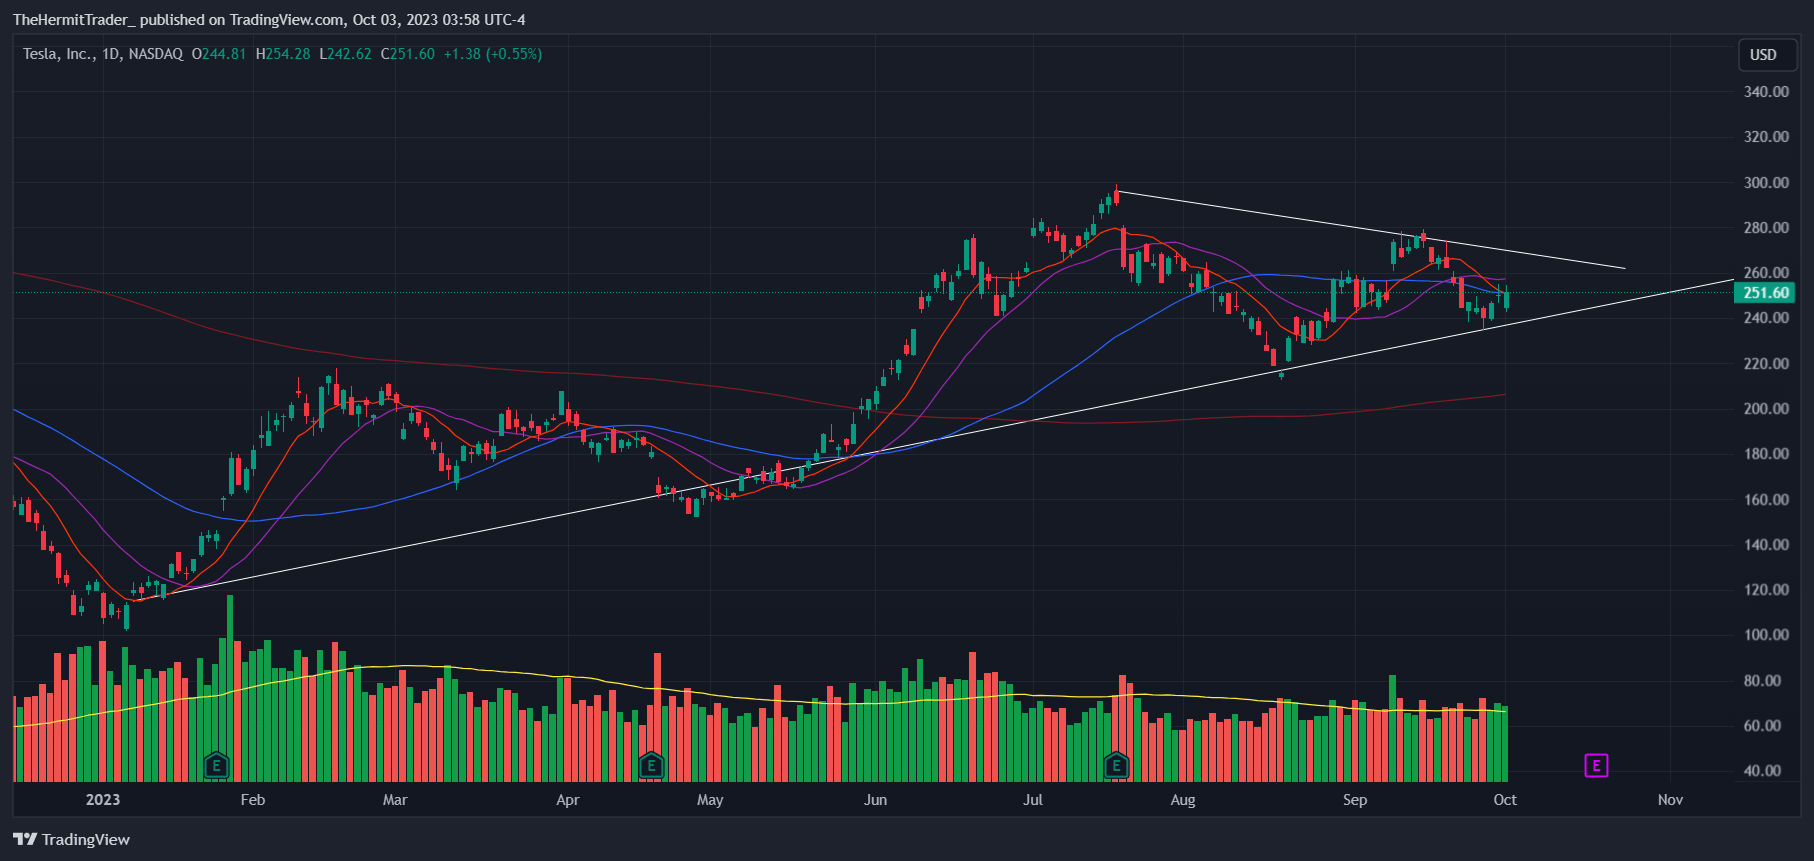
Tesla ( TSLA ) is building out a big triangle pattern and is reaching the apex of the pattern soon, where a big directional move is expected.
Daily Chart: TSLA
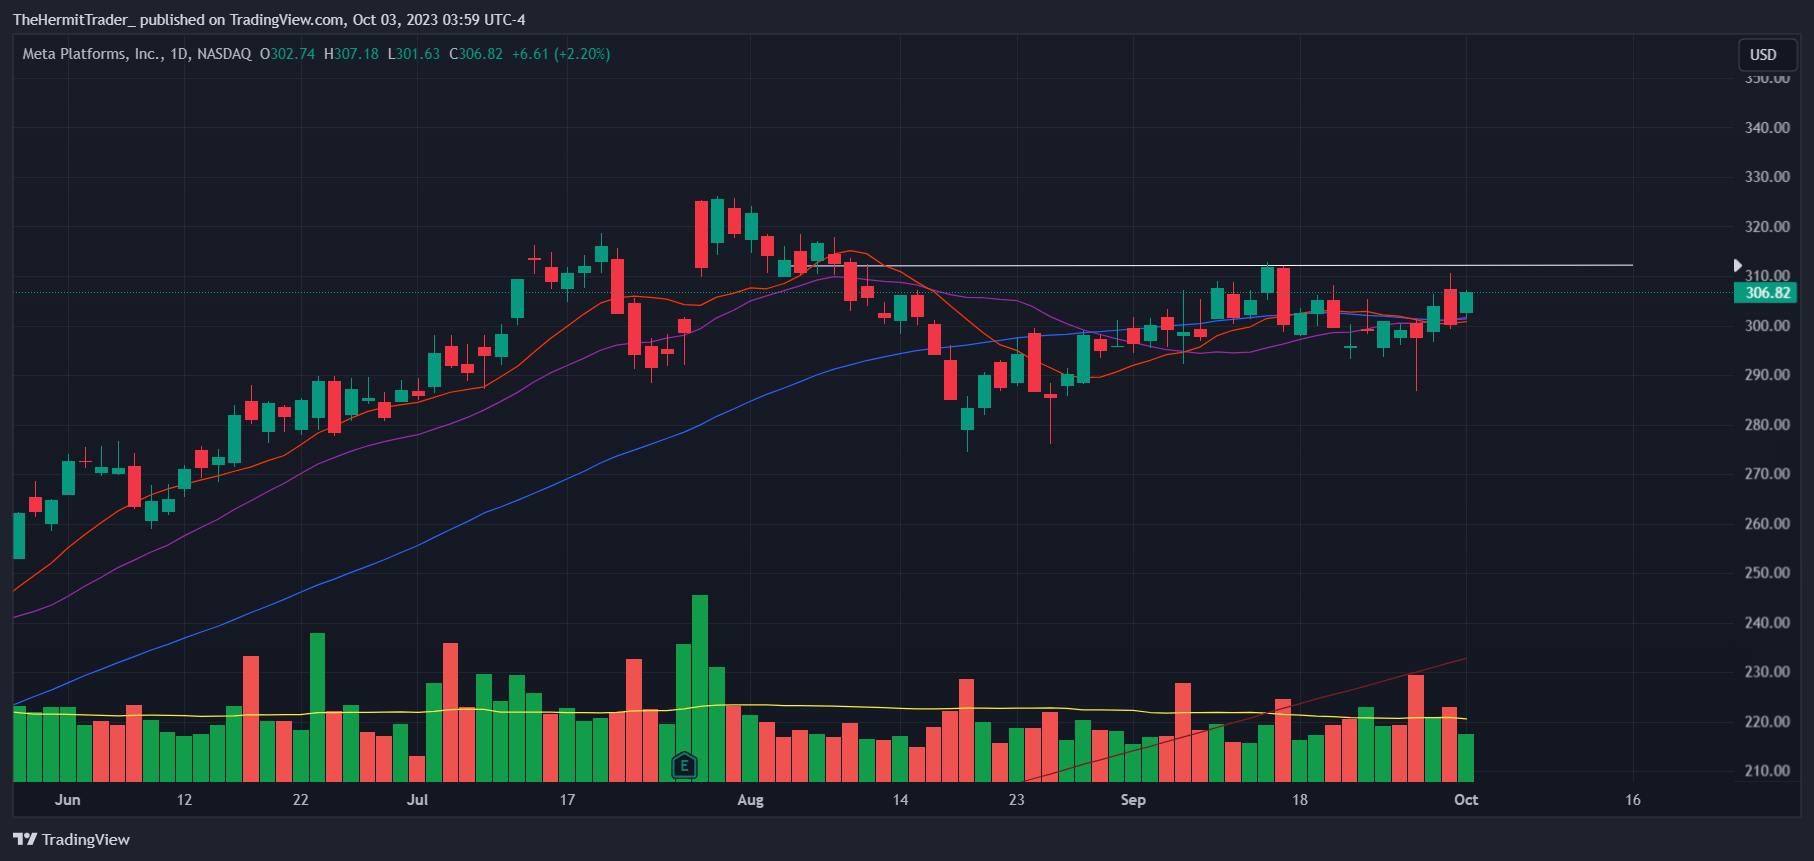
I like Meta Platforms ( META ) the most out of the mega-cap technology space. It is trading above its key moving averages, which have all converged at a single point on the chart. It is building a base, and I am watching if it breaks out.
Daily Chart: META
All in all, mega-cap technology stocks are showing some early signs of strength. They were first to breakout back in May, ahead of majority of smaller-cap technology / software stocks, and now appear to be leading again (especially NVDA, TSLA, META).
A big catalyst for technology to stage a comeback would likely be near-term pullbacks in energy thematic plays, namely uranium and oil & gas. If these pullbacks materialise and we get consolidation / rangebound behaviour in these sectors, then there is a higher probability that bond yields and the USD will soften going forward.
For further details see:
Energy Plays - Uranium, Oil And Gas - Are Near-Term Exhausted; May Lead To Revival In Technology Space (Technical Analysis)