EHAB - Enhabit: 40% Slump In Pre-Tax Earnings Payer Headwinds Remain In Situ Reiterate Hold
2023-08-18 11:40:55 ET
Summary
- Enhabit, Inc.'s shares have declined by 14% since the last publication due to ongoing headwinds in its business economics.
- The company is facing challenges with payer dynamics and a shift towards Medicare Advantage plans in its core markets.
- EHAB's economic features and thin profits produced on large amounts of capital have resulted in a large erosion of intrinsic value.
- Net-net, reiterate hold.
Investment briefing
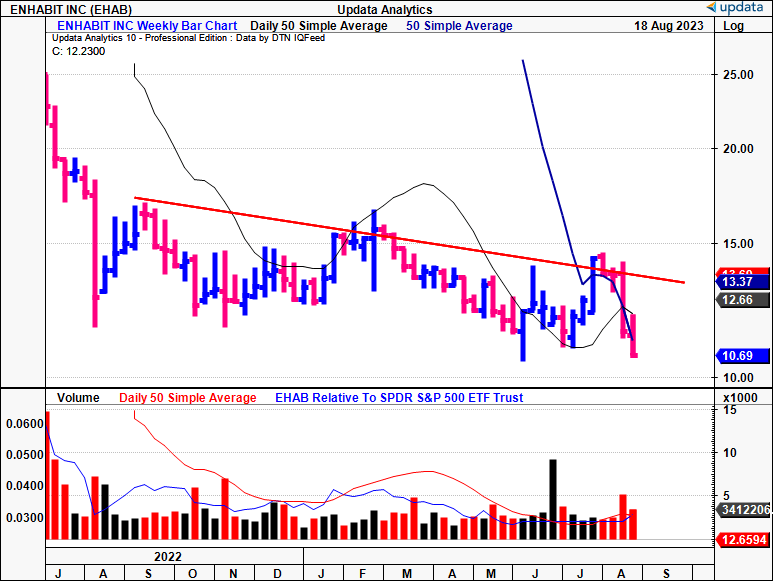
The headwinds to Enhabit, Inc. ( EHAB ) business economics remain firmly in situ after this latest profile of the company From my last publication, shares have drifted a further 14% to the downside.
Figure 1.
In detailing EHAB's recent developments, it's crucial to dissect its payer situation along with the changing dynamics within its underlying markets. These continue to have a material impact on the company's operations.
Moreover—and as a reminder—the value of any asset or investment security is the present value of its future cash flows. The economics of this calculus demands one acknowledges what amount and type of capital/assets are required to produce such cash flows.
As you'll see, EHAB's free cash flows are small and unstable, what it earns of capital employed in the business is tight, and thus, economic earnings are equally as depressed for the company. Collectively, these factors have all attributed a large erosion of intrinsic value—a point the market seems to have picked on with vigour. Net-net, reiterate hold.
Critical facts and challenges EHAB faces
I'll run through the facts pattern underlying the EHAB hold thesis below. This is built through fundamental and valuation grounds.
1. Q2 FY'23 earnings insights
- Continued payer pressures
As acknowledged by management, the firm's numbers are most sensitive to episodic volume. Unfortunately, this is a major headwind to EHAB's growth. The healthcare market has recently shifted towards Medicare Advantage ("MA"), also known as "Part C" plans. These are medical insurance plans offered by private companies. Notably, within EHAB's market landscape, MA enrollees have purportedly surged , whereas fee-for-service enrollees have declined ~4%. A key point to highlight is that EHAB's portfolio historically leaned more towards fee-for-service. But it has been slow on the MA adoption trail:
- For instance, for Q2 and H1 FY'23, EHAB's revenue sourced from MA patients stood at 20.3% and 19.5%, respectively, in contrast to 13.8% and 13.2% at the same points last year
- It's the market dynamics that are driving patients onto MA as well. CMS data from H1 last year projected that ~50% of Medicare eligibles might transition to MA plans by 2030. But the U.S. crossed this milestone in January of this year. Now, the projections say that ~70% of Medicare eligibles could potentially be enrolled in a MA plan by 2030—20 percentage point increase. There's nothing to say these 20 points won't be made up before 2030, either.
As mentioned, EHAB was unceremoniously late to the MA party, meaning many of its competitors have taken share through their sales channels. It has made some headway in negotiations with MA payers. For instance, in Q2, it bought new agreements of 10 new regional contracts online, bringing the total tally to 37 such deals. This resulted in the admission of >3,400 patients under these non-episodic new contracts, a sequential growth of 150%. The firm touts its "payer innovation" efforts, but I'm yet to see these convert heavily throughout the P&L or cash flows.
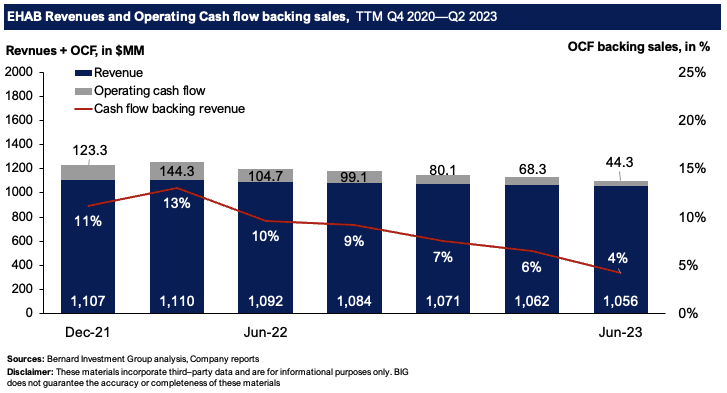
Quite the opposite, actually. Revenue growth remains at a plutonic trend, whilst operating cash flows have dwindled to sickening lows. The degree of OCF backing revenue has also clamped from 11–13% in 2021 to a low of just 4% last period (in the TTM). These are unacceptable economics as part of our core investment tenets.
Figure 2.
Despite the early strides in payer innovation, it's evident this hasn't offset the persistent decline in Medicare episodic fee-for-service volumes. To illustrate, consider these quantifiable aspects:
- EHAB previously stated that a 500bps shift of non-episodic visits to its newly formed national or regional payer innovation agreements could correspond to $2mm in additional adj. EBITDA. That's 500bps = $2mm accretion.
- Contrarily, each 50bp decrease in Medicare fee-for-service volume entails an equivalent negative impact, translating to roughly a $2mm reduction in adj. EBITDA annually. That's 50bps = $2mm. Note the massive asymmetry?
- Looking ahead, EHAB had already outlined a $40mm headwind to growth this year. Of this, $14mm was/is anticipated from the payer mix shift.
- Critically, this projected $14mm has already manifested in H1 FY'23.
Therefore, it anticipates this impact to at least double the initial estimate—i.e., $28mm vs. $14mm previously estimated. It therefore sees ~$100mm in adj. EBITDA this year.
- Financials slipping behind in real terms, but balanced down the P&L
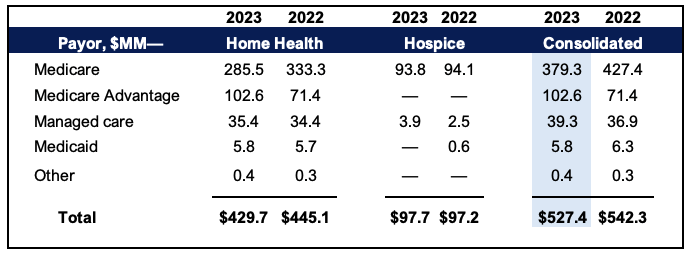
Q2 consolidated turnover came to $262.3mm, down 2.1% YoY, on adj. EBITDA of $23.9mm—a 40.7% drop YoY. Despite these figures, total admissions displayed a 3.2% YoY growth, supported by the expansion in non-episodic entries, which acted as an offset to the reduction in episodic admissions. It's apparent that non-episodic visits in home health care made up ~31% of EHAB's total Home Health visits for Q2, an increase of ~800bps compared to last year.
Figure 3.
Breakdown of the unit economics in Q2 is as follows:
- Cost per visit escalated by 3.4% YoY. A tidy gain, but not necessarily in real terms.
- Though improved clinical productivity and optimization partially offset the impact of factors like contract labour and increased costs, I'd also note that its initial projection of a 4—5% increase in cost per visit has now been revised to a range of 1% to 3% YoY.
It also expects to collect ~$49–$69mm in free cash flow by the end of this year, but this will depend entirely on its cash collections—which are low—and growing working capital needs—which as still reasonably high as a percentage of pre-tax income. It came to ~52% of pre-tax earnings using TTM values to Q2 FY'23
2. Capital profitability lagging required rates of return
Laying bear, the company's economic characteristics and a number of balancing factors are clear.
One, the company produced $47.4mm in post-tax earnings last period using TTM values. Whilst revenue growth has been non-existent, profitability declines have not. In Q4 FY'22, it did $97mm in TTM earnings after tax. Further, looking at all uses of capital, it's clear capital intensity is increasing, along with cash diverted to acquisitions. As such, the cash it has spun off to shareholders after all relevant investment activity is just $8.2mm from $43mm end of last year (TTM figures). I would call these numbers small, and unstable.
Two, and critically, neither capital turnover of profit margins are driving value for the company as I write, with just 4% post-tax margin on ~0.8x capital turnover confirming the points on its pricing and payer disadvantages at the economic level of the business [Figure 5].
Figure 4.
Note: Only capital expenditures above the level of depreciation are taken as "investments". The remainder is considered as maintenance capital. This further shows how its profitability does not meet the capital charge of assets employed into the business. (Sources: BIG Insights, Company filings)
Figure 5.
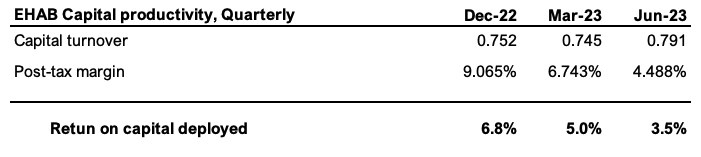
Three, reconciling the capital that's been provided to the business from its owners (shareholders) in debt and equity (with retained earnings and paid-in capital included in equity) it's clear the firm has put ~110% of this to work via its investment activities.
Critically, the bulk of its balance sheet is tied up to accounting goodwill, which, as you can see, hasn't converted to economic goodwill:
- It took $1.34Bn of asset value to produce TTM post-tax earnings of $47.4mm last period. This is off $97mm produced on $1.42Bn end of last year.
- Incremental profits earned on the firm's capital base have dwindled drastically over this time, averaging the high double-digits each period. This has corresponded to paper thin returns on capital deployed and at risk in the business, from 6.6% to 3.5%. Neither beat the required rate of return of ~12% for those holding corporate equity securities (at long-term market averages).
- The economic losses thus produced have blown out to $113mm in the last TTM. Excluding the goodwill charge, you're looking at a far more favourable setup—but we can't exclude it in my view, given that it represents the enormous premiums paid for acquisitions.
These pointers have coincided with a 51% drop in intrinsic value from December last year to the time I write. The market has recognized this and punished EHAB's market value with similar levels of downside in its rating. By all measures, this very well may continue into the medium term future.
Figure 6.
Sources: BIG Insights, Company filings
Valuation and conclusion
The stock sells at 11x forward EBITDA and 8.5x forward cash flows, securing you an 11% cash flow yield as I write. The risk is the trend in the firm's OCF's snipping this forward yield drastically. I'm not convinced it's worth it, either. This is a 50% discount to the sector, and a 13% discount at 18x EBITDA. Plus, just look the value the market places on its net assets—just $0.85 on the dollar. This aligns with the findings above—that EHAB's capital deployed into the business is not valuable, and lacks forward earnings power.
You've also got to accept the fact, EHAB has more debt than its entire current market capitalization ($12.20/share in debt vs. $11.63/share market value as I write). At 11x forward, on management's estimates of $100mm adj. EBITDA, you get to $1.1Bn in enterprise value, below the current EV of ~$1.2Bn. This supports a neutral rating in my view. Findings are also supported objectively by the quant system , as seen below.
Figure 7.
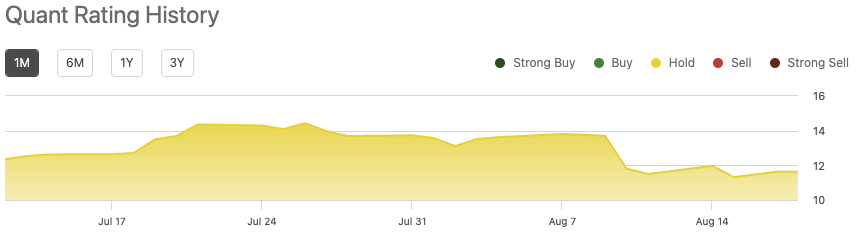
Net-net, there is ample evidence from my findings to suggest EHAB remains a hold right now. Depressed sales and earnings growth is compounded by thinning cash conversion and less productive capital tied up in the business. These economic headwinds aren't offset by the fact it still trades at reasonably unattractive multiples of net asset value. Further, the payer headwinds are not yet resolved, and there's risk EHAB will lag peers in this domain into the future. As a result, a hold rating is retained.
For further details see:
Enhabit: 40% Slump In Pre-Tax Earnings, Payer Headwinds Remain In Situ, Reiterate Hold