EHAB - Enhabit: Difficult Time Ahead According To Market Generated Data (Technical Analysis)
Summary
- Enhabit has caught a bid coming into the new year, rolling out of a difficult period since listing in FY22'.
- Despite this, the weak price action to date looks justified, and we see a difficult period for the EHAB share price looking ahead.
- Market generated data implies the same, with technically derived price targets to $15, then $16.
- Net-net, we rate EHAB a hold.
Investment Summary
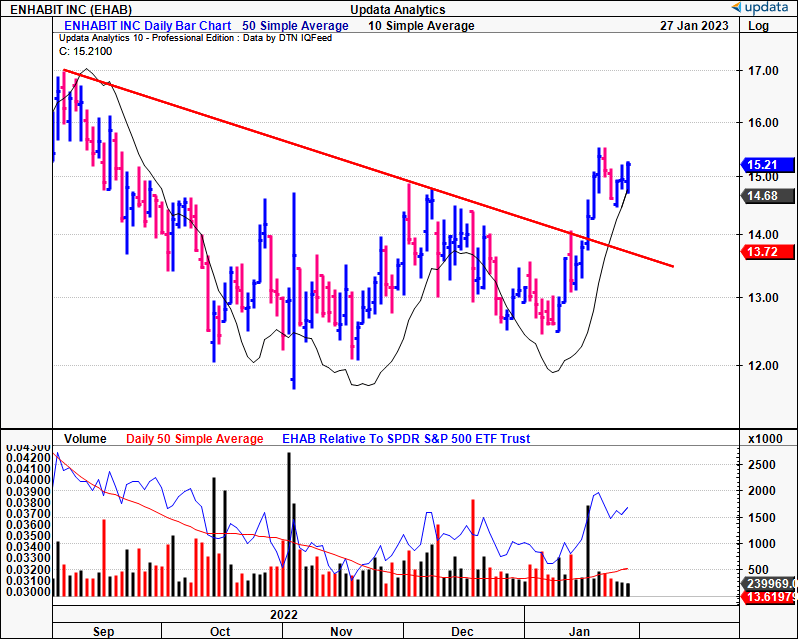
Since its carve out from Encompass Health ( EHC ) and listing in June of FY22', Enhabit, Inc. ( EHAB ) there's been weak demand and heavy supply of the newly listed shares, leading to a less than impressive debut on the chart in its first year as a standalone company. However, the stock has caught a strong bid into the new year, thrusting off a double bottom from $12.44 and breaking to new highs in the process [Exhibit 1].
Exhibit 1. EHAB 6-month price evolution [weekly bars, log scale].
With this in mind, we wanted to examine the market generated data to observe how investors are positioning in the stock, to gauge if the snap-back rally has the legs to extend further to the upside. Net-net, we rate EHAB a hold, eyeing a price range in the $15–$16 range.
Fair view of fundamentals
EHAB shares were sold off en masse shortly after the spinoff last year and have yet to recover. Whilst not uncommon for newly listed and/or corporate carve-outs, if the strength in business model was there, the market would respond. Whilst not perfectly efficient, the market is still fairly efficient in rewarding companies that create value. Moreover, with fundamentals becoming relevant once again, there has to be some underlying explanations for the loss on equity returns.
We've been privileged to annual data back a few years for EHAB to perform a deeper analysis than the publicly available data. You'll see in Exhibit 2 that EHAB's had a difficult time in growing profitability since FY20'. First, it's seen a decline in additional NOPAT growth, despite generating $311mm in cumulative NOPAT over this time to the trailing 12 months. Meanwhile, it's generated a cumulative $270mm in earnings over the 3-years to date, managing to add an additional growth of $54mm on this.
However, the $54mm in additional earnings growth required $511mm in additional investment, a 10.7% return on incremental invested capital. Hence, despite a 20% growth rate over this time, it was required to reinvest 189% of its earnings, to generate just ~11%, demonstrating a lack of value-add for equity holders. What it tells us is that EHAB is a capital intensive business, that requires substantial reinvestment of earnings to exhibit growth.
Exhibit 2. EHAB, returns on capital have been sub-par, despite a 20% growth rate in earnings
Data: Author, using data from EHAB SEC Filings
It trades at 0.7x trailing earnings, and we believe this is more than justified given the amount of capital that EHAB needs to reinvest in order to generate growth. Moreover, keep in mind, that, growth is only accretive to corporate/equity value if the return on invested capital surpasses the cost of capital. EHAB's current hurdle rate is 8.5%, and its trailing ROIC is 4.8%. Hence why the company has to invest nearly 200% of its earnings to grow in the first place, consequently justifying the low P/E multiple in the process.
EHAB advanced technical analysis
If you believe that EHAB bottomed in October last year, then tracing the fibs down from the September high sees the stock trading at a ~62% recovery of the downside move. It tested the 78.5% bar on the fibonacci channel, yet was rejected there and has found support at ~$14-$15. Should it continue to break higher, the next target is $15.60, then ~$17. If it pushes lower, we'd be looking at targets of $14, then $13.45.
Exhibit 3. Testing key marks along the fibonacci channel, with upside targets to $17, downsides to $13.
In terms of the trend, it's still bullish above the cloud, but price action is fairly weak despite the snap-back rally over this month. We've got the lagging line and price line above the cloud, with support found at the $13-$14 zones. To us, this suggests we can expect further congestion sideways into February at least, with the cloud pushing sideways as well. Meanwhile, on-balance volume has diverged from the price line and to the downside, illustrating that longer-term buyers have continued to exit positions.
Exhibit 4. Bullish above the cloud, but congestion sideways looks to be the prevailing trend down the line based on cloud position and width
Data: Updata
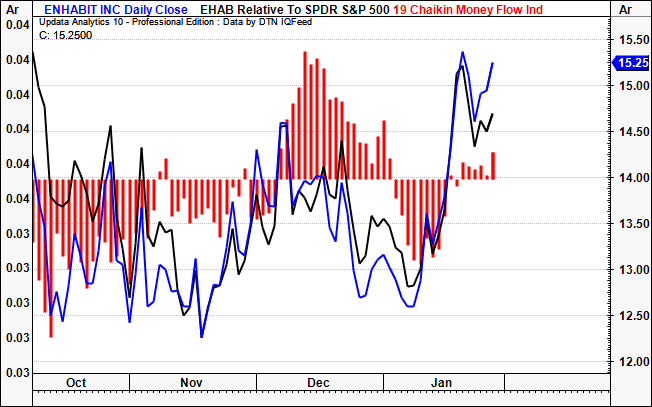
This is supported by the fact that money flows into EHAB equity has been week throughout the extent of the latest rally. Despite the price spike shown, inflows have yet to follow, and investors are still net sellers in January. Hence, supply is still strong, and it looks as if there's a lack of buyers to absorb the supply levels.
Exhibit 5. Money flows into EHAB equity have been weak, buyers unable to absorb heavy supply
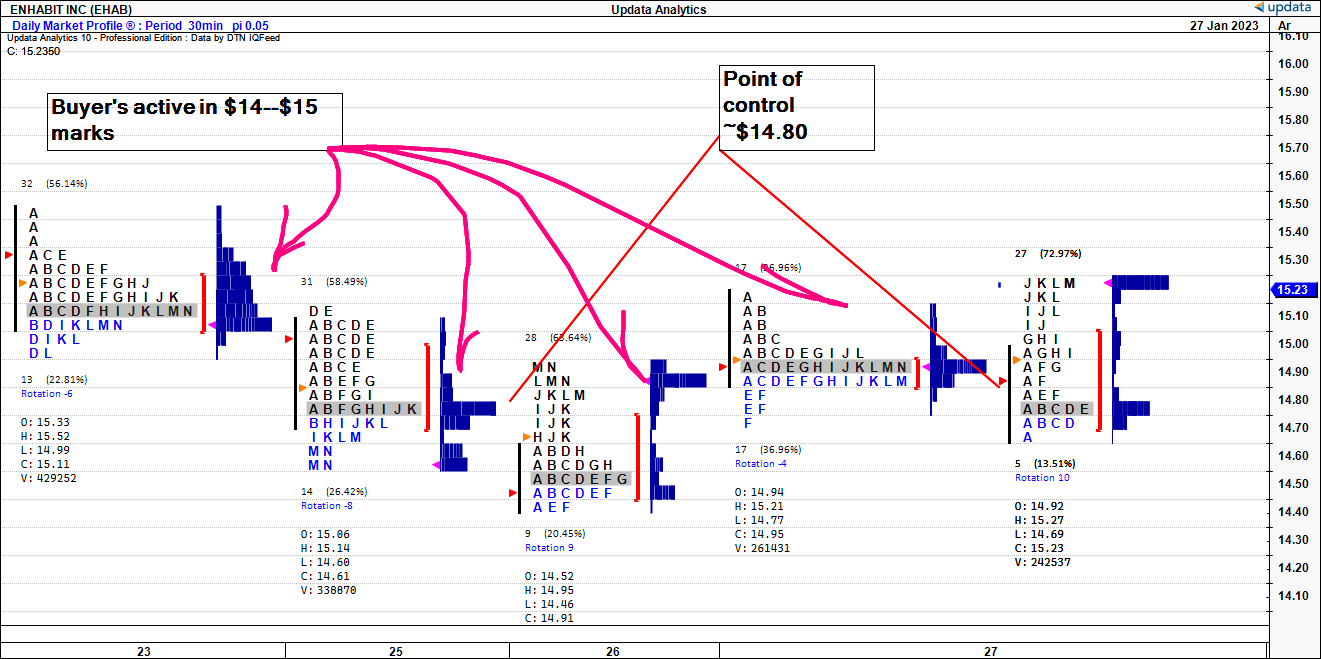
Looking at the market profile across the last two weeks, we can make some inferences on price equilibrium and the market's near-term estimate of fair value. You'll see in Exhibit 6 that investors have been trading EHAB in tight range with most of the trading activity occurring within the $14–$15 range. Buyers have been fairly quiet below the points of control shown [grey bars], and the time price opportunity has been asymmetrically skewed above the point of control on each time frame.
This tells us that, with each attempted break above the $14–$15 zones, each attempted move has been met with heavy resistance, with investors again adding to supply as sellers. On this picture, we're not confident the market has scope to re-rate the EHAB share price further to the upside. This is supported by the EHAB options chain , looking at contracts expiring in February. All of the open interest is concentrated in the $15 mark of the price ladder. Hence, $15 looks to be a key region of equilibrium by estimation.
Exhibit 6. Each attempt above $14–$15 met with resistance and further supply, with majority of trading activity below $15
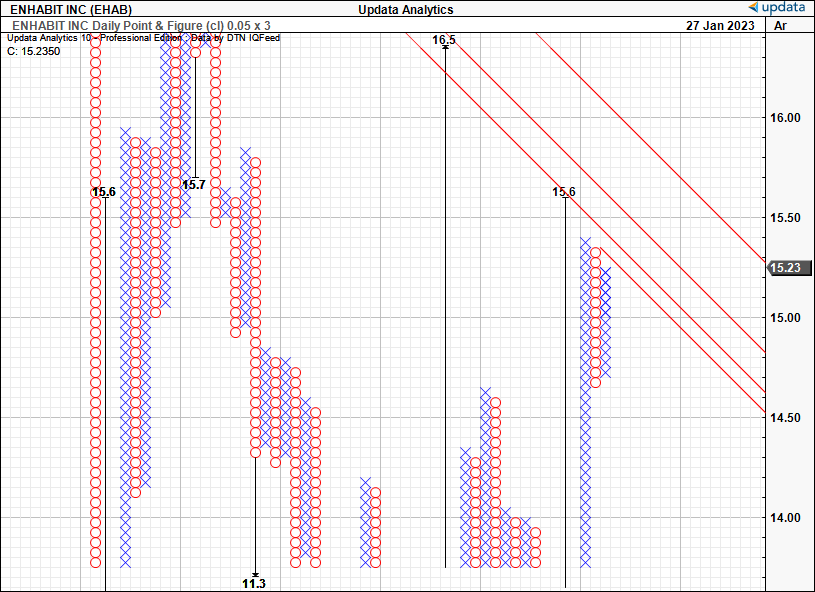
As such, we have price targets to $15.60, then $16.50, in support of the fibonacci levels identified earlier. Moreover, it corroborates the main trading ranges EHAB has kept within over the last few weeks to date. With these points in mind, along with the fundamentals discussed earlier, this has us neutral on EHAB.
Exhibit 7. Upsides to $15.60, $16.50, in line with fibonacci and market profile generated data
In short
A combination of weak ability to generate future growth without harming value and equally as weak technical data, we believe that EHAB will have a difficult time extending its January rally further. In particular, the market looks to have corroborated a suggested price range of ~$15-$16, leaving little scope for a re-rating to the upside. The stock trades at 0.7x trailing earnings, itself justified in our opinion, and not a value proposition. Rate hold.
For further details see:
Enhabit: Difficult Time Ahead According To Market Generated Data (Technical Analysis)