EBF - Ennis And Its Real Value
2023-09-29 03:41:17 ET
Summary
- Ennis, Inc. faces challenges due to the increasing digital transmission of documents, declining demand, and price wars in the industry.
- The company's acquisition strategy and economies of scale have helped diversify its revenue stream and decrease costs.
- While Ennis, Inc. has shown resilience in its acquisitions, its fundamentals, such as ROE and gross margins, fall short of expectations, and the company may need to pivot towards digital technology.
- This article focuses on the fundamentals, the real value versus the current share price, and if Ennis, Inc. is currently worth investing in.
The continued transformation into digital transmission of documents over physical print is a difficult challenge for the business model of Ennis, Inc. (EBF). These risks have been increasing since the pandemic drove companies to a digital work environment. Even with companies beginning to transition to a hybrid work schedule, digital transmission of business documents and forms continues to rise. Declining demand and technological advancements lead to increased competition in the industry. Price wars directly result from these phenomena, impacting the margins of Ennis. Ennis Inc. has adopted an acquisition and economies of scale strategy to combat the continuing challenges facing its top product offerings.
Ennis Inc.'s large cash reserves and acquisition strategy can diversify its revenue stream. Its recent acquisitions have had a positive impact on its net sales and allowed a decrease in costs due to economies of scale. Investment into capital assets and consolidation remains an effective strategy to improve the costs of its manufacturing facilities. Whether these strategies can continue to insulate Ennis Inc. from a declining main product and increasing macroeconomic challenges is the key question in the future.
When considering these current stories about Ennis Inc., we need to determine which news topics will have a long-term and ongoing effect on the company and its share price. The current situation for Ennis Inc. highlights red flags for the company in its current form. Short-term headwinds show customers of Ennis transitioning away from physical printed documents impact Ennis Inc.'s business model. Long-term, Ennis Inc. has shown some resilience in its acquisitions and cost-cutting strategy to maintain relevance in a declining industry. While its acquisitions have been successful in terms of its net sales, the earnings were declining before a recent resurgence in 2023. It remains to be seen if the trend continues for improved earnings or a return to a declining trend will be seen in the next few years. Ennis is really at a crossroads of continuing to create barriers to entry for competition to become one of the few leading players in the print business or to transition its product offerings to encompass new trends in digital transmission to grow. One option limits the growth potential with less risk, while the other option has high growth accompanied by risk.
While current news stories, good or bad can sway our opinion about investing in a company, it's good to analyze the fundamentals of the company and to see where it's been in the past and in which direction it's heading.
This article will focus on the long-term fundamentals of the company, which tend to give us a better picture of the company as a viable investment. I also analyze the value of the company versus the price and help you to determine if Ennis Inc. is currently trading at a bargain price. I provide various situations which help estimate the company's future returns. In closing, I will tell you my personal opinion about whether I'm interested in taking a position in this company and why.
Snapshot of the Company
A fast way for me to get an overall understanding of the condition of the business is to use the BTMA Stock Analyzer's company rating score. Overall, Ennis Inc. shows a score of 70.9 out of 100, just squeaking past a good score of 70 plus. These fundamentals suggest that there should be some hesitation with this company.
Before jumping to conclusions, we'll have to look closer into individual categories to see what's going on.
Fundamentals
Looking at the historical price per share in the chart below, a consistent rise has been seen aside from the major COVID-19-year decline. This increase has been surprising to me as overall net earnings have not risen dramatically over an eight-year period. The strong margin combined with the small growth year over year has driven share price increases. The stability of the industry overall has maintained strong gains for investors. Overall, the share price average has grown by about 127.18% over the past 10 years, or a Compound Annual Growth Rate of 8.55%. This return is neutral to me since it's similar to the long-term S&P 500 benchmark return.
(Source: BTMA Stock Analyzer - Price Per Share History)
Earnings
Earnings show an inconsistent past but a growing future. Since 2018 earnings have grown for Ennis, with some fluctuations during the down years of 2019 and 2020. A resurgence of net earnings from acquisitions and facility consolidation has shown in the 2023 EPS rise. This consolidation should continue to reduce costs through improved manufacturing facility efficiency. The recent guidance has also highlighted expected net sales increases to be even greater in the next quarters from Ennis's acquisitions. Due to this information, another uptick in short term EPS would not be surprising based on the current trend.
BTMA Stock Analyzer
(Source: BTMA Stock Analyzer - EPS History)
Since earnings and price per share don't always give the whole picture, it's good to look at other factors like the gross margins, return on equity, and return on invested capital.
Return on Equity
The return on equity follows the earnings per share with the recent year of 2023 showing its highest return in the last 5 years. The average ROE does not meet the threshold. For return on equity (ROE), I look for a 5-year average of 16% or more. So, Ennis Inc. does not meet my requirements.
BTMA Stock Analyzer
(Source: BTMA Stock Analyzer - ROE History)
Let's compare the ROE of this company to its industry . The average ROE of 20 Publishing and Newspaper companies is 5.15%.
Therefore, Ennis Inc.'s 5-year average of 11.86% is well above the publishing and newspaper industry average of 5.15%. On a side note, I believe the inclusion of Ennis in publishing and newspapers is not a good comparison. Office equipment and services are a better comparison with an ROE of 7.96% on average. This would show that Ennis Inc. is still above the average of its peers.
Return on Invested Capital
The return on invested capital has followed both ROE and EPS. ROIC saw a dip during the Covid pandemic and afterwards a rise due to the improved net earnings in 2023 compared to previous years. Capital expenditures have not substantially changed over the past 3 years, with the only outlier being the year 2022. This most likely is due to the equipment needed to maintain Ennis Inc.'s production line. Ennis has maintained a capital expenditures policy of replacement and maintenance to keep costs low. It seems this strategy is working as the capital expenditures returned to normal levels in 2023 and net earnings saw an increase. If this trend continues, it will show that Ennis can continue to generate increasing returns without changing its investment costs. For return on invested capital ((ROIC)), I also look for a 5-year average of 16% or more. So, Ennis falls short in this category as well.
BTMA Stock Analyzer
(Source: BTMA Stock Analyzer - Return on Invested Capital History)
Gross Margin Percent
The gross margin percent ((GMP)) over the past 5 years has stayed within one to two percent with the most recent year showing an increase back to previous highs. The increase comes from the consolidation of Ennis's manufacturing facilities and continued efforts for cost reduction from economies of scale. I typically look for companies with gross margin percent consistently above 30%. So, Ennis has missed the mark, even though it is very close to the 30 percent threshold.
BTMA Stock Analyzer
(Source: BTMA Stock Analyzer - Gross Margin Percent History)
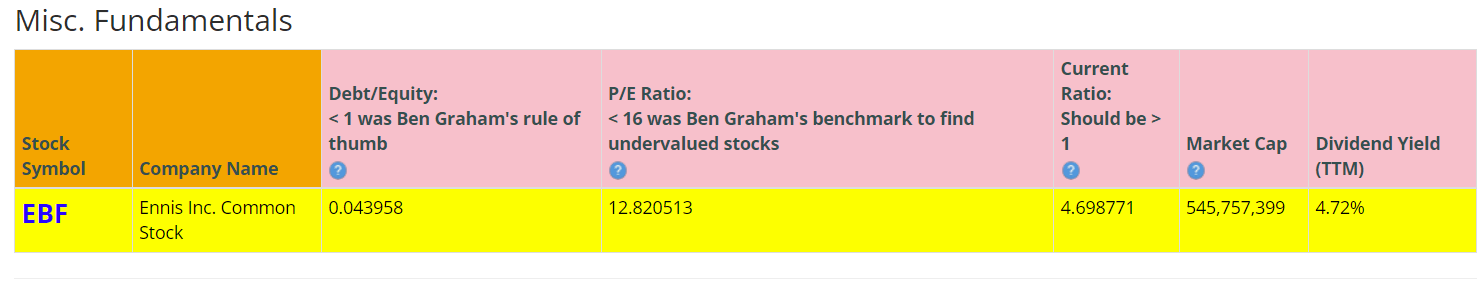
Looking at other fundamentals involving the balance sheet, we can see that the debt-to-equity is less than 1. This is a positive indicator, telling us that the company owns more than it owes.
Ennis Inc.'s Current Ratio of 4.69 is excellent. Ennis Inc. does not currently have a lot of liabilities on its balance sheet.
Ideally, we'd want to see a Current Ratio of more than 1, so Ennis Inc. easily exceeds this amount.
According to the balance sheet, the company is in great financial health. It runs high cash reserves with low liabilities. If anything, the company could utilize some leverage to improve its acquisition strategy and grow the company. The company seems focused on growing with current cash reserves and not taking on any additional debt. I am worried that the risk aversion and slow implementation of its acquisition strategy could hurt the company in the long term due to the challenges it faces. Without an aggressive strategy, I worry about Ennis Inc.'s viability in the future.
Ennis Inc. pays a solid dividend and has done so since 1995.
(Source: BTMA Stock Analyzer - Misc. Fundamentals)
This analysis wouldn't be complete without considering the value of the company vs. share price.
Value Vs. Price
The company's Price-Earnings Ratio of 12.8 indicates that Ennis Inc. might be undervalued when comparing Ennis's PE Ratio to a long-term market average PE Ratio of 15.
The 10-year and 5-year average PE Ratio of EBF has typically been 15.9 and 15.1, respectively. This indicates that EBF could currently be trading at a low price when compared to its average historical PE Ratio range.
(Source: BTMA Stock Analyzer - Stock Value)
The Estimated Value of the Stock is $23.04, versus the current stock price of $21.1. This indicates that Ennis Inc. is currently selling slightly below value.
For more detailed valuation purposes, I will be using a diluted EPS of 1.82. I've used various past averages of growth rates and PE Ratios to calculate different scenarios of valuation ranges from low to average values. The valuations compare growth rates of EPS, Book Value, and Total Equity.
In the table below, you can see the different scenarios, and in the chart, you will see vertical valuation lines that correspond to the table valuation ranges. The dots on the lines represent the current stock price. If the dot is towards the bottom of the valuation range, this would indicate that the stock is undervalued. If the dot is near the top of the valuation line, this would show an overvalued stock.
BTMA Wealth Builders Club
BTMA Wealth Builders Club
According to this valuation analysis, EBF is undervalued.
This analysis shows an average valuation of around $25 per share versus its current price of about $22, this would indicate that Ennis is slightly undervalued.
Summarizing the Fundamentals
Ennis Inc. positions itself well compared to its competitors in its industry. Return on Equity is higher than its peers, but still fails to meet my requirements. In addition, EPS, ROIC and Gross Margins are below my acceptable levels.
Ennis Inc. has shown resilience and market confidence over the last few years. I am skeptical of the fundamentals showing anything more than a company with poor growth potential looking to sustain. Even with the acquisition strategies Ennis Inc. is employing, they still do not seem to be focusing on finding new growth opportunities for an industry that looks to be trending down. Even with the recent resurgence of net earnings in 2023, I worry this could be an outlier. As stated before, fundamentals don't meet many guidelines we look at to determine a potential winner for investors. Overall, the company's fundamentals have been improving due to a resurgence in net earnings in 2023, whether this is a trend, or an outlier makes me uneasy about the future for Ennis.
In terms of valuation, my analysis shows that the stock is slightly undervalued.
Ennis, Inc. Vs. The S&P 500
Now, let's see how Ennis Inc. compares versus the US stock market benchmark S&P 500 over the past 10 years. From the chart below, we can see that Ennis Inc. has underperformed the general market. Ennis somewhat correlates with the market, but with lower returns.
Forward-Looking Conclusion
"Over the next five years, the analysts that follow this company are expecting it to grow earnings at an average annual rate of 5%.
In addition, the average one-year price target for this stock is $27, which is about a 28% increase in a year.
The Expected Annual Compounding Rate of Return is 5.25%.
Does Ennis, Inc. Pass My Checklist?
- Company Rating 70+ out of 100? YES (70.95)
- Share Price Compound Annual Growth Rate > 12%? No (8.55%)
- Earnings history mostly increasing? No
- ROE (5-year average 16% or greater)? No (11.86%)
- ROIC (5-year average 16% or greater)? No (11.1%)
- Gross Margin % (5-year average > 30%)? No (29.6%)
- Debt-to-Equity (less than 1)? YES
- Current Ratio (greater than 1)? YES
- Outperformed S&P 500 during most of the past 10 years? No
- Do I think this company will continue to successfully sell their same main product/service for the next 10 years? No. I feel that the company will need to pivot and move away from print and more towards digital technology.
Ennis Inc. scored 3/10 or 30%. Therefore, there should be a major concern about investing in this stock.
Is Ennis, Inc. currently selling at a bargain price?
- Price Earnings less than 16? Yes (12.8)
- Estimated Value greater than the Current Stock Price? YES (Value $23 > $22 Stock Price)
Valuation metrics suggest that Ennis is likely selling at a slight bargain price as indicated by the Estimated Value, the Price Earnings ratio, and my detailed valuation analysis.
I am not a big fan of Ennis Inc. at its current value. The company is in a declining industry and has not made sufficient efforts for growth outside of its current product offerings in my opinion. Most of its strategy seems to be focused on increasing the horizon of its current main product portfolio. Large cash reserves and no current major debt tell me the company currently does not know what to do to improve its position in the future. The fundamentals do not meet my thresholds for companies that have high potential returns for investors in the future.
Despite my concerns, the company does seem to be setting itself up as the leader within the industry. Creating barriers to entry and a cost leader should make it difficult for competitors to undercut their prices. The company continues to see earnings increases compared to before the pandemic levels, although they tend to be minor gains. The company also continues to support dividends, giving money back to its investors.
Overall, the fundamentals don't match with my preferred baselines and the company seems to not have a clear strategy to solve its current headwinds. Due to these reasons, I will not look to add Ennis to my portfolio at this time.
For further details see:
Ennis And Its Real Value