EQNR - Equinor ASA: A Weak Quarter As Gas Prices Are Falling
2023-08-01 07:50:44 ET
Summary
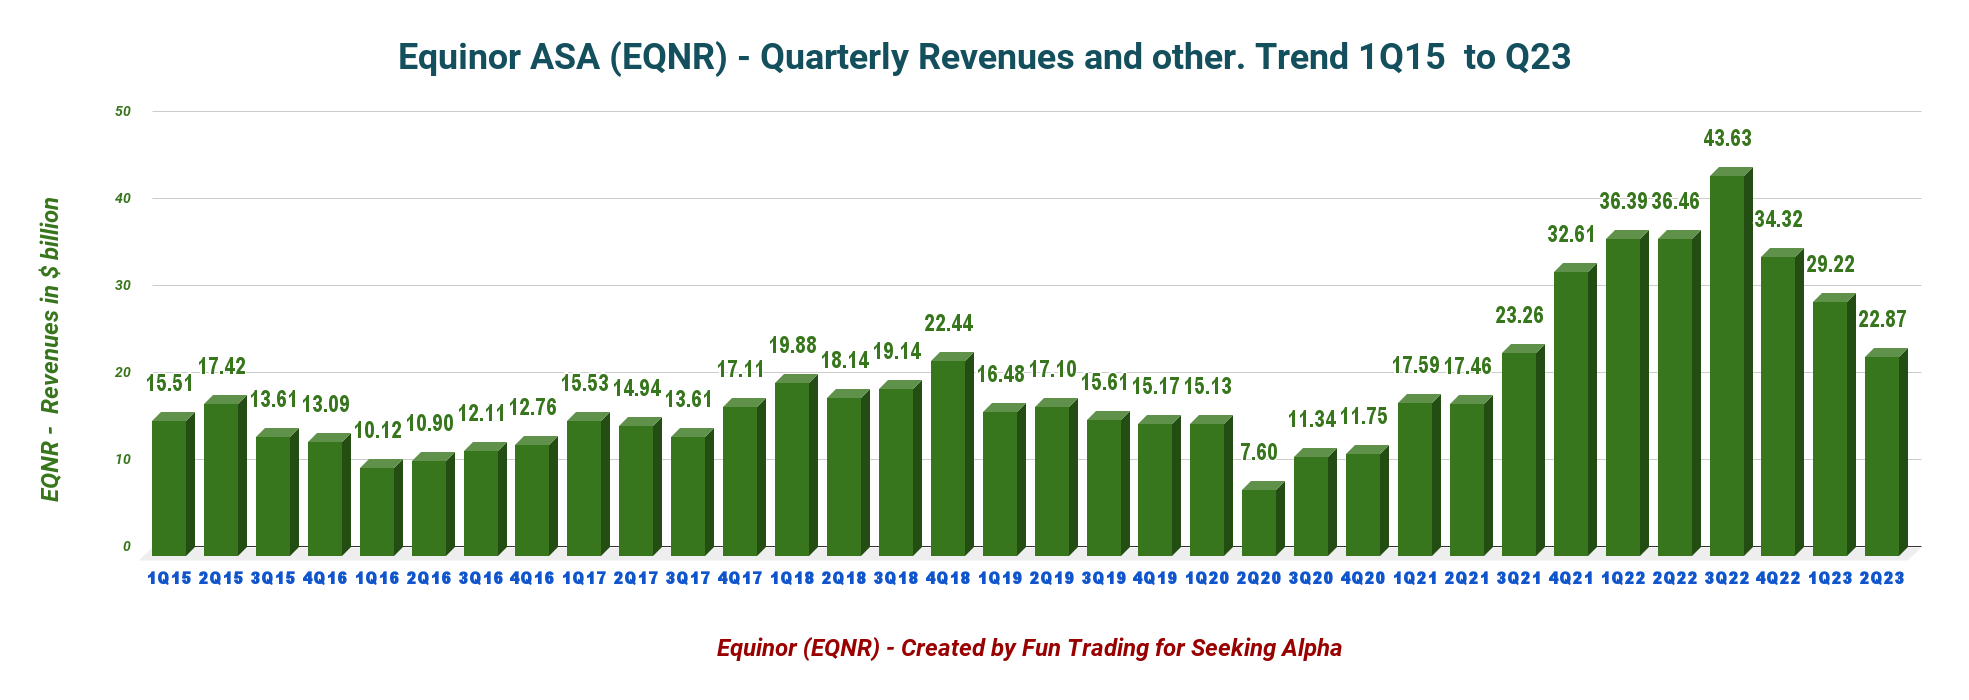
- Equinor's revenues were $22.87 billion in 2Q23, down from $36.39 billion in the same quarter a year ago and down 21.7% sequentially.
- The second quarter production was 1,994K Boep/d, up from 1,984K Boep/d in the same period in 2022 and down 6.4% sequentially. Gas production was 902K Boep/d in 2Q23.
- I recommend buying EQNR between $29.7 and $28.9 with possible lower support at $28.5.
Introduction
The Norwegian-based Equinor ASA ( EQNR ) reported its second quarter 2023 results on July 26, 2023.
Note: This article updates my article published on June 10, 2023. I have followed EQNR on Seeking Alpha since January 2017.
This article discusses the company's recent history, including the second-quarter earnings.
As I said in my prior article, Equinor had an outstanding year in 2022 but now faces lower commodities prices retreating significantly from their highs, especially natural gas prices and NGL, representing a significant segment of Equinor's revenue. The trend accelerated this quarter with a loss in free cash flow.
CFO Torgrim Reitan said in the conference call:
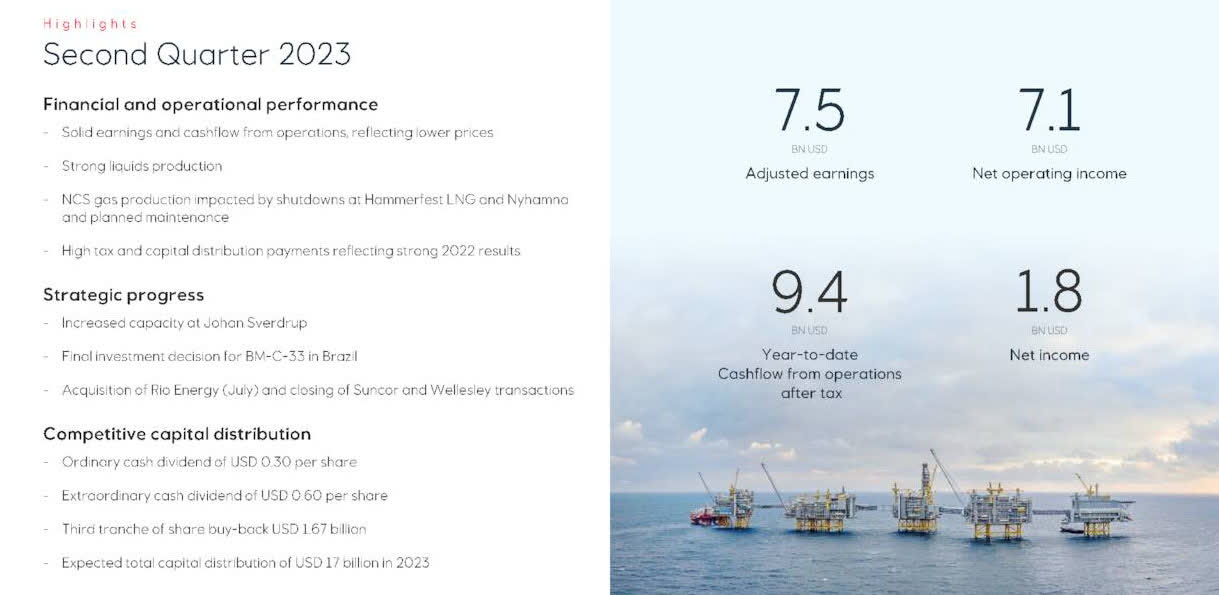
We are delivering solid earnings this quarter with adjusted earnings totaling $7.5 billion and $2.2 billion after tax. The main explanation for the drop in the results is of course, the energy prices are significantly down from the extraordinary levels we saw last year. But compared to prior years, these are still solid results. Particularly, European gas prices are lower. And after a record warm winter, current storage levels in Europe are more than 80% full.
1 - 2Q23 Results Snapshot and Commentary
Equinor reported disappointing second-quarter results. Equinor generated a loss of $985 million in generic free cash flow this quarter, and revenues were $22.872 billion , down from $36.46 Billion in 2Q22 revenues.
EQNR 2Q23 Highlights (EQNR Presentation)
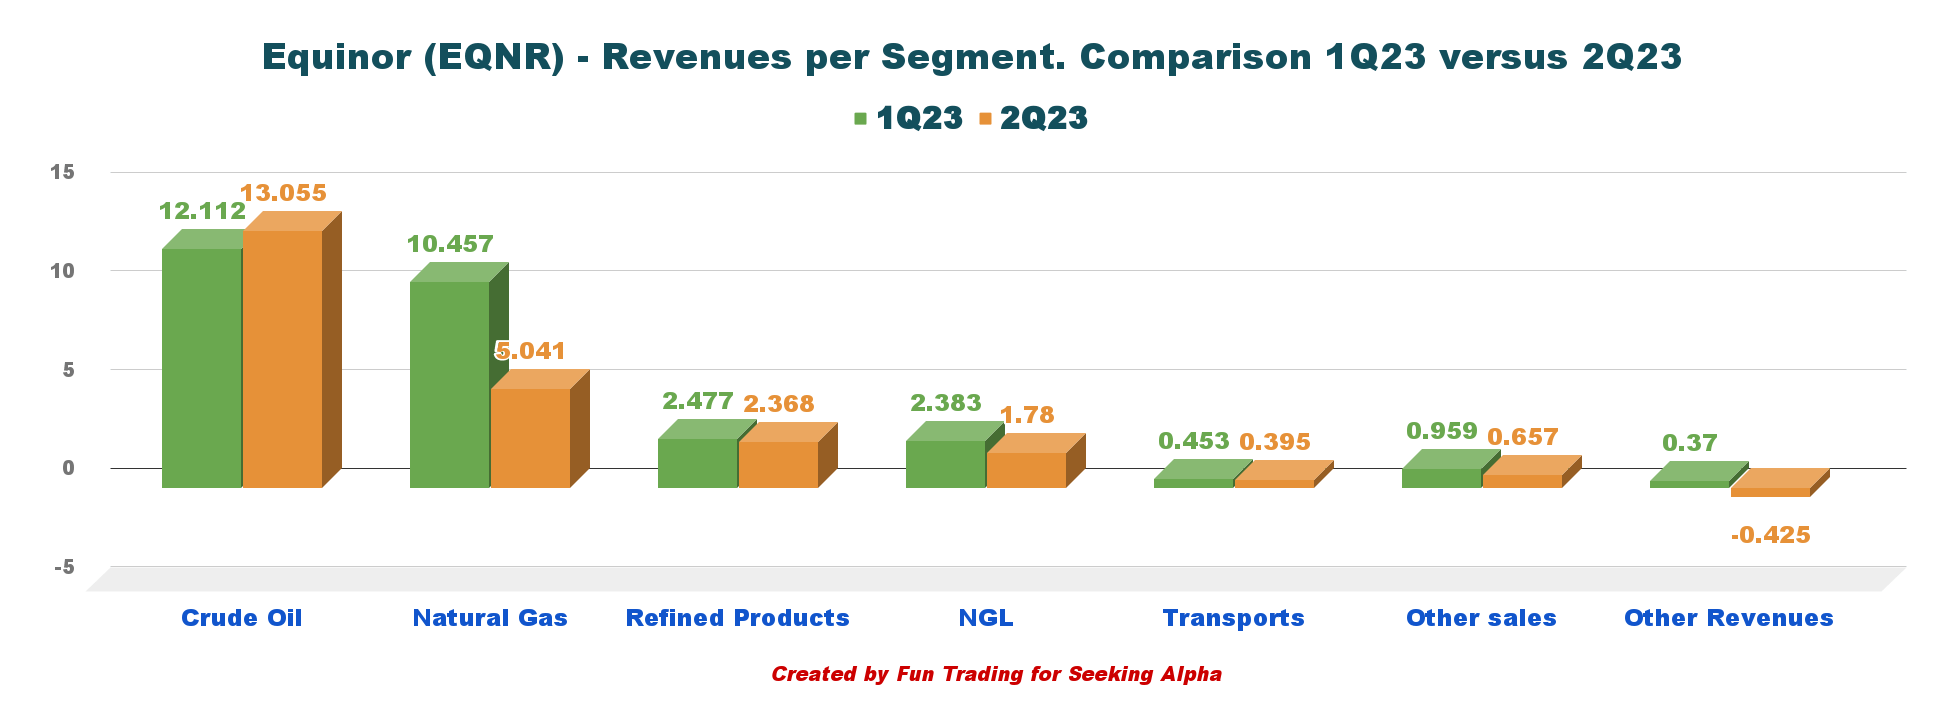
The integrated company is primarily an oil and gas producer with robust crude oil and natural gas segments, even if the natural gas segment dropped significantly this quarter, as we can see below:
EQNR Quarterly Revenue per Segment 1Q23 versus 2Q23 (Fun Trading)
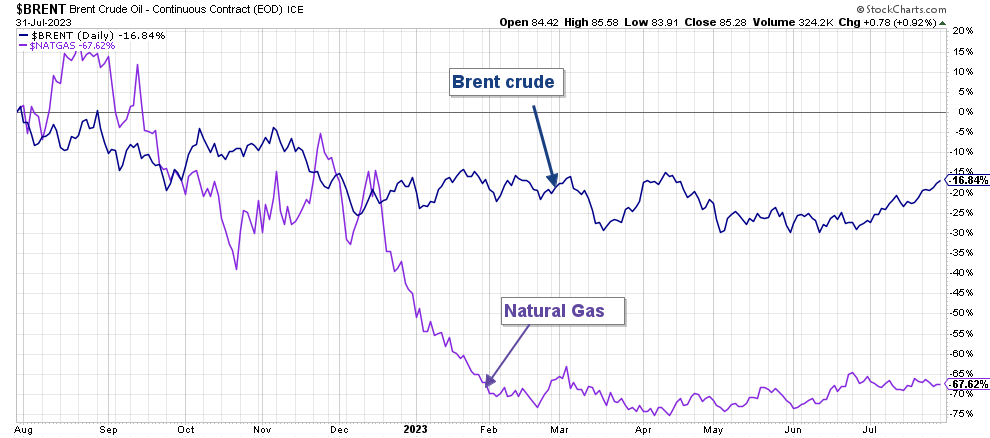
The oil and natural gas prices are now significantly below what they were a year ago. However, oil prices have been trending up since July.
EQNR 1-Year Chart oil versus NG (Fun Trading StockCharts)
2 - Stock Performance
Equinor's stock has underperformed its peers, with a 20% loss on a one-year basis. It is one of the worst performers amongst its peers due to its exposure to the natural gas sector, which has helped the company in 2022 but is now a negative component.
Balance Sheet And Production History Ending in 2Q23: The Raw Numbers
| Equinor |
| 2Q22 |
| 3Q22 |
| 4Q22 |
| 1Q23 |
| 2Q23 |
| Revenues in $ billion |
| 36.39 |
| 42.73 |
| 33.84 |
| 29.92 |
| 23.13 |
| Total Revenues and others in $ billion |
| 36.46 |
| 43.63 |
| 34.32 |
| 29.22 |
| 22.87 |
| Net Income in $ million |
| 6,757 |
| 9,384 |
| 7,897 |
| 4,966 |
| 1,829 |
| EBITDA $ billion |
| 22.22 |
| 28.54 |
| 15.65 |
| 16.16 |
| 9.92 |
| EPS diluted in $/share |
| 2.11 |
| 2.97 |
| 2.51 |
| 1.59 |
| 0.60 |
| Cash from operating activities in $ billion |
| 8.52 |
| 6.58 |
| 4.27 |
| 14.87 |
| 1.86 |
| Capital Expenditure in $ billion |
| 1.71 |
| 2.05 |
| 2.66 |
| 2.05 |
| 2.84 |
| Free Cash Flow in $ billion |
| 6.81 |
| 4.53 |
| 1.60 |
| 12.82* |
| -0.99* |
| Total cash $ billion |
| 45.69 |
| 44.34 |
| 39.31 |
| 50.04* |
| 40.56* |
| Long-term debt (+liabilities) in $ billion |
| 29.84 |
| 28.55 |
| 28.50 |
| 27.40 |
| 27.12 |
| Dividend per share in $ per share |
| 0.20 (+0.50) |
| 0.20 (+0.70) |
| 0.30 (+0.60) |
| 0.30 (+0.60) |
| 0.30 (+0.60) |
| Shares outstanding (diluted) in billion |
| 3.197 |
| 3.157 |
| 3.144 |
| 3.124 |
| 3.049 |
| Oil Production |
| 2Q22 |
| 3Q22 |
| 4Q22 |
| 1Q23 |
| 2Q23 |
| Oil Equivalent Production in K Boepd |
| 1,984 |
| 2,021 |
| 2,046 |
| 2,130 |
| 1,994 |
| Group average liquid price ($/b) |
| 106.9 |
| 92.9 |
| 80.4 |
| 73.8 |
| 70.3 |
Courtesy: Press release
* Estimated by Fun Trading
Note: On 25 July 2023, the Board of Directors declared an ordinary cash dividend for the second quarter of 2023 of $0.30 per share and an extraordinary cash dividend of $0.60 per share
Warning: The withholding Tax for Norway is about 30%.
Buyback program: In May 2023, Equinor launched the second tranche of $1,667 million . $550 million has been recognized as a reduction in equity due to an irrevocable agreement with a third party. $440 million was acquired in the open market and settled on 30 June 2023.
Financials: Revenues, Free Cash Flow, Debt, And Production
1 - Revenues and others were $22.872 billion in 2Q23
EQNR Quarterly Revenue History (Fun Trading) Revenues were $22.87 billion in 2Q23, down from $36.39 billion in the same quarter a year ago and down 21.7% sequentially (please see the graph above). Net Income was $1,829 million , or $0.60 per diluted share, down significantly from $2.11 per diluted share in the same quarter last year.
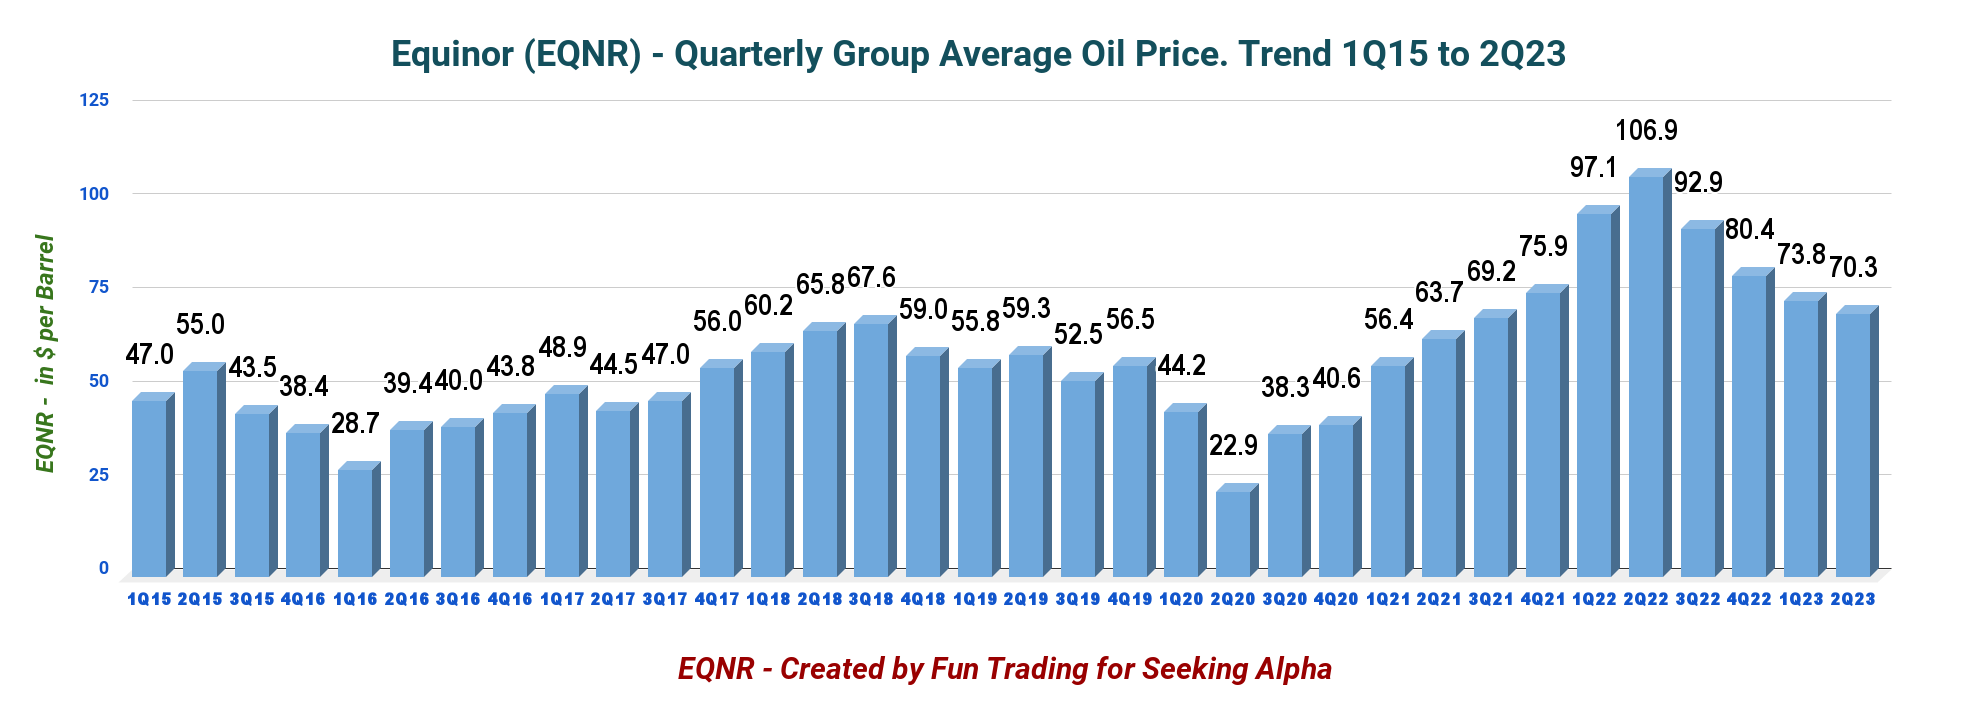
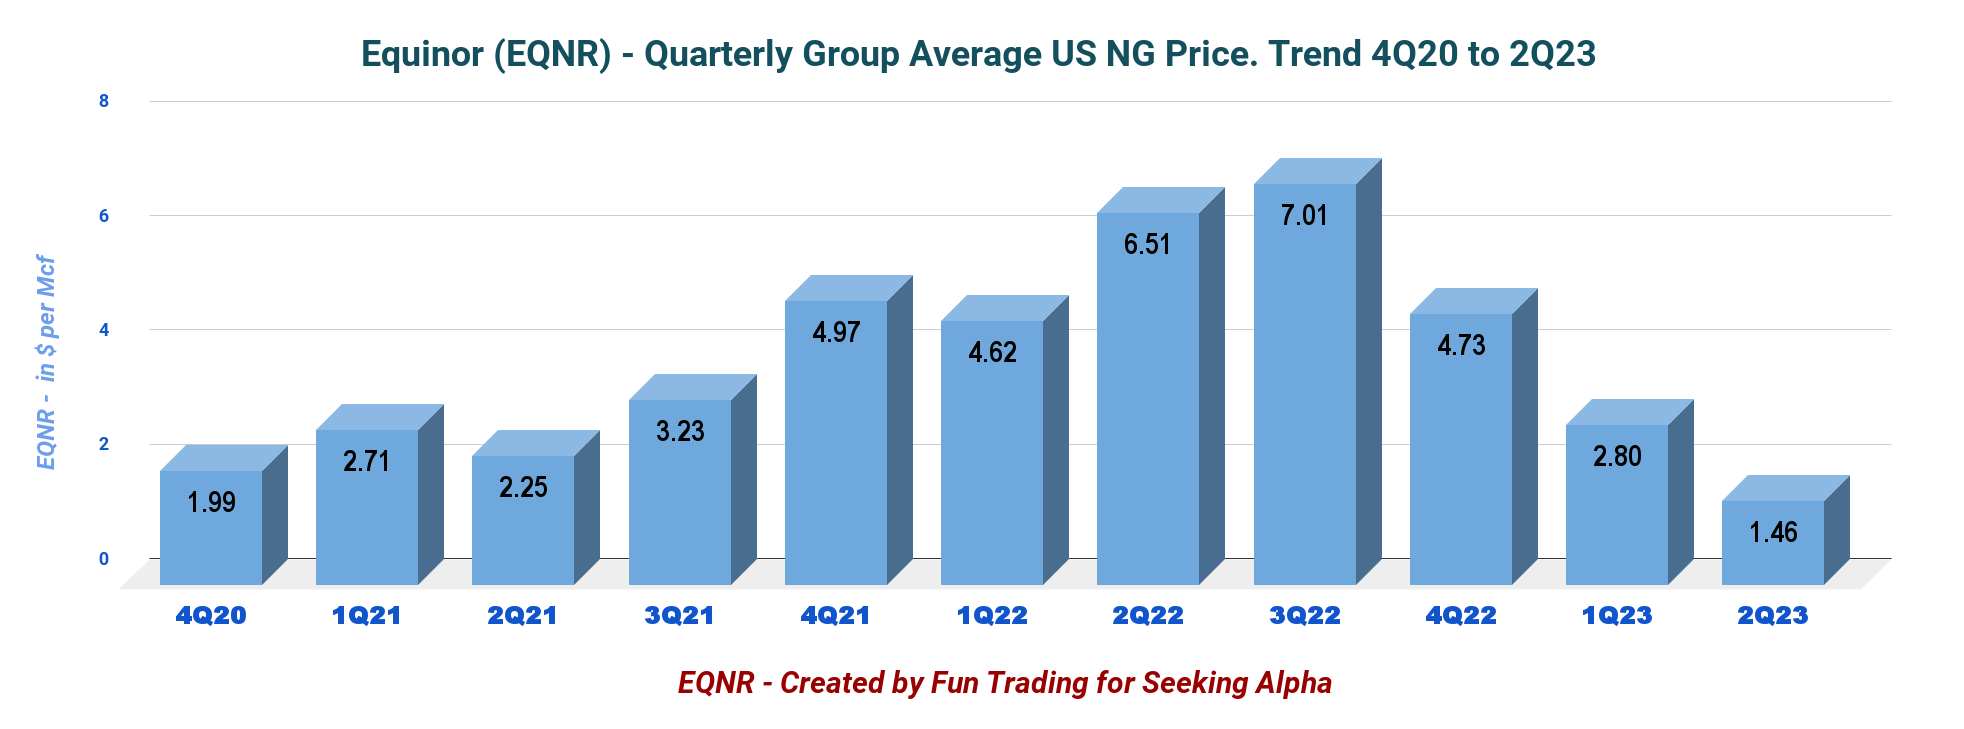
In the second quarter, the Norway average invoiced gas price was down to $11.46 per million Btu for Europe ($25.53 last year) and $1.46 for North America. The group average oil price was $70.3 per Boe.
EQNR Quarterly Group average oil price history (Fun Trading) EQNR Quarterly NG Price (US) History (Fun Trading)
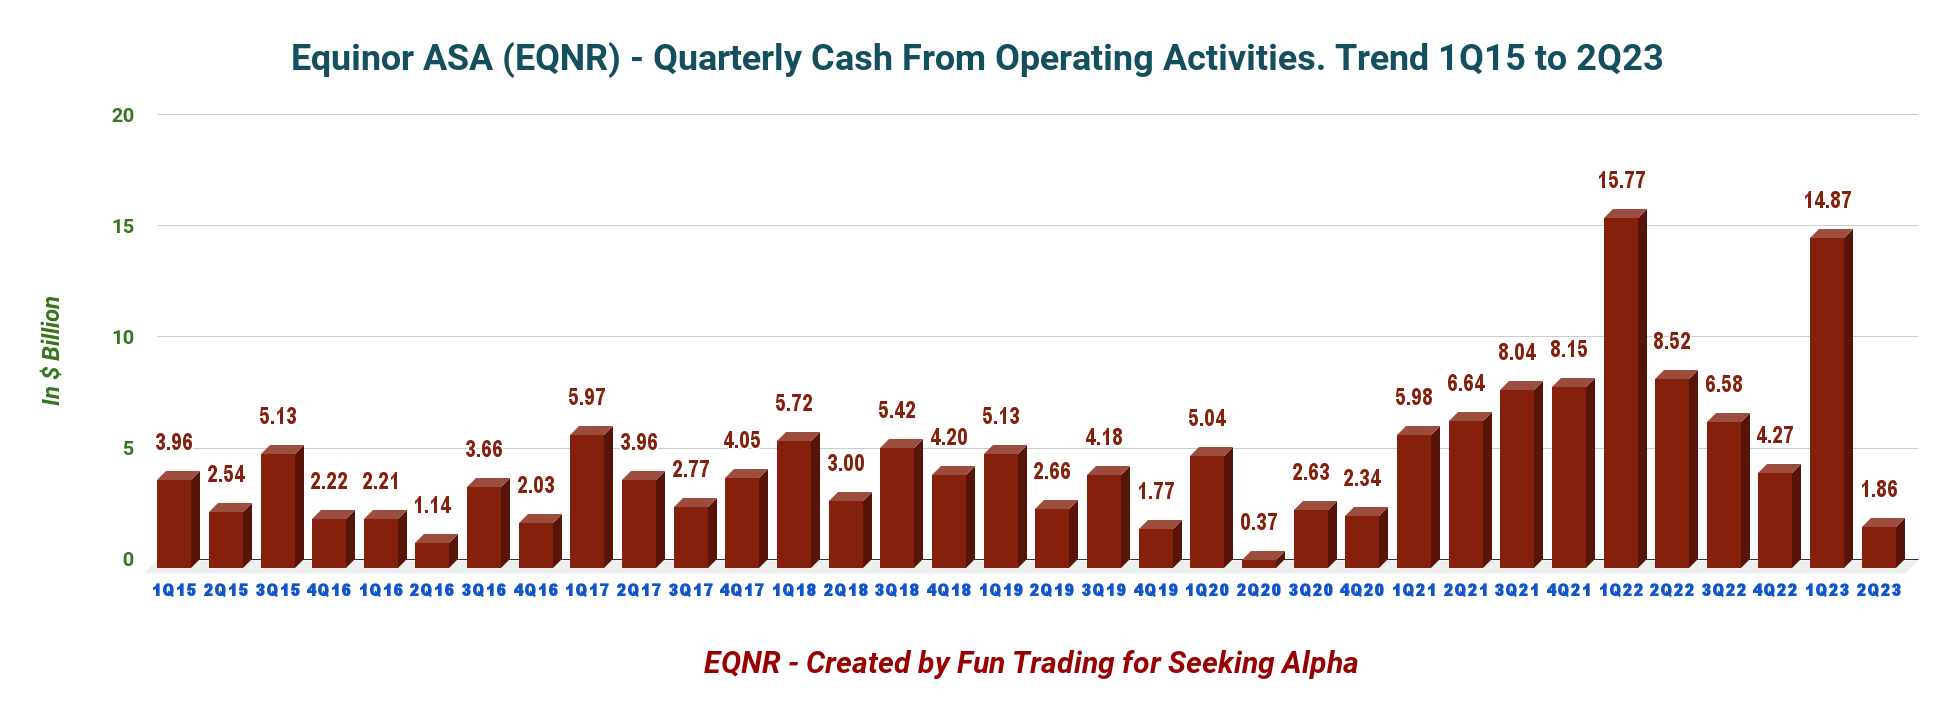
1.1 - Cash from Operating Activities was $1.86 Billion in 2Q23.
The cash flow provided by operating activities tumbled this quarter to $1,857 million .
EQNR Quarterly Cash from Operations (Fun Trading)
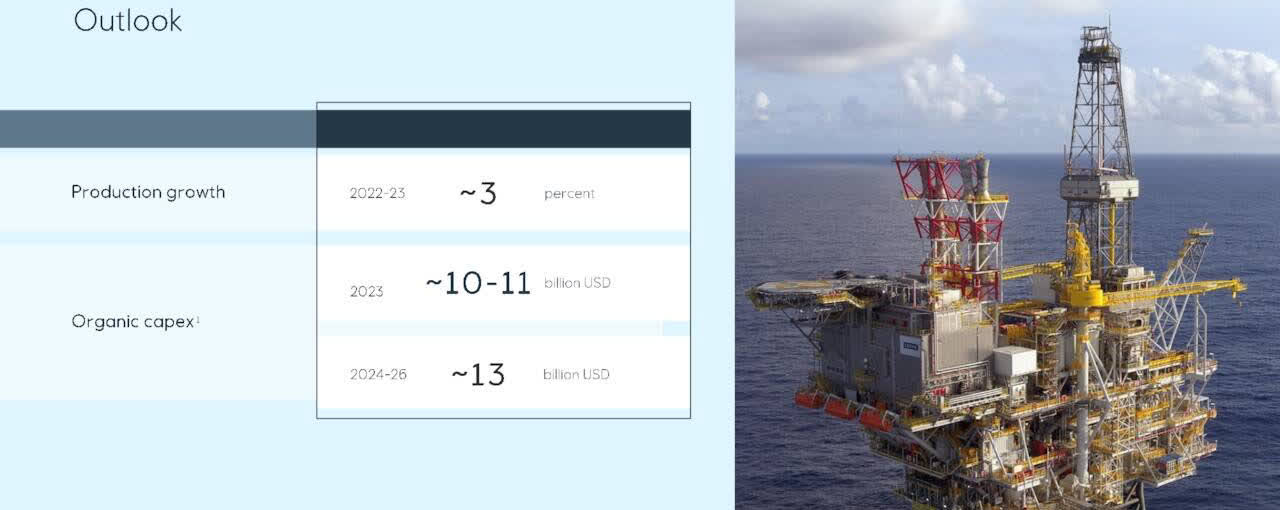
2 - 2023 Guidance and Beyond
Organic CapEx is expected to be $10-$11 billion in 2023 and will increase to ~13 billion in 2024-2025 , with production growth of ~3% in 2023.
EQNR 2023 Outlook (EQNR Presentation)
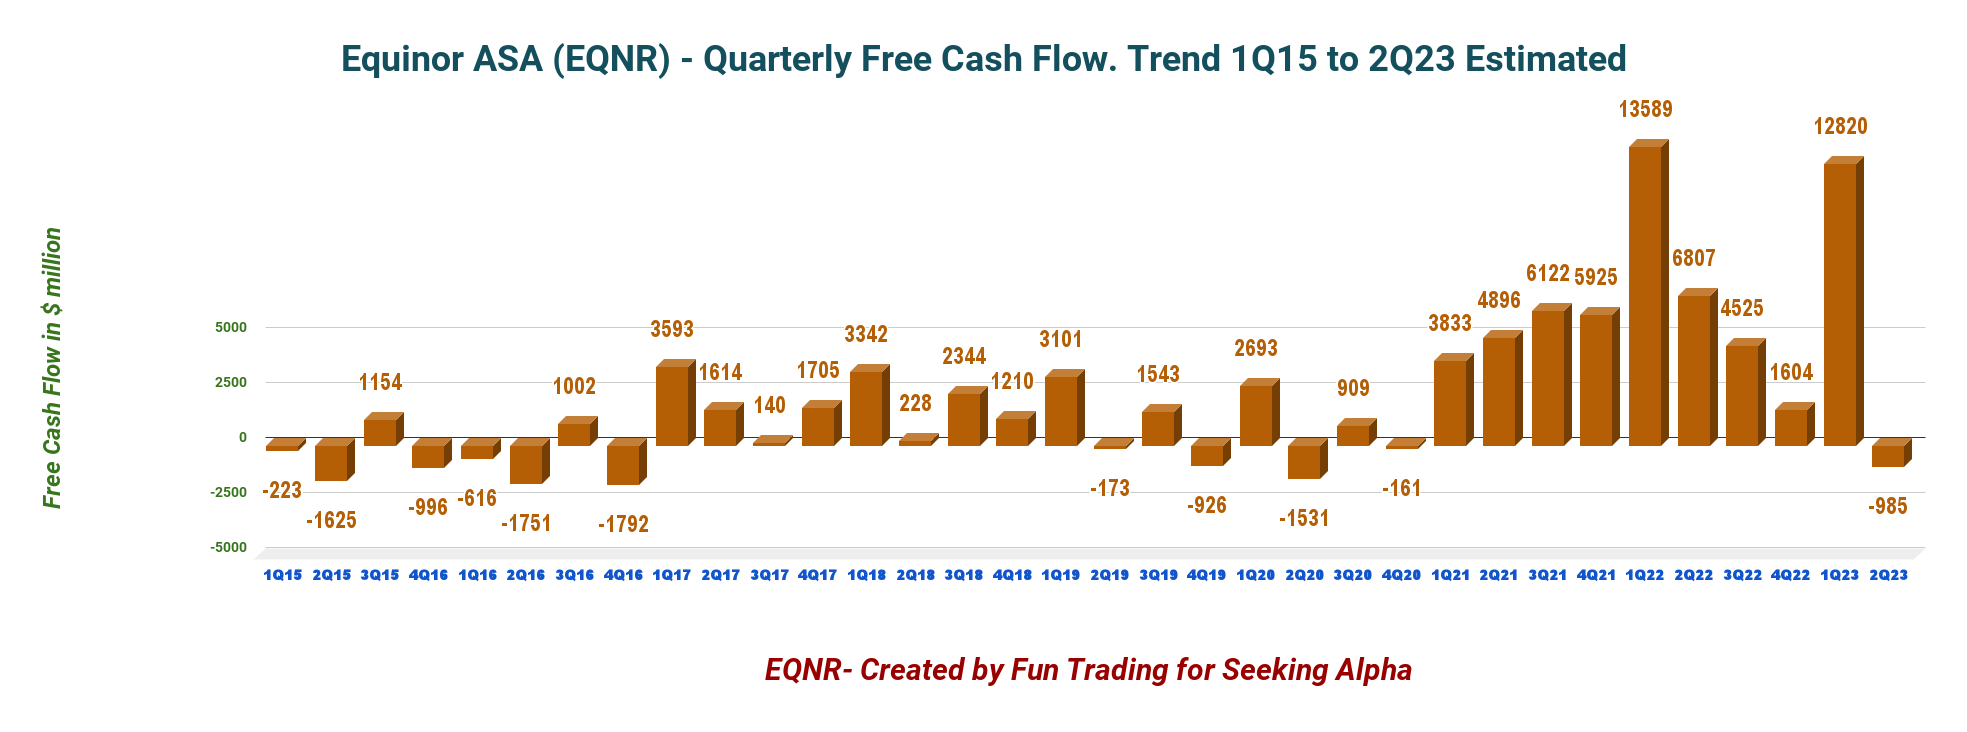
3 - Free Cash Flow was estimated at a loss of $985 million in 2Q23
EQNR Quarterly Free Cash Flow History (Fun Trading) Note: I use the generic free cash flow, not including divestitures. It is the cash flow from operations minus CapEx. The company has a different way of calculating the free cash flow.
The company's free cash flow was a loss of $985 million in the second quarter of 2023, with a trailing 12-month free cash flow of $17,712 million.
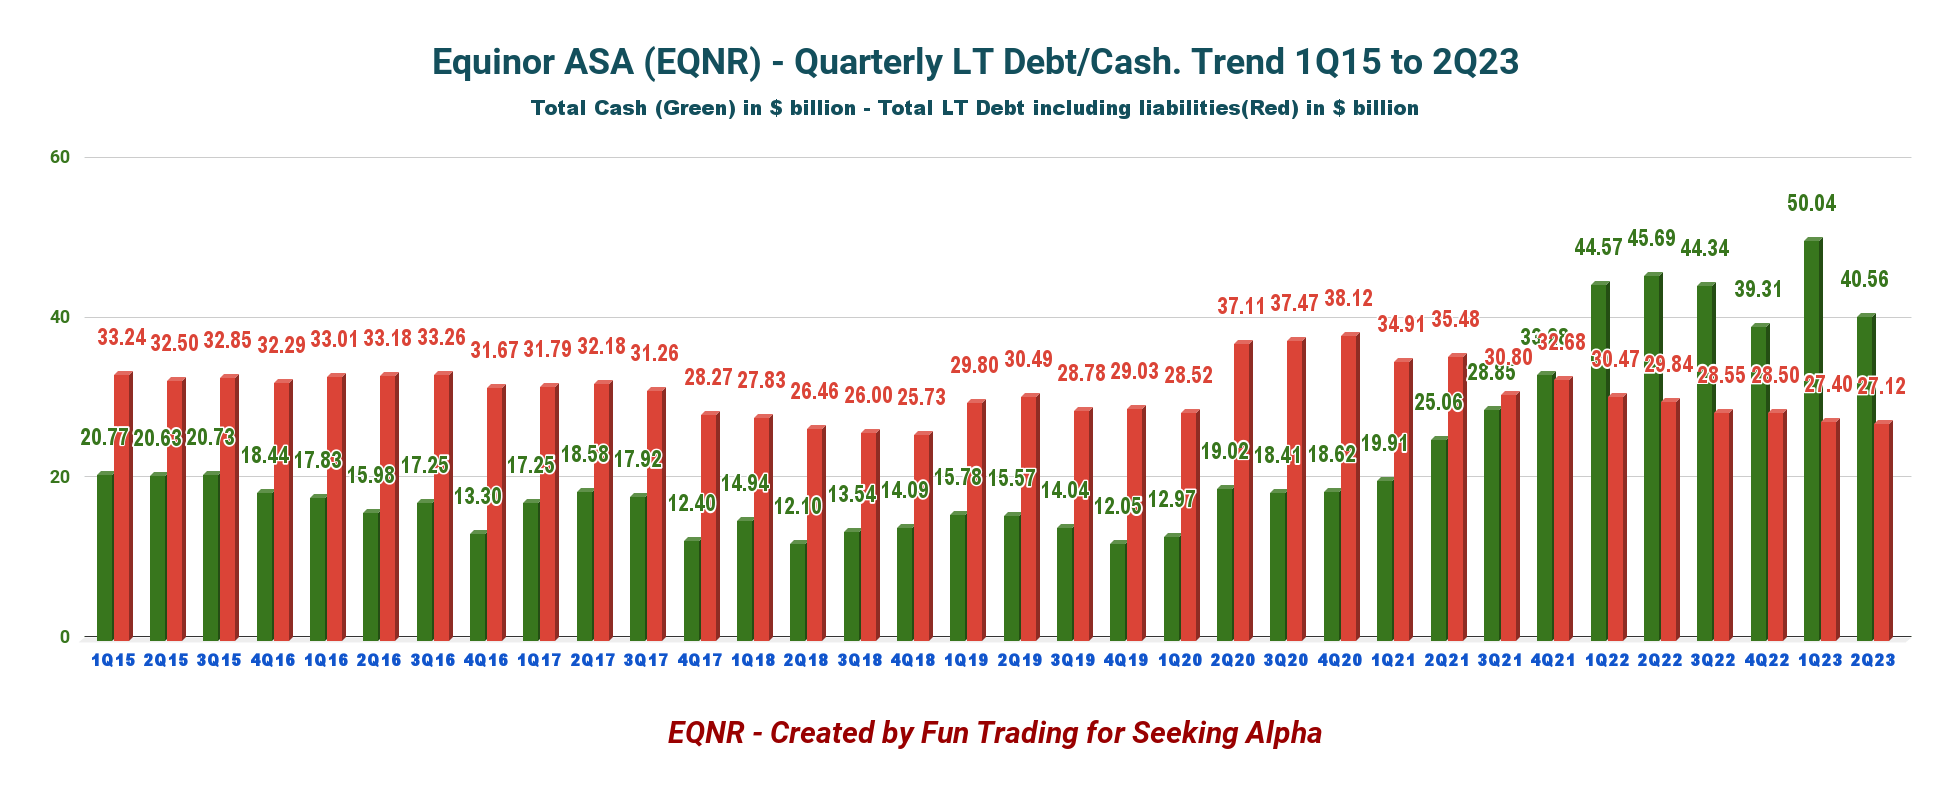
4 - No Net Debt in 2Q23. It's still an excellent profile.
EQNR Quarterly Cash versus Debt History (Fun Trading)
As of June 30, 2023, Equinor reported $40,560 million in cash, cash equivalents, and securities. The company's long-term debt amounted to $27.12 billion at the quarter-end. The company has no net debt.
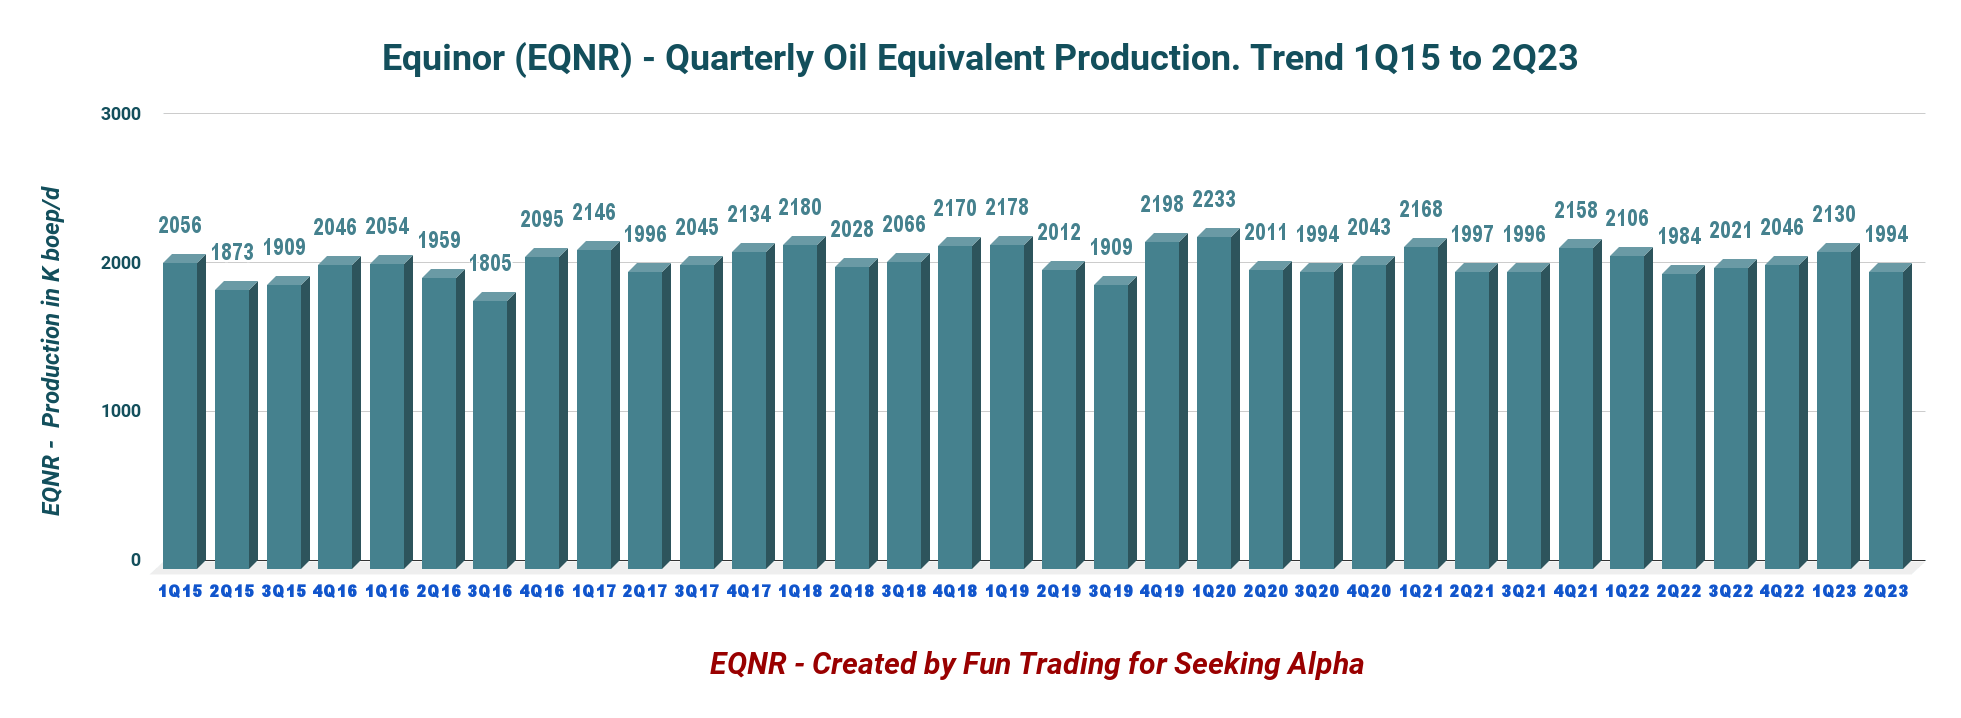
5 - Production Upstream and Investment in Renewables
EQNR Quarterly Production History (Fun Trading)
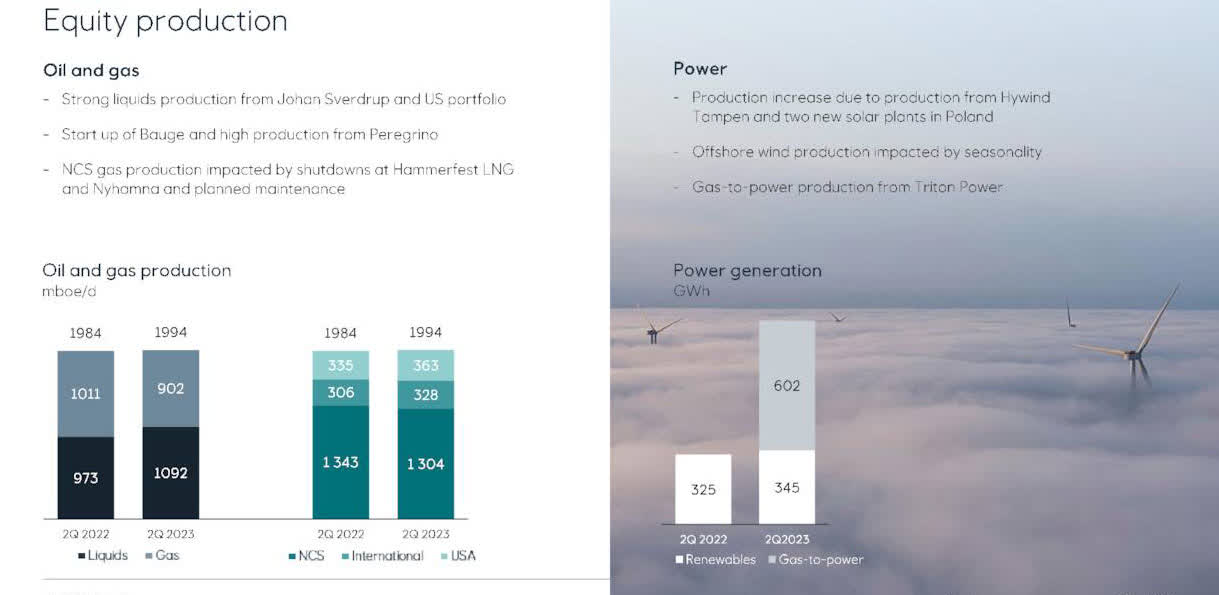
- The second quarter production was 1,994K Boep/d , up from 1,984K Boep/d in the same period in 2022 and down 6.4% sequentially. Gas production was 902K Boep/d or about 45.2% of the total output.
- Equinor share for Gas-to-Power was 602 GWh , and Renewable was 345 GWh compared to 325 GWh in 2Q22.
EQNR 2Q23 Equity Production (EQNR Presentation)
CFO Torgrim Reitan said in the conference call:
we announced the acquisition of the Brazilian Renewable Energy Company, Rio Energy , with a proven organization, a producing asset delivering close to 1 terawatt hour per year, and a solid pipeline of onshore wind and solar projects.
Technical Analysis And Commentary
EQNR TA Chart Short-Term (Fun Trading StockCharts)
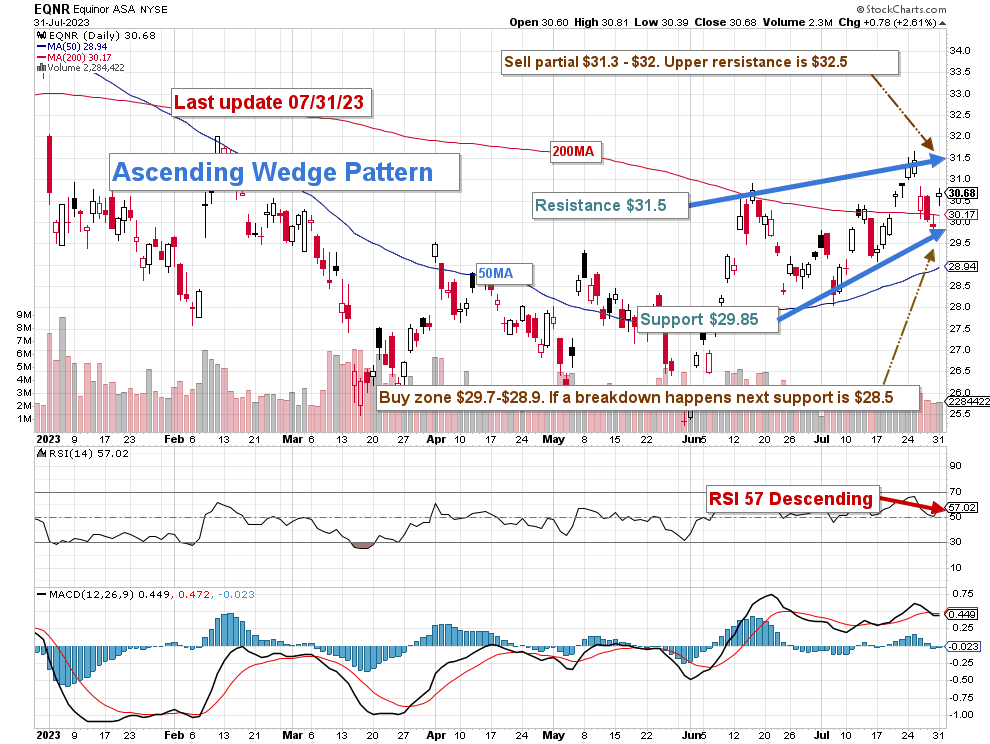
Note: The chart is adjusted for the dividend.
EQNR forms an ascending wedge pattern, with resistance at $31.50 and support at $29.85.
The rising wedge pattern represents a bearish continuation pattern formed after the rising correction. In a bullish trend, price bounces between two slopings begin wide at the bottom and contract as prices increase. After the rising correction, the continuation patterns follow a significant downtrend.
Thus, the overall strategy is to keep a core long-term position and use about 35%-40% to trade LIFO while waiting for a higher final price target to sell your core position at a higher profit.
The trading strategy is to sell between $31.3 and $32 with possible higher resistance at $32.5 and accumulate between $29.7 and $28.9 with possible lower support at $28.5 . Assuming no drastic new news, of course.
Note: As a reminder, EQNR depends highly on oil and gas prices, and your selling or buying strategy must factor in those critical components. The Norwegian company operated as Europe's largest natural gas supplier in 2021-2022 when Russia's Gazprom cut deliveries over the West's support for Ukraine.
Warning: The TA chart must be updated frequently to be relevant. It is what I am doing in my stock tracker. The chart above has a possible validity of about a week. Remember, the TA chart is a tool only to help you adopt the right strategy. It is not a way to foresee the future. No one and nothing can.
For further details see:
Equinor ASA: A Weak Quarter As Gas Prices Are Falling