EQNR - Equinor ASA: Natural Gas Price Not So Sweet Anymore
2023-03-27 06:46:31 ET
Summary
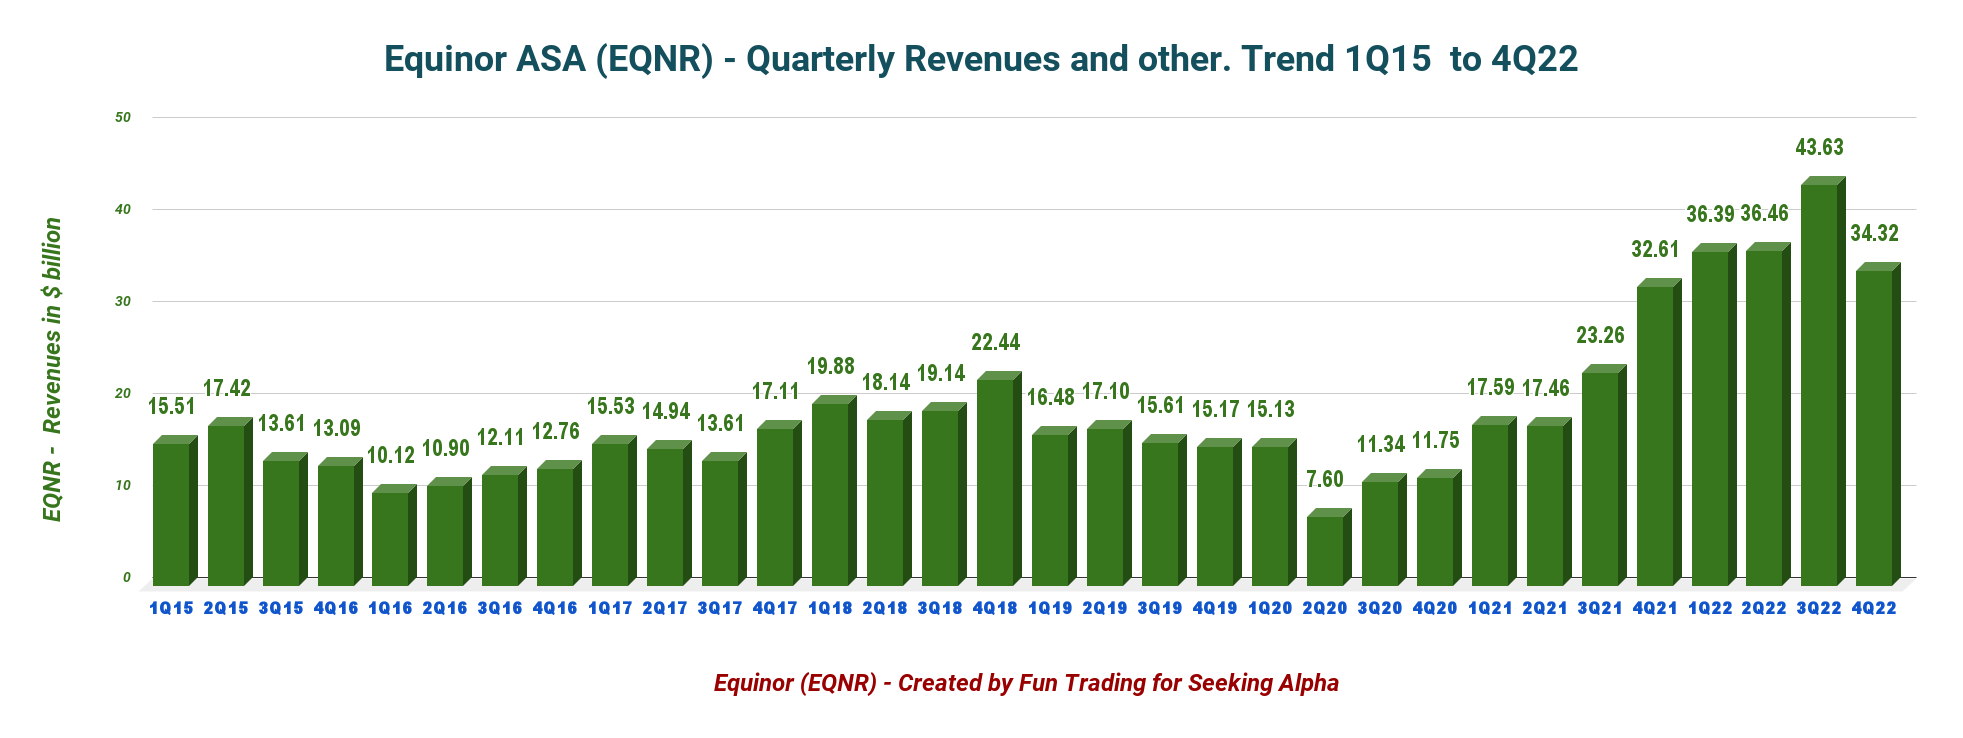
- Equinor's revenues and others were $34.32 billion in Q4'22, up from $32.61 billion in the same quarter a year ago and down 21.3% sequentially.
- Equinor had an outstanding year in 2022 but is now facing tough headwinds, with commodity prices retreating significantly from their highs.
- I recommend buying EQNR between $26.5 and $25 with possible lower support at $24.
Introduction
The Norwegian-based Equinor ASA ( EQNR ) reported its fourth quarter and full-year 2022 results on February 8, 2022.
Note: This article is an update of my article published on January 10, 2023. I have followed EQNR on Seeking Alpha since January 2017.
This article examines the company's recent history, including the fourth-quarter earnings, and conjecture about what to expect in 2023 and how to navigate the industry successfully.
Equinor had an outstanding year in 2022 but is now facing tough headwinds, with commodity prices retreating significantly from their highs, especially natural gas prices, representing a significant part of Equinor's revenue.
1 - 4Q22 and full-year 2022 result Snapshot and commentary
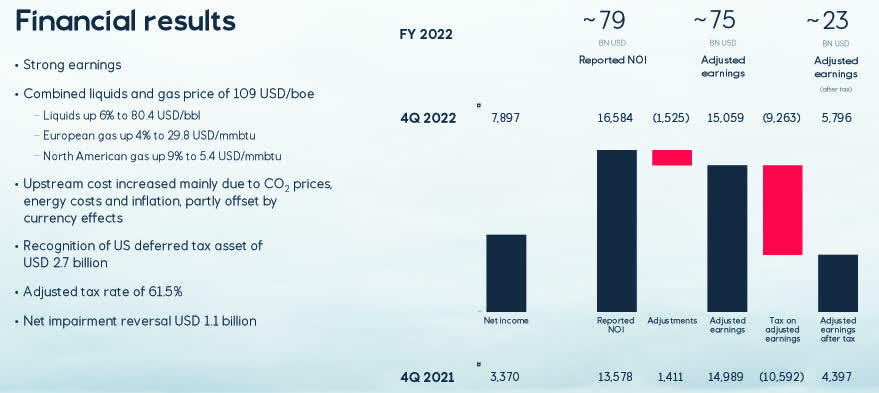
Equinor reported solid fourth-quarter results. Earnings easily beat analysts' expectations. Equinor generated $1.604 billion in generic free cash flow this quarter, and revenues were $34.321 billion, up 5.3% from the 4Q21 revenues of $32.608 billion.
EQNR 4Q22 and full-year financial results (EQNR Presentation)
CEO Anders Opedal said in the conference call :
2022 was our special year. The war in Europe still causes human suffering and has disrupted the energy markets contributing to inflation and cost of living crisis. In Europe, this year marks a shift as we move forward, not relying on Russian oil and gas. Equinor responded quickly and we are well positioned to be a part of the solution.
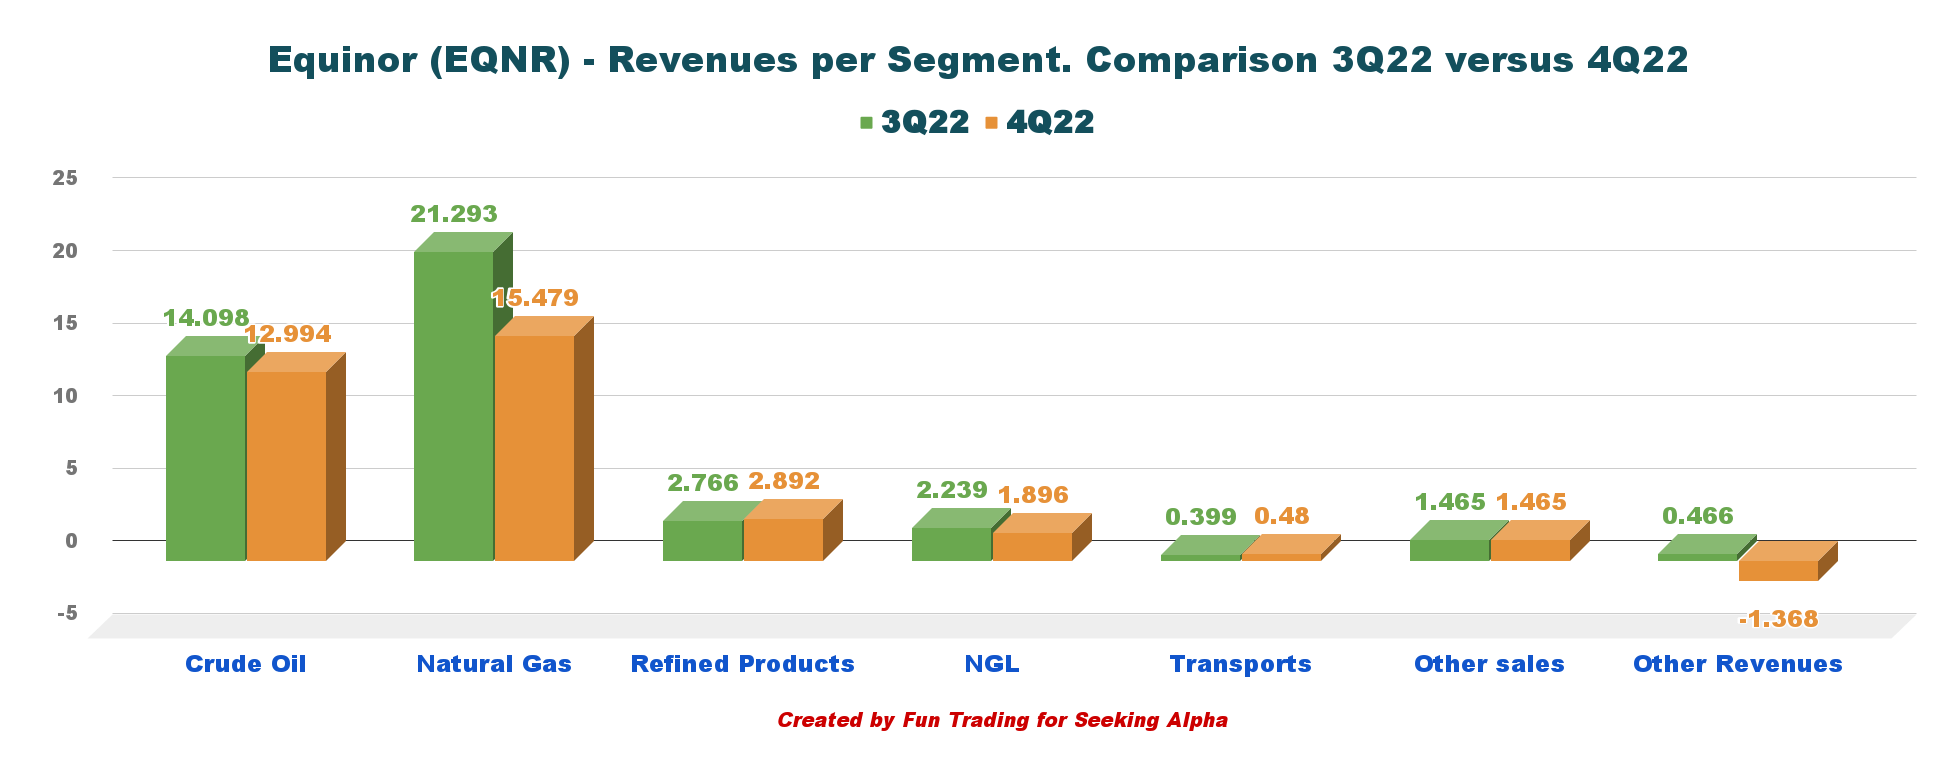
The integrated company is primarily an oil and gas producer with a robust crude oil segment, as we can see below:
EQNR Quarterly Revenue detail 3Q22 versus 4Q22 (Fun Trading)
Thus, Equinor is the ideal play in the natural gas segment. It worked wonders for the company in 2022 because natural gas prices were elevated, but it can also be seen as a curse if the commodity price turn bearish, as we have experienced the past few months.
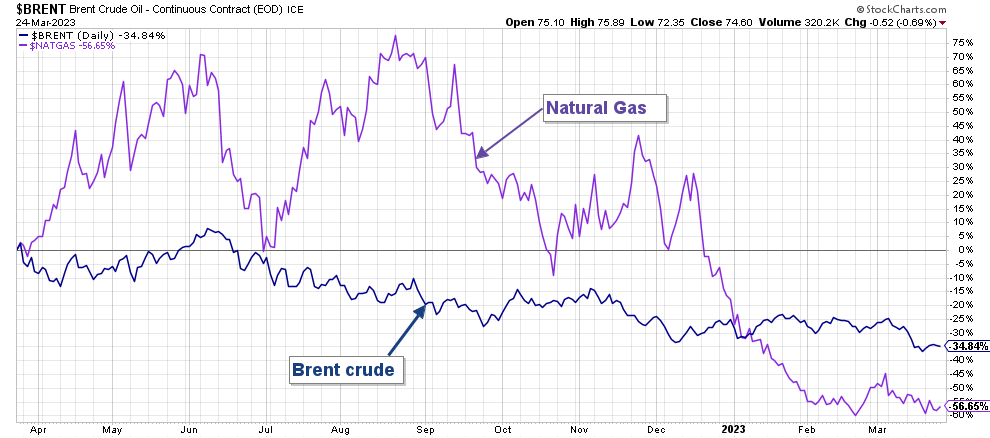
The oil and natural gas prices are now significantly below what they were a year ago.
EQNR 1-Year chart Brent and NG prices (Fun Trading StockCharts)
2 - Stock Performance
Equinor's stock has underperformed its peers with a 26.5% loss on a one-year basis. It is one of the worst performers amongst its peer due to its exposure to the natural gas sector.
Balance Sheet And Production history ending in 4Q22: The Raw Numbers
| Equinor |
| 4Q21 |
| 1Q22 |
| 2Q22 |
| 3Q22 |
| 4Q22 |
| Revenues in $ billion |
| 32.13 |
| 36.05 |
| 36.39 |
| 42.73 |
| 33.84 |
| Total Revenues and others in $ billion |
| 32.61 |
| 36.39 |
| 36.46 |
| 43.63 |
| 34.32 |
| Net Income in $ million |
| 3,368 |
| 4,710 |
| 6,757 |
| 9,384 |
| 7,897 |
| EBITDA $ billion |
| 17.76 |
| 19.51 |
| 22.22 |
| 28.54 |
| 15.65 |
| EPS diluted in $/share |
| 1.03 |
| 1.46 |
| 2.11 |
| 2.97 |
| 2.51 |
| Cash from operating activities in $ billion |
| 8.15 |
| 15.77 |
| 8.52 |
| 6.58 |
| 4.27 |
| Capital Expenditure in $ billion |
| 2.23 |
| 2.18 |
| 1.71 |
| 2.05 |
| 2.66 |
| Free Cash Flow in $ billion |
| 5.93 |
| 13.59 |
| 6.81 |
| 4.53 |
| 1.60 |
| Total cash $ billion |
| 33.28 |
| 44.57 |
| 45.69 |
| 44.34 |
| 39.31 |
| Long-term debt (+liabilities) in $ billion |
| 32.68 |
| 30.47 |
| 29.84 |
| 28.55 |
| 28.50 |
| Dividend per share in $ per share |
| 0.20 (+0.20) |
| 0.20 (+0.20) |
| 0.20 (+0.50) |
| 0.20 (+0.70) |
| 0.30 (+0.60) |
| Shares outstanding (diluted) in billion |
| 3.249 |
| 3.237 |
| 3.197 |
| 3.157 |
| 3.144 |
| Oil Production |
| 4Q21 |
| 1Q22 |
| 2Q22 |
| 3Q22 |
| 4Q22 |
| Oil Equivalent Production in K Boepd |
| 2,158 |
| 2,106 |
| 1,984 |
| 2,021 |
| 2,046 |
| Group average liquid price ($/b) |
| 75.9 |
| 97.1 |
| 106.9 |
| 92.9 |
| 80.4 |
Courtesy: Company 4Q22 Press release
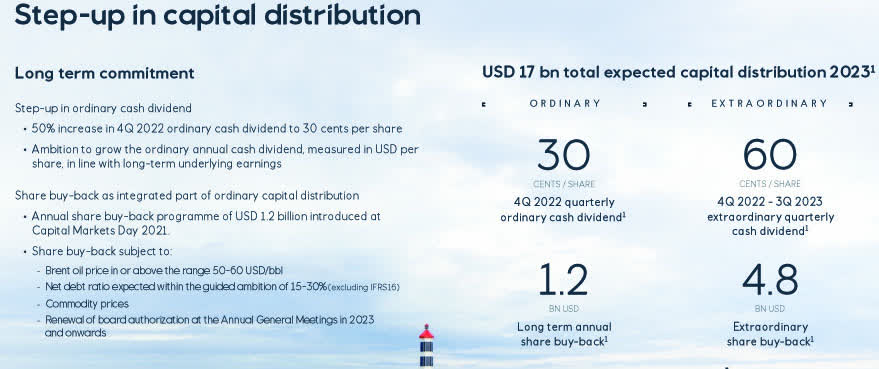
Note: The board of directors declared an ordinary cash dividend of $0.30 per share for the fourth quarter of 2022, up from $0.20 per share for the third quarter of 2022.
The board has decided to continue the share buy-back program of $1.2 billion annually , introduced in 2021 as an integrated part of capital distribution.
In addition, the board proposes an extraordinary cash dividend of $0.60 per share for the fourth quarter of 2022. The board has also decided to increase the $1.2 billion share buy-back program by up to $4.8 billion, resulting in a program of up to $6.0 billion in 2023.
Financials: Revenues, Free Cash Flow, Debt, And Production
1 - Revenues and others were $34.32 billion in 4Q22
EQNR Quarterly Revenues history (Fun Trading) Revenues and others were $34.32 billion in 4Q22, up from $32.61 billion in the same quarter a year ago and down 21.3% sequentially (please see the graph above).
Net income was $7,895 million, or $2.51 per diluted share, up from $1.04 per diluted share in the same quarter last year.
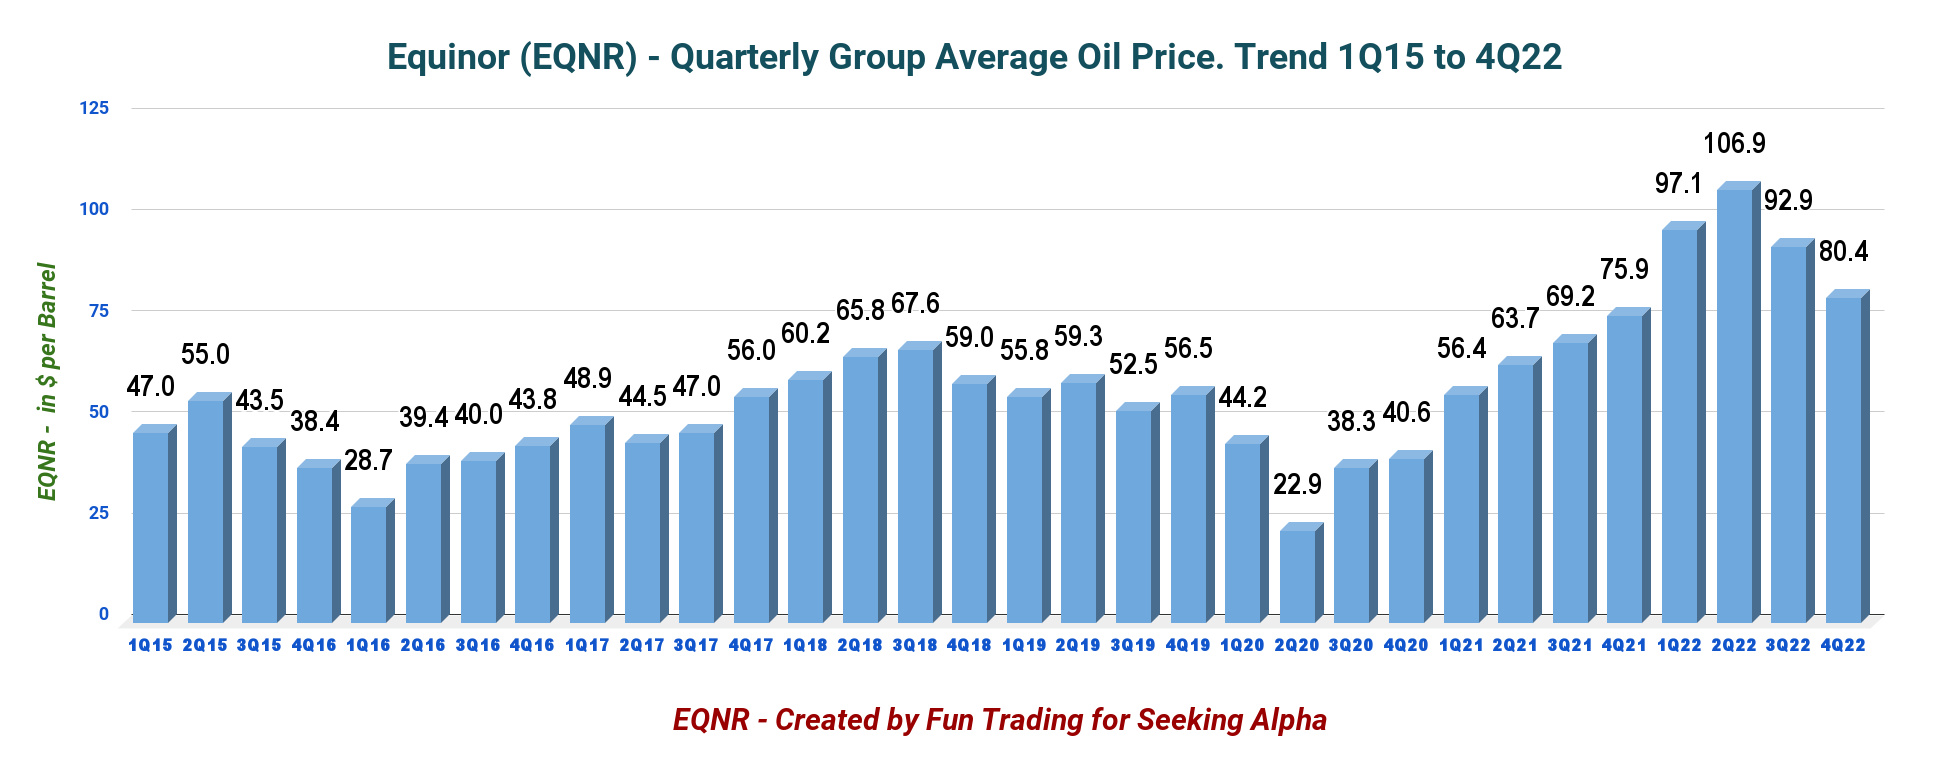
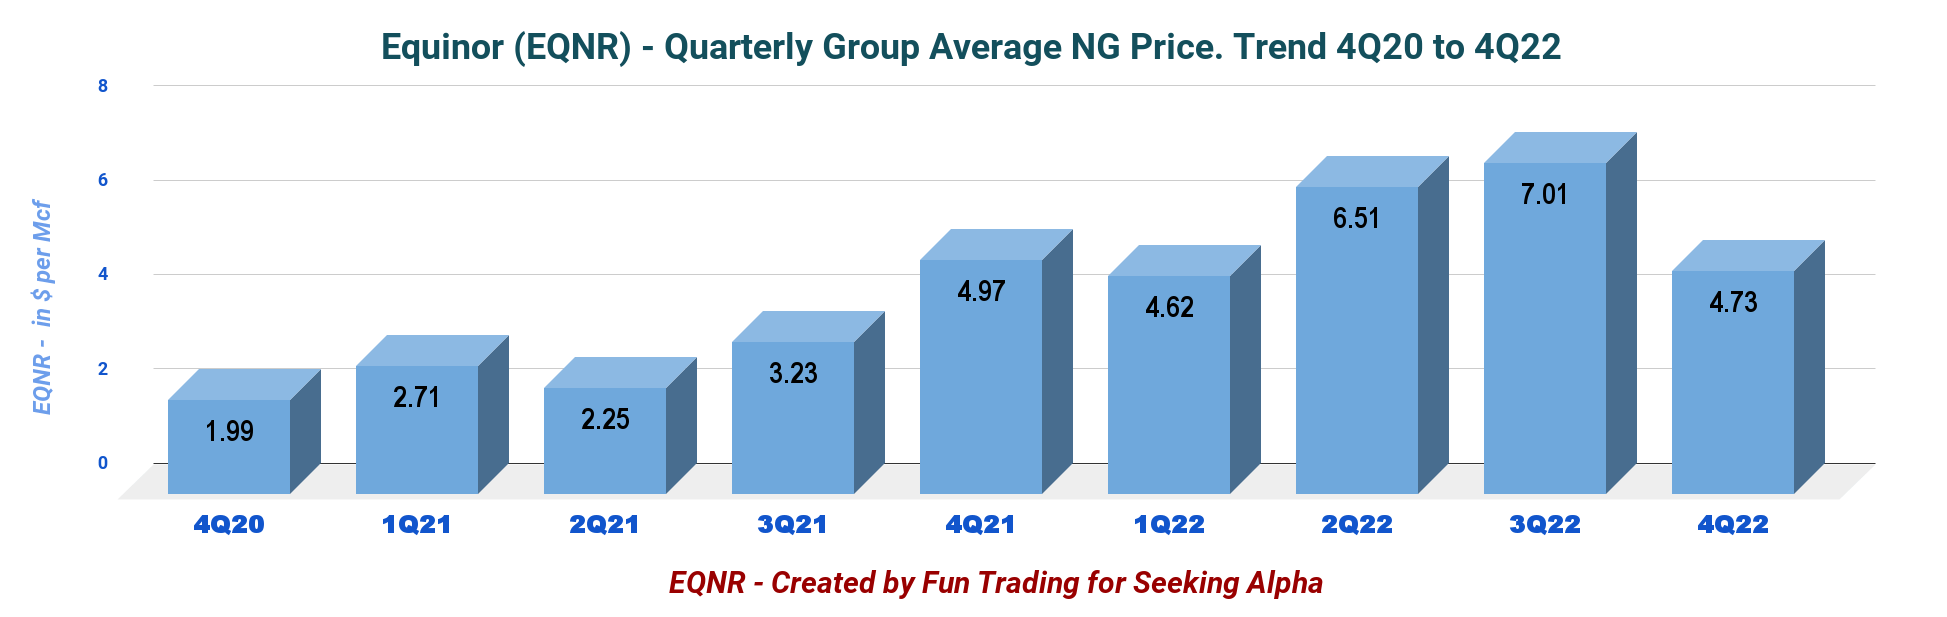
In the fourth quarter, the Norway average invoiced gas price was $27.22 per million Btu for Europe ($28.52 last year) and $4.73 for North America. The group average oil price was $80.4 per Boe.
EQNR Oil price history (Fun Trading) EQNR Quarterly Average gas prices history (Fun Trading)
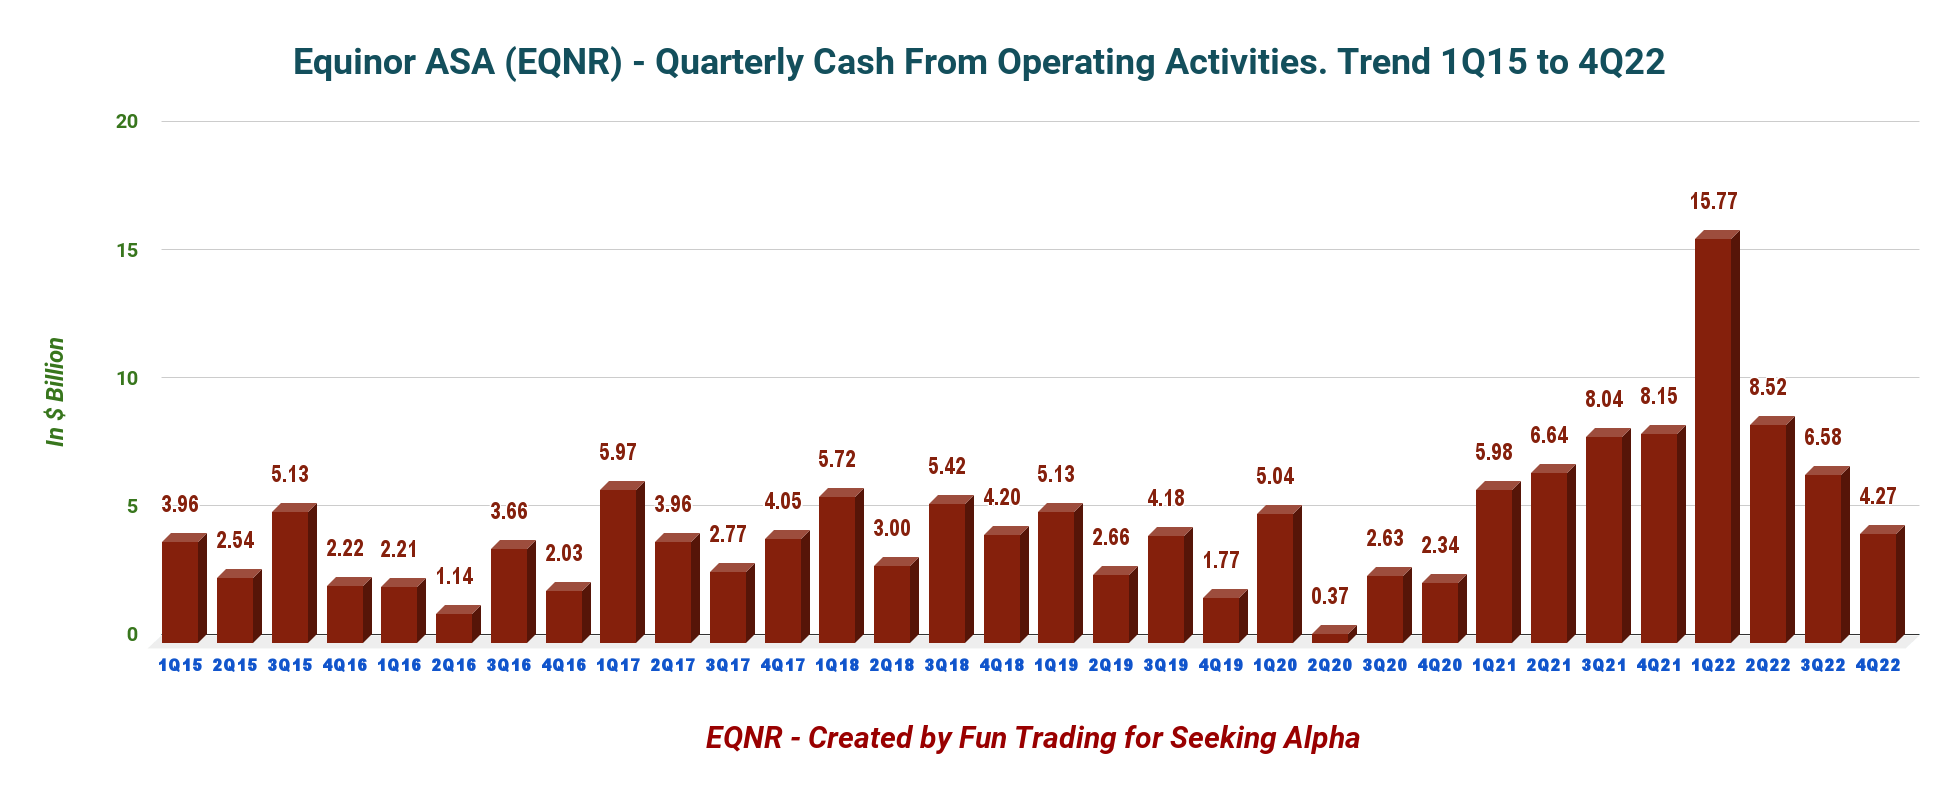
1.1 - Cash from operating activities was $4.267 billion in 4Q22.
The cash from operating activities is dropping quickly and is a concern for the coming 1Q23.
EQNR Quarterly Cash flow from operations history (Fun Trading)
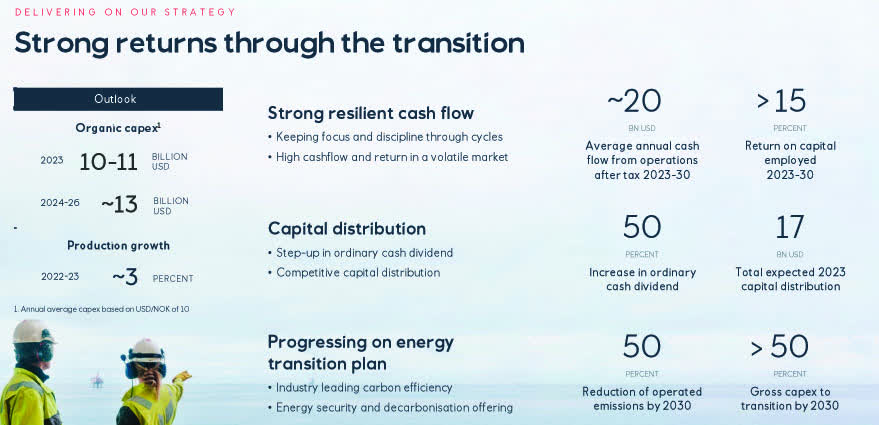
2 - 2023 Guidance and beyond
Organic CapEx is expected to be $10-$11 billion in 2023 and will increase to ~13 billion in 2024-2025, with production growth of ~3% in 2023.
EQNR Outlook 2023 and beyond (EQNR Presentation)
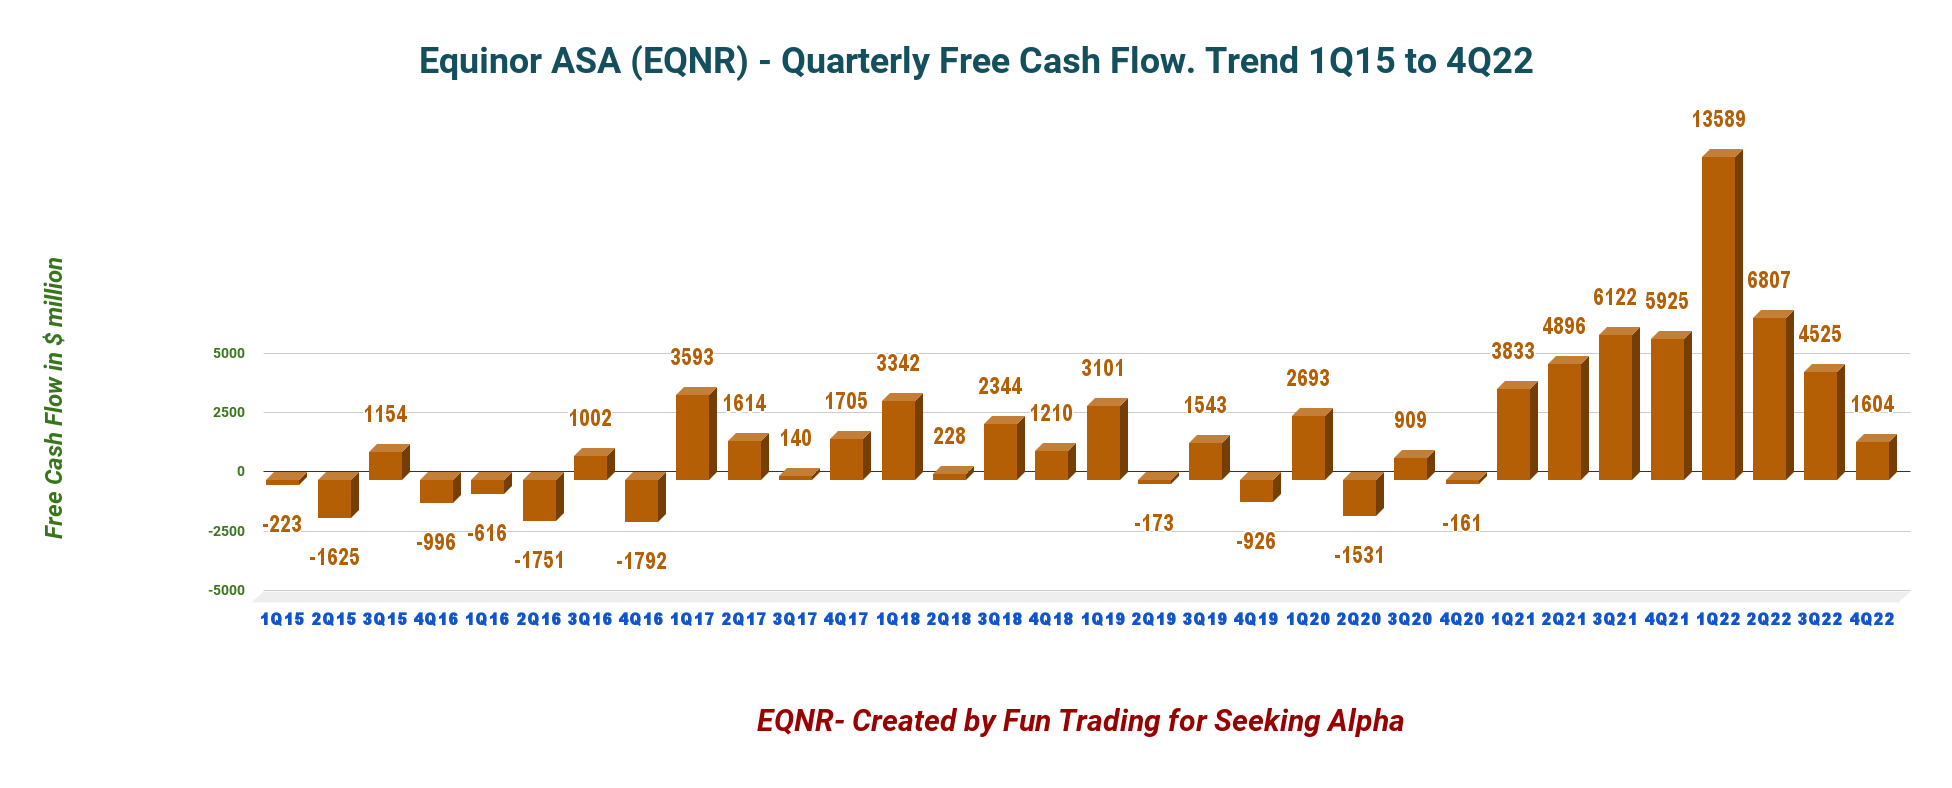
3 - Free Cash Flow was $1,604 million in 4Q22
EQNR Quarterly Free cash flow history (Fun Trading) Note: I use the generic free cash flow, not including divestitures. It is the cash flow from operations minus CapEx. The company has a different way of calculating the free cash flow.
The company's free cash flow was $1,604 million in the fourth quarter of 2022, with a trailing 12-month free cash flow of $26,525 million.
Equinor announced a quarterly dividend of $0.30 per share, unchanged from 2Q22. Also, its board declared a special quarterly cash dividend of $0.60 per share for the fourth quarter of 2022.
EQNR Capital distribution explained (EQNR Presentation)
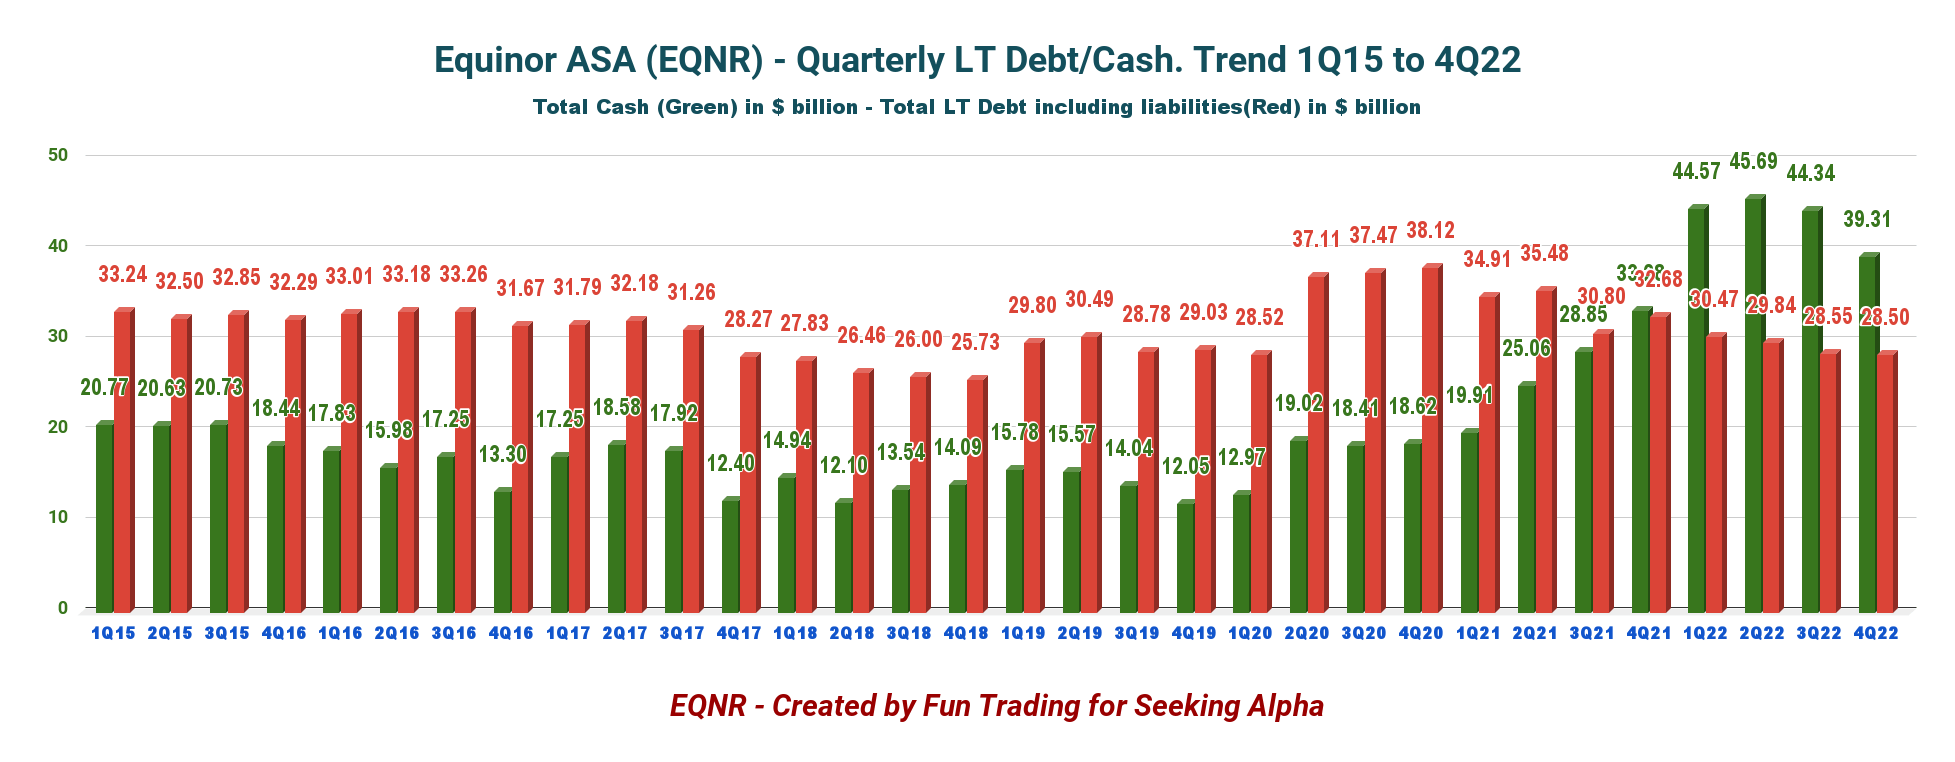
4 - No Net Debt in 3Q22. Excellent profile.
EQNR Quarterly Cash versus Debt history (Fun Trading)
Note: The above debt in the graph is the gross interest-bearing debt plus liabilities.
As of December 31, 2022, Equinor reported $39,314 million in cash, cash equivalents, and securities. The company's long-term debt amounted to $28.5 billion at the quarter-end. The company has no net debt.
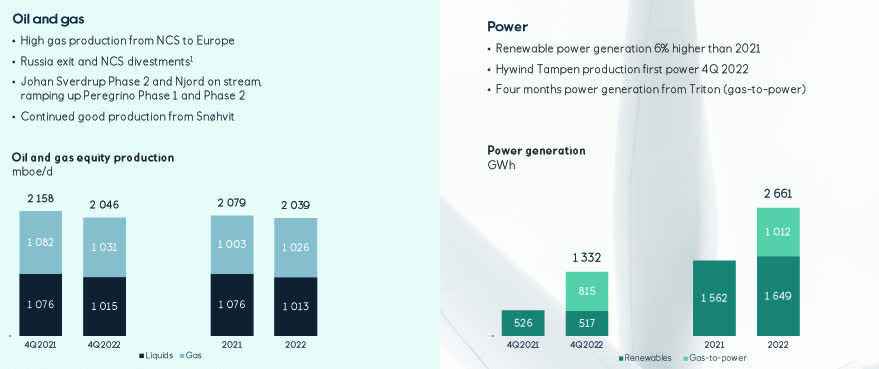
5 - Production Upstream and Investment in Renewables
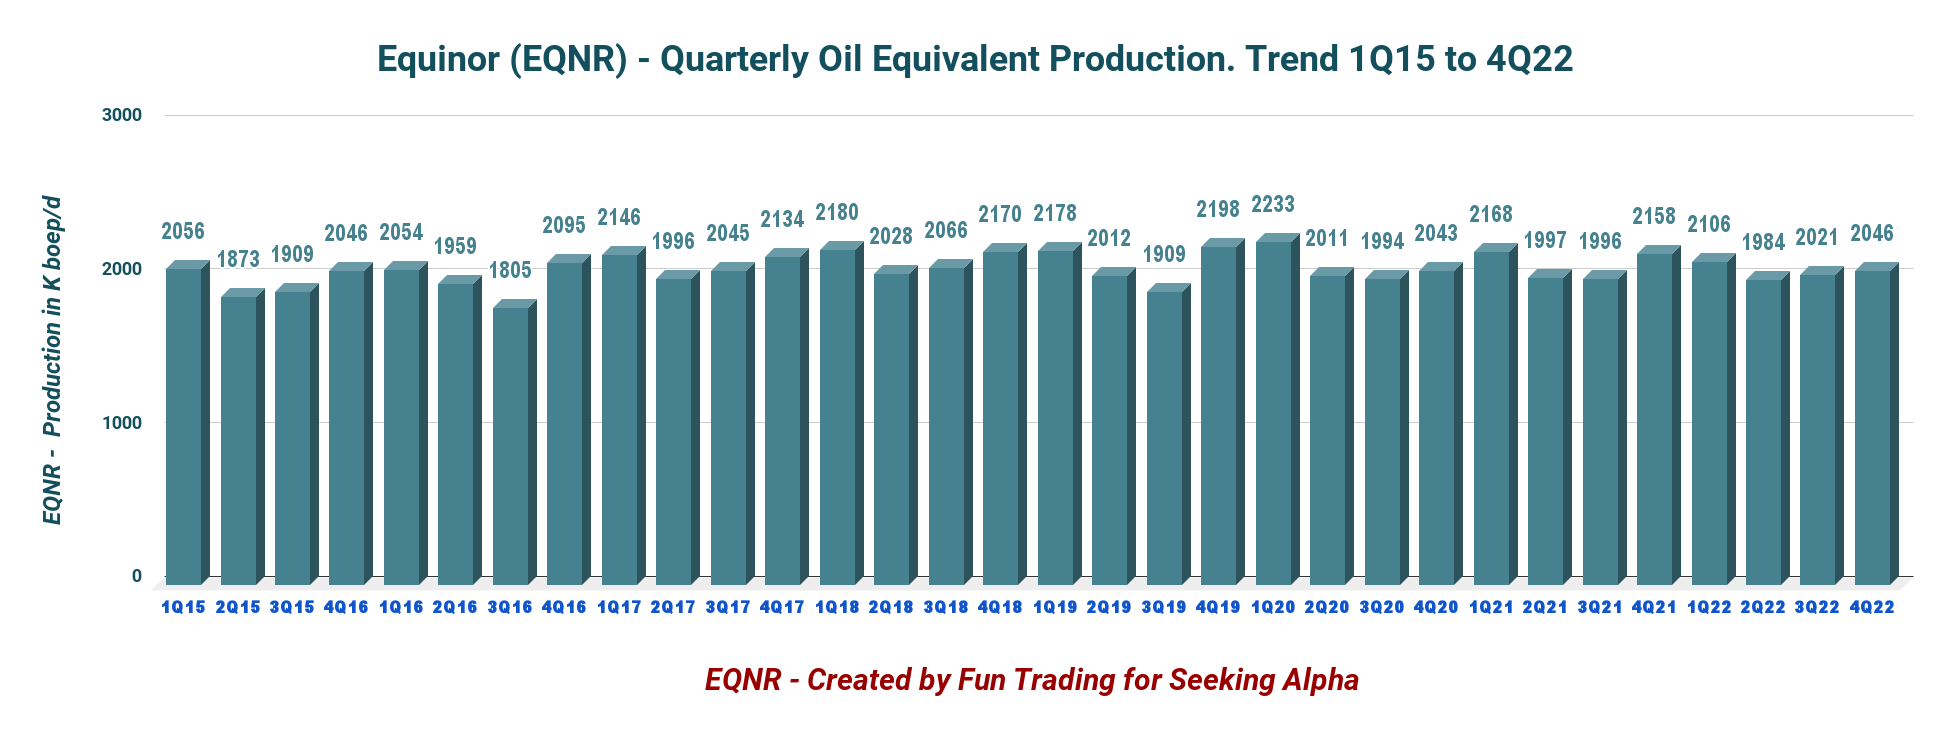
5.1 - Oil Equivalent Production
EQNR Quarterly Oil equivalent history (Fun Trading)
- The fourth quarter production was 2,046K Boep/d, down from 2,158K Boep/d in the same period in 2021 and up 1.2% sequentially. Gas production was 1,015 Boep/d or about 49.6% of the total output.
- Equinor share for power generation was 517 GWh this quarter, down from 526 GWh last year. The company is advancing its shift to renewable.
5.2 - Presentation
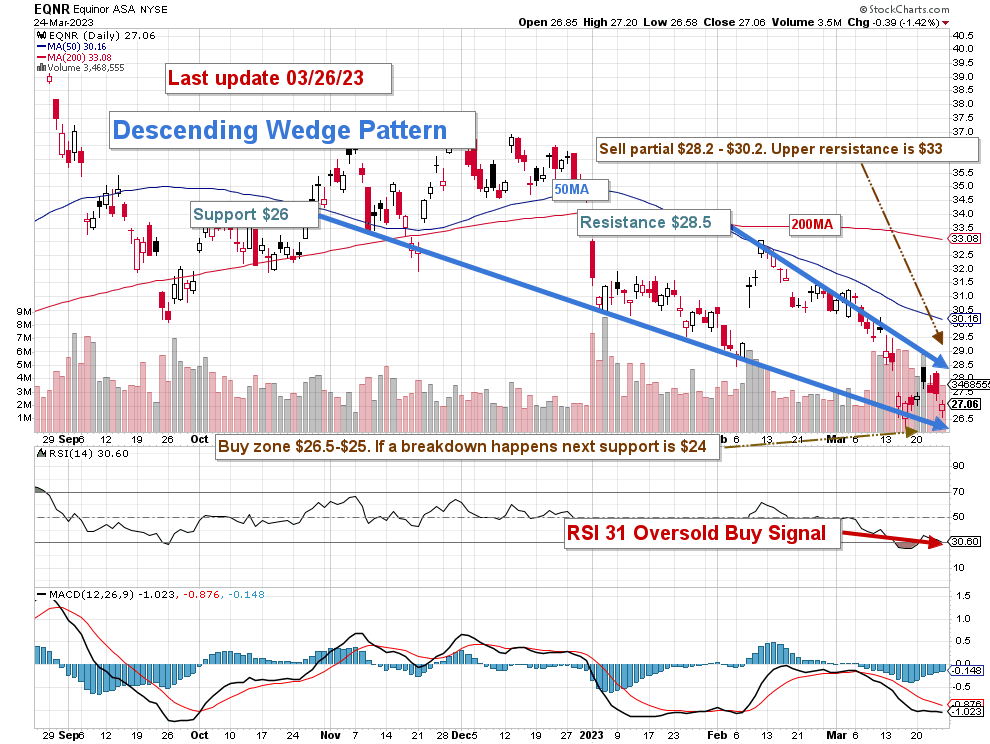
EQNR 4Q22 oil and gas production (EQNR Presentation) EQNR TA Chart Short-term (Fun Trading StockCharts) Technical Analysis And Commentary
Note: The chart is adjusted for the dividend.
EQNR forms a descending Wedge pattern with resistance at $28.5 and support at $26. RSI is 31 and indicates that EQNR is oversold now and should be accumulated.
The descending wedge is considered a bullish price pattern in which bulls prepare for another push upward. In short, this type of pattern often ends with a breakout.
However, 2023 has seen a dramatic retreat in oil prices and especially natural gas prices, and the subsequent earnings results will show lower revenues and free cash flow, which may push EQNR even lower.
Thus, the overall strategy I usually promote in my marketplace, "The Gold and Oil Corner," is to keep a core long-term position and use about 35%-40% to trade LIFO while waiting for a higher final price target to sell your core position at a significant profit.
The trading strategy is to sell about 35%-40% at between $28.2 and $30.2 with possible higher resistance at $33 and accumulate between $26.5 and $25 with possible lower support at $24. Assuming no drastic new news, of course.
As a reminder, EQNR depends highly on oil and gas prices, and your selling or buying strategy must factor in these critical components. The Norwegian company evolved as Europe's largest natural gas supplier in 2021 when Russia's Gazprom cut deliveries over the West's support for Ukraine. However, 2023 will not repeat 2022, and investors must be cautious.
Warning: The TA chart must be updated frequently to be relevant. It is what I am doing in my stock tracker. The chart above has a possible validity of about a week. Remember, the TA chart is a tool only to help you adopt the right strategy. It is not a way to foresee the future. No one and nothing can.
For further details see:
Equinor ASA: Natural Gas Price Not So Sweet Anymore