IWM - Equity CEF Performances: Updated Through Jan. 27
Summary
- It's been radio silence from the Federal Reserve and Jerome Powell for a while, but that all ends Wednesday when the Fed gives its latest update.
- Expectations are for a 25 bp rate rise but there could be a surprise or two in the Fed statement or from chairman Powell in his Q&A.
- Overall, it's hard to say whether it will be the main market catalyst next week as earnings from Apple, Alphabet, Amazon, Meta Platforms, Qualcomm, etc. are also on tap.
- But one thing is for sure. The pain trade is higher right now and a lot of institutional and individual investors got a mouthful of that last week being short Tesla.
- Technically however, we're reaching the upper resistance levels of around $410 for the S&P 500 (SPY) so any hope to break above this $370-$410 range will depend on continued positive earnings and no surprises out of the Fed. For the week, SPY was up +2.5% while the Nasdaq-100 (QQQ) was up another +4.8% and is now up +11.3% YTD.
Below is your Equity CEF Performance spreadsheet links updated through Jan. 27 , 2023 :
EquityCEFPerformances.1.27.2023.xlsx
Like last week's Netflix ( NFLX ) , $360.77 current market price , earnings rally that spiked the technology sector, this week's Tesla ( TSLA ) , $177.90 current market price , earnings seemed to light a fire under the markets and draw in even more investors who had way too much cash on hand.
And for those who were short the market as well as everyone's favorite stock to short, i.e. TSLA, there was even more pain as TSLA skyrocketed 33.3% for the week. Ouch!
This has led to rapidly improving market sentiment that continues to draw in investors big and small, though next week represents a major hurdle to get over as the S&P 500 ( SPY ) , $405.68 current market price , nears the $410 resistance levels.
Will it do it? Assuming no surprises out of a packed schedule of mega-cap company earnings next week and a more predictable Federal Reserve that won't upset the APPL-cart (no pun intended), breaking out over that $410 level may largely depend on how much cash is still sitting on the sidelines in investor accounts. That's not an easy number to know but the Fear Of Missing Out, or FOMO, seems to be back in vogue at the moment and it seems the higher the markets go, the more cash seems to be coming in off the sidelines.
Note: SPY hit a high of $408.16 on Friday before selling off in the last 30 minutes of trading to close up +0.2% after being up as high as +0.8%
Equity CEFs
It was a rather odd week for equity CEFs as up to a dozen or so funds that were beating the S&P 500 ( SPY ) before this week at NAV, fell behind this last week.
I'm not really sure why that happened but I believe it was mostly due to a combination of big money institutions getting more market exposure by simply buying the major market ETFs like SPY, the Nasdaq-100 ( QQQ ) , $296.26 current market price , the Russell 2000 Small Cap ( IWM ) , $189.58 current market price , or the multitude of other ETFs that emulate those major market benchmarks, while equity CEFs that have a lesser number of positions in their portfolio than the indices like SPY with 500, the QQQs with 100 and IWM with 2000, may have underperformed by simply not being in the right stocks, like a TSLA.
Could that have made that much of a difference? I think it has as the market seems to be separating the winners, like NFLX and TSLA and others like American Express ( AXP ) , up +13.6% last week, from the losers, like Intel ( INTC ) , down -6.4% on Friday alone after a disastrous earnings report.
In other words, it's become more of a stock picker's market that's not defined by sector leadership or market cap size anymore. And that's not necessarily the best news for those equity CEFs that rely less on their stock picking prowess and more on their income strategy efficiency.
So for funds that may use the S&P 500 as their benchmark, if the stocks they own as a subset of the 500 in the index are not performing as well as the index itself, then it's going to be hard for those fund's NAVs to keep up with SPY on a total return basis. And sometimes it's not just the stocks they own but also the ones they don't, like a TSLA or NFLX, which have contributed a much larger percentage gain to an indexes like SPY or QQQ than usual so far this year.
I'll have more on this tomorrow when I come out with the updated Equity CEF/ETF Portfolio Guide.
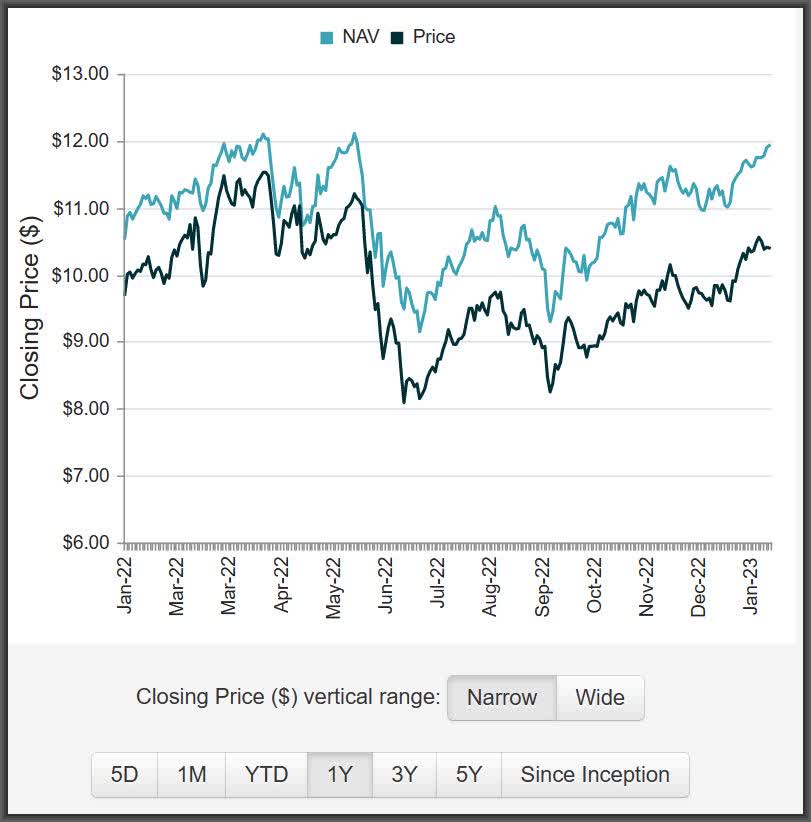
Finally, I have one more fund that I believe is looking more and more attractive and that is the BlackRock Resources & Commodities Strategy fund ( BCX ) , $10.40 current market price .
BCX uses an option income strategy on its all-stock portfolio that includes sectors such as metals and mining, representing 27.4% of the portfolio value, oil, gas and consumables at 36.6% and chemicals at 18.1% of portfolio value.
Here's BCX's Fact Sheet as of 12/31/22:
So if you go to near the bottom of Sheet3 of the Equity CEF Performance link above, you'll see that BCX's NAV is up 6.7% YTD but its MKT price is only up 4.8% .
That's not a huge difference but considering BCX's NAV is almost at its 52-week high (even after distributions) around $12.00 but its market price is lagging considerably from its highs from last year, is the thinking that commodity and metal prices have peaked?
CEFConnect.com
I think that's unlikely especially when you consider what impact China's reopening should have on commodity prices. And when you look at BCX's wide discount of -12.8% coupled with two distribution increases just in the last year, BCX seems very undervalued in a popular sector that has cooled off a bit as inflation comes down but may yet get hot again before long.
So for that reason, I'm raising my rating on BCX to a Buy here at $10.40 .
For further details see:
Equity CEF Performances: Updated Through Jan. 27