SUI - Equity LifeStyle Properties: Mixed Results With Paired Guidance Shares Fairly Valued
2023-10-17 07:16:42 ET
Summary
- Owner and operator of manufactured homes and other recreational properties, Equity LifeStyle Properties, just reported mixed Q3 results.
- While total revenues were in-line with expectations, ELS paired forward revenue growth expectations in their RV and marina segments.
- Prior to the release, shares were benefiting from a comparatively stronger performance than its related peers.
- At current levels, I continue to view shares as fairly valued in the current market environment.
Equity LifeStyle Properties (ELS) just reported mixed Q3 results with narrowed full-year guidance. In a prior update on the stock, I compared ELS with their similar-sized peer, Sun Communities (SUI). In the article, I highlighted the growing disparity in the share-price performance gap between the two companies, with SUI significantly trailing ELS, despite similar property-level performance.
ELS' Q3 results, which came in better-than-expected at the topline but slightly under on an overall basis, reaffirm my view that SUI is the more attractively priced competitor. While I believe favorable demand drivers and a stronger balance sheet in ELS provides a competitive tailwind, I continue to view shares as adequately priced in the current market environment.
ELS Q3 Results
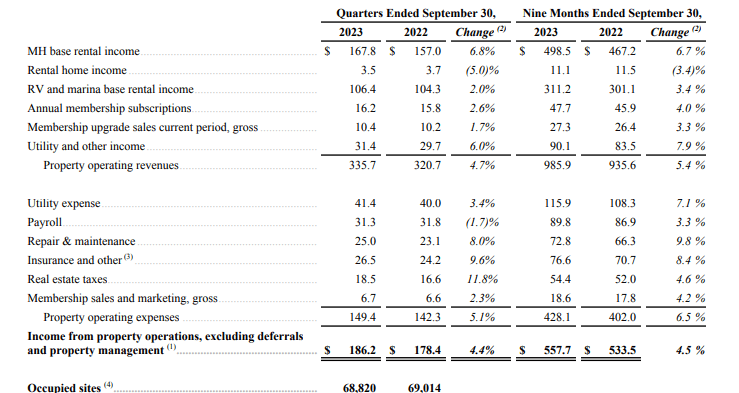
Reported funds from operations ("FFO") for Q3 landed at $0.71/share or 2.1% greater than the same period last year. Within core operations, base rental income in manufactured housing ("MH") grew 6.8%, while RV and marina base rental income increased 2%. Together, this contributed to a 4.7% increase in total core property revenues. A 5.1% increase in total property-level operating expenses, however, resulted in a total increase in their bottom-line core income of a scaled back 4.4%, albeit in-line with expectations.
Q3FY23 ELS Earnings Release - Quarterly Summary Of Core Operating Performance
At period end, core MH occupancy stood at 94.9% or 30 basis points ("bps") lower YOY but 30bps higher on a sequential basis. During the period, core MH occupancy increased by 42 sites, including a net gain of 225 homeowners. Additionally, turnover activity during the quarter enabled ELS to benefit from a 13% markup to market on average rents.
Within the balance sheet, ELS successfully addressed their debt balances scheduled to mature in 2023 and 2024. They did so via three new financings at a weighted average interest rate of approximately 5% and a term of about eight years. With the proceeds, ELS also relieved the remaining balance on their unsecured credit facility.
Market Reaction To ELS Q3 Results
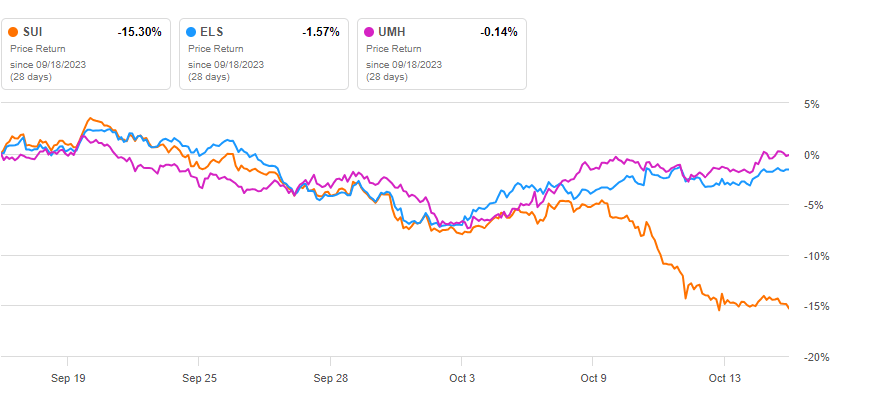
Shares in ELS were muted in extended trading immediately following the release. The limited action in the stock is consistent with how shares have performed over the month, down about 1.5%. The performance is in-line with UMH Properties (UMH) but starkly in contrast to similar-sized peer, SUI, which is down 15% in the same time span.
Seeking Alpha - 1-Mth Share Price Performance Of ELS Compared To Peers
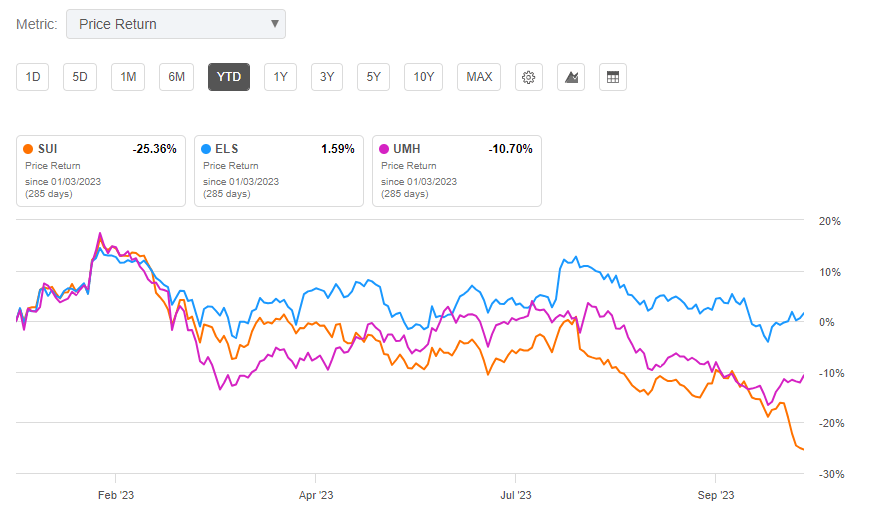
ELS is also outperforming on a YTD basis, up over 1.5% versus double-digit declines by both peers, with a more pronounced weakness from SUI.
Seeking Alpha - YTD Share Price Performance Of ELS Compared To Peers
At current trading levels, ELS trades at just under 23x forward normalized FFO. This compares to just 14.7x for SUI and 16.3x for UMH.
Outlook for ELS Stock After Earnings
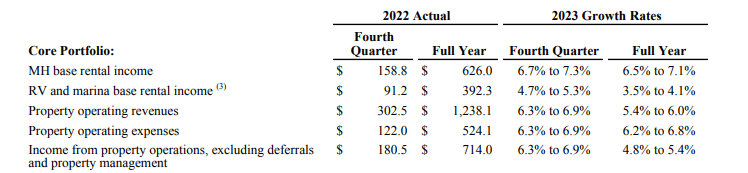
ELS' current value reflects results that came in mixed , with a beat at the top-line and a miss on consensus FFO. In addition, the management team also narrowed their forward estimates for FFO, with a raise to the bottom end of their range to $2.82/share from $2.80/share previously but a pullback at the top end to $2.88/share from $2.90/share provided previously. This proportional change effectively resulted in no revision to the midpoint of their guidance.
Growth rates in their core portfolio were revised more notably, particularly in their RV and marina units. Full-year growth is now expected to be 3.8%, a sizeable revision from the 4.6% growth projected previously. Estimated MH rental income was also revised down, but to a lesser extent at just the bottom and top ends of their range, leaving the forecasted midpoint the same at 6.8%.
Q3FY23 ELS Earnings Release - Summary Of Full-Year Guidance
Is ELS Stock A Buy, Sell, Or Hold?
Shares in ELS have fared relatively well over the past year. The broader S&P ( SPY ), for example, is down about 3.5% in the last three months. While ELS has underperformed in relation to the broader index, down about 4% during this same period, sector peers SUI and UMH are nursing losses of over 20% and 13%, respectively. The comparatively stronger share price performance may come as a reprieve for existing shareholders. And it may vindicate those bullish on the stock.
Favorable demand drivers and a competitively stronger balancer sheet can continue to work in ELS' favor, in my view. In company presentations , citing data provided by the U.S. Census borough, ELS notes that the U.S. population over the age of 55 will grow 16% from 2023 to 2038. This is significant since over 70% of ELS' manufactured housing portfolio, their primary driver of revenues, are age-restricted or have a resident base with an average age over 55.
ELS also maintains a lower levered balance sheet than SUI, with a net debt multiple in the low 5x range compared to SUI's 6.2x. SUI also has greater floating rate exposure, whereas ELS is free of the variable risks. And in the most recently completed quarter, ELS made strides in addressing near-term maturities by refinancing with debt at interest rates comparable to those locked in during a more accommodative rate environment. The cleaner debt profile should continue to provide ELS with the flexibility to carry out their capital priorities.
While I view these traits as positives for ELS, the company does carry a much higher trading multiple than SUI, despite having similar operating characteristics. ELS' forward guidance also underwhelmed, with a significant pullback in their forecasted results for their RV and marina business.
ELS can likely justify their current 23x multiple of FFO, but I couldn't reasonably get excited for new or further positioning in the stock, given the alternative available in SUI, the heavily beaten down peer trading near a new 52-week low and at a more reasonable valuation than ELS, at just 14.7x. For investors seeking upside potential, it may be best to hold on ELS in favor of reconsideration of the alternatives available elsewhere.
For further details see:
Equity LifeStyle Properties: Mixed Results With Paired Guidance, Shares Fairly Valued