SCD - ETG: Fully Covered 7.07% Yield And An Attractive Entry Price
2023-12-21 19:01:03 ET
Summary
- Eaton Vance Tax-Advantaged Global Dividend Income Fund offers investors the opportunity to earn income from international assets without sacrificing potential upside.
- The fund's current yield of 7.07% is lower than other fixed income and equity funds, making it less appealing to income-focused investors.
- The fund has underperformed the S&P 500 Index and the MSCI World Index recently, but has outperformed when considering distributions received by investors.
- The fund has a long-term history of underperformance, but income-focused investors may be willing to accept that in exchange for the higher yield of this fund.
- The fund appears to be fully covering its distributions, and it is trading at an enormous discount to net asset value.
The Eaton Vance Tax-Advantaged Global Dividend Income Fund ( ETG ) is a closed-end fund, or CEF, that can be employed by investors who are looking to earn a high level of income from the assets in their portfolios without sacrificing the upside potential that comes with investing in common equities. The fact that this fund invests its assets internationally could give it a marked advantage over a pure domestic stock fund in terms of income-generating ability due to the fact that international markets have long had higher dividend yields than the United States.
Unfortunately, this fund's yield is not especially high right now, as it only yields 7.07% at the current price. This is substantially lower than most fixed-income funds yield, and it is lower than even other common equity funds. For example, the LMP Capital and Income Fund Inc ( SCD ) currently yields 10.05% and invests in common equities just like the Eaton Vance Tax-Advantaged Global Dividend Income Fund. As such, this fund might not be as appealing to income-focused investors as some other funds. The fact that it can help improve an investor's global exposure could be helpful though, as most American investors have substantial exposure to the United States and insufficient global exposure.
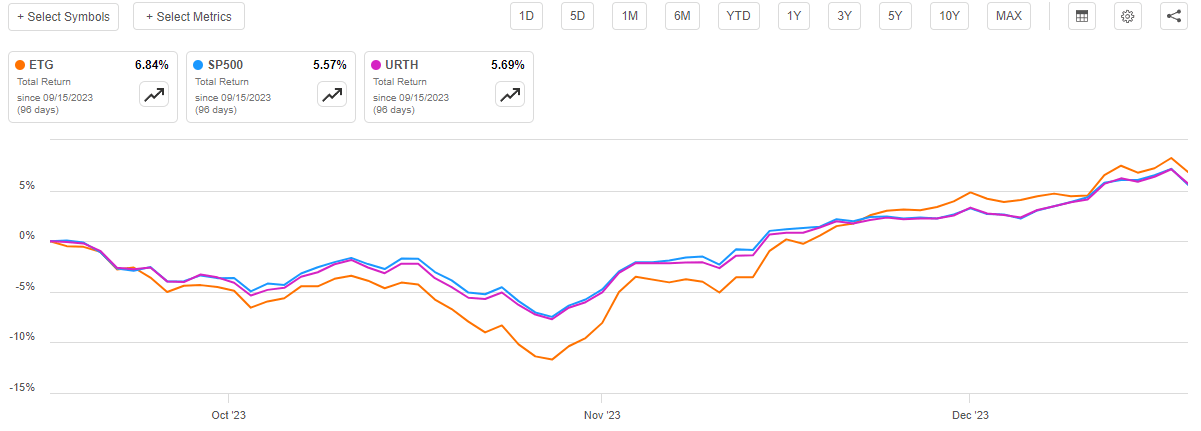
As regular readers may recall, we last discussed this fund back in September. That was obviously a very different market environment than today's. In September, investors were generally a bit down on the Federal Reserve's "higher for longer" mantra and were selling off both stocks and bonds. During the period, yields were rising, and stocks were accepting much lower valuations than we have seen during previous periods. Today, we have exactly the opposite market environment as investors are giddy about the prospect of interest rate cuts next year and are bidding up asset prices in an attempt to front-run the Federal Reserve. We can therefore expect that this fund will have experienced some gains since the last time that we discussed it. That is indeed the case, as shares of the Eaton Vance Tax-Advantaged Global Dividend Income Fund are up 4.81% since September 15, 2023:
Unfortunately, we can see that the price performance of this fund has been worse than that of the S&P 500 Index ( SP500 ) and the iShares MSCI World ETF ( URTH ). It only very slightly underperformed the MSCI World Index, though. That is not especially surprising, since the MSCI World Index has been consistently underperforming American assets over most of the past decade. We will see that later in this article.
As is the case with most closed-end funds, the Eaton Vance Tax-Advantaged Global Dividend Income Fund delivers an outsized proportion of its total returns through direct payments made to the shareholders. As such, the price performance can give a somewhat inaccurate view of the actual performance that investors in the fund experienced. In order to correct this problem, we need to include the distributions that investors received in the return analysis. When we do that, we see that this fund handily outperformed both the S&P 500 Index and the MSCI World Index over the past three months:
This is something that could certainly prove to be appealing to potential investors. However, it is important to always keep in mind that the past performance of a fund is no guarantee of future results. Thus, let us take a closer look at this fund and see if a purchase could make sense today.
About The Fund
According to the fund's website , the Eaton Vance Tax-Advantaged Global Dividend Income Fund has the primary objective of providing its investors with a high level of after-tax total return. This makes sense when we consider the fund's name. The presence of the word "dividend" in the fund's name strongly suggests that this fund will attempt to achieve its investment objectives by owning common equities and similar securities. CEF Connect confirms this, as it states that 84.99% of the fund's assets are currently invested in common equities. It also says that the fund has much smaller weightings to preferred stocks, bonds, and other things:
CEF Connect
When we consider this, we realize that the pursuit of total return makes a great deal of sense. This is because common equities are by their very nature a total return vehicle. After all, investors generally purchase common equities in order to receive an income through dividends paid by these securities as well as benefit from the capital gains that typically accompany the growth and prosperity of the issuing company. The remainder of the securities in this portfolio primarily deliver their investment returns to their owners via direct payments. After all, preferred stock and bonds have no net capital gains over their lifetimes. Thus, the fund also invests in income-producing securities but as income is a component of total return, the overall objective still works.
As the name of the fund suggests, the Eaton Vance Tax-Advantaged Global Dividend Income Fund invests in securities from issuers all over the world. It claims to have a preference for investing in dividend-paying securities. Specifically, the fund's fact sheet states in its first bullet point that:
The Fund invests primarily in global dividend-paying common and preferred stocks and seeks to distribute a high level of dividend income that qualifies for favorable federal income tax treatment.
The fact sheet then goes on to claim that the fund favors value stocks:
The Fund employs a value investment style and seeks to invest in dividend-paying common stocks that have the potential for meaningful dividend growth.
However, as is the case with many Eaton Vance funds, there are a few stocks occupying fairly large weightings in the fund that do not meet these two qualifications. Here are the largest positions in the fund:
Fund Fact Sheet
Microsoft Corporation ( MSFT ), Alphabet Inc. ( GOOG ), (GOOGL) Amazon.com, Inc. ( AMZN ), and Apple Inc. ( AAPL ) are not dividend-paying value stocks. Indeed, Alphabet and Amazon.com do not even pay dividends. Microsoft and Apple have such meager yields that they may as well not pay a dividend at all. They are not the only companies on this list that do not really make sense as dividend plays, either. Here are the dividend yields of all ten of these companies:
| Company |
| Dividend Yield |
| Microsoft Corp. |
| 0.81% |
| Alphabet |
| N/A |
| Amazon.com |
| N/A |
| Apple Inc. |
| 0.49% |
| Nestlé S.A. ( NSRGY ) |
| 2.98% |
| ConocoPhillips ( COP ) |
| 1.99% |
| Adobe Inc. (ABDE) |
| N/A |
| CDW Corporation ( CDW ) |
| 1.12% |
| EOG Resources, Inc. ( EOG ) |
| 3.00% |
| Zoetis Inc. ( ZTS ) |
| 0.89% |
As of the time of writing, the S&P 500 Index yields 1.42%. The only stocks on this list that beat that yield are Nestle SA, ConocoPhillips, and EOG Resources. Thus, if the fund were truly pursuing a value investing strategy based on investing in dividend-paying common equities, then it is failing horribly. The majority of the stocks on this list would not be included in a portfolio following such a strategy.
With that said, the fund states that it is benchmarking itself against the MSCI World Index. If we consider this, then the fund's holdings do make more sense, as quite a few of these stocks do have fairly large weightings in that index:
| Company |
| % of MSCI World Index |
| Apple Inc. |
| 5.12% |
| Microsoft Corp. |
| 4.40% |
| Amazon.com |
| 2.37% |
| Alphabet - Class C |
| 1.22% |
| Nestle SA |
| 0.50% |
| ConocoPhillips |
| 0.24% |
| Adobe Inc. |
| 0.46% |
| CDW Corp |
| 0.05% |
| EOG Resources |
| 0.12% |
| Zoetis |
| 0.15% |
Arguably, the fund is a bit more value-oriented than the index. We can see that the major technology companies on this list actually have a lower weighting in the fund than they do in the index, with the exception of Amazon.com and Alphabet. However, we do not see other technology companies that account for large weightings in the index. For example, we do not see Meta Platforms, Inc. ( META ) or NVIDIA Corporation ( NVDA ) among the fund's largest holdings at all despite these two companies being among the largest constituents of the index.
As I pointed out in a recent article , an outsized proportion of the total returns of both the S&P 500 Index and the MSCI World Index over the past decade has been due to a very small handful of technology stocks. Apple, Microsoft, Amazon.com, and Alphabet are all among that small handful of stocks. Thus, it is quite possible that the fund includes them in this portfolio in order to ensure that its performance does not trail the broader market indices by too much. After all, it is not exactly a secret that a value investing strategy has underperformed the market ever since the Federal Reserve started quantitative easing following the Great Recession in 2009. There may be some investors that avoid a fund that underperforms the market by too much, even though it may be running a strategy that they like, so the fund's managers may feel that they have to include these companies in the fund. This is not exactly an ideal situation, but the market has exhibited very odd behaviors for most of the past fifteen years, so it is probably better to just go with the flow rather than try to fight the dynamics.
One thing that we immediately notice by looking at the fund's largest holdings is that a very high percentage of them are technology companies. In fact, six of the ten companies are technology firms. This could lead someone to immediately conclude that a high percentage of the fund's assets are invested in this sector. However, that is not exactly the case. In fact, only 20.18% of the fund's assets are invested in the Information Technology sector. That is less than the weight of this sector in the MSCI World Index:
Fund Fact Sheet
In fact, we can see that the only sectors that are overweight relative to the index are Financials and Industrials. This actually works pretty well with the fund's stated focus on investing in dividend-paying value stocks. After all, most Industrial sector companies are value stocks that pay out larger dividends than the average company. The Financials sector has long been known as a rich source of dividend income. Thus, any fund that is focused on dividend-paying value stocks will probably overweight these sectors at the expense of the extremely low-yielding Information Technology sector. This is exactly what we see here. Thus, the fund's current allocation does make a certain amount of sense, although it might make sense to reduce the technology exposure a bit more to boost Energy as some energy sectors (especially shale companies) have very strong cash flows and high dividend yields. We discussed one of these companies in Energy Profits in Dividends earlier today.
One thing that eagle-eyed investors will likely notice is that quite a few of the companies that constitute the largest holdings in this fund have changed since the last time that we discussed it. In particular, we see that The Coca-Cola Company ( KO ) and GXO Logistics, Inc. ( GXO ) have both been removed from the largest positions in the fund. In their place, we have CDW Corp. and EOG Resources. In addition, we see that the weightings of several of the stocks on the largest positions list have changed. This latter change could have been caused by one company outperforming another in the market, though, and is not necessarily a sign that the fund's management actively tried to make a change to the portfolio.
We can clearly see that the fund is engaging in a certain amount of trading activity. This conclusion is reinforced by the fact that the fund has a 59.00% annual turnover. This is not an excessively high annual turnover for an actively managed equity closed-end fund, but it is still much higher than an index fund might possess. This is important because it costs money to trade stocks or other assets. This trading activity costs money, which results in a drag on the fund's performance. After all, the fund's management needs to generate sufficient returns to cover these additional expenses and still satisfy the investors. There are very few management teams that achieve this goal on a consistent basis, so this is one reason why many funds underperform their benchmark indices.
Unfortunately, the Eaton Vance Tax-Advantaged Global Dividend Income Fund is no exception to this underperformance rule. Over the past ten years, the fund's total return was 114.40% when we included the impact of the fund's distributions on its returns. This was a worse performance than both the S&P 500 Index and the MSCI World Index managed to deliver over the same period:
Thus, investors who are committed to achieving the highest possible total return may want to eschew this fund in favor of just buying the indices. However, the Eaton Vance Tax-Advantaged Global Dividend Income Fund does have a higher yield than either of the indices so investors who desire a higher level of income may opt to purchase this fund even though it has historically produced lower returns.
Leverage
As is the case with most closed-end funds, the Eaton Vance Tax-Advantaged Global Dividend Income Fund employs leverage as a method of boosting the total return of its portfolio. I explained how this works in my previous article on this fund:
In short, the fund is borrowing money and then using that borrowed money to purchase domestic and foreign common and preferred stocks. As long as the purchased assets can provide a higher total return than the interest rate that the fund has to pay on the borrowed funds, the strategy works pretty well to boost the effective yield of the portfolio. Since this fund is capable of borrowing money at institutional rates, which are considerably lower than retail rates, that will usually be the case.
However, the use of debt in this fashion is a double-edged sword. This is because leverage boosts both gains and losses. As such, we want to ensure that the fund does not employ too much leverage since that would expose us to too much risk. I do not usually like to see a fund's leverage exceed a third as a percentage of its assets for this reason.
As of the time of writing, the Eaton Vance Tax-Advantaged Global Dividend Income Fund has leveraged assets comprising 20.05% of the fund's total assets. This is obviously well below the one-third of assets maximum that we would typically prefer. The fund's current leverage is also somewhat less than the 20.97% that it had the last time that we discussed it. This is a positive sign, and it is caused by the fact that the fund's net asset value per share has increased since September 15, 2023 (the date of the previous article's publication):
As we can clearly see, the fund's net asset value per share is up 5.70% since the last time that we discussed it. This naturally means that the fund's leverage represents a smaller percentage of the portfolio assuming that the fund did not borrow any more money. After all, the total portfolio is now larger than it was the last time that we discussed it.
Overall, there is no real reason to worry about the fund's leverage today. The current level represents a reasonable balance between risk and reward.
Distribution Analysis
As mentioned earlier in this article, the primary objective of the Eaton Vance Tax-Advantaged Global Dividend Income Fund is to provide its investors with a high level of total return. In pursuance of this objective, it purchases stocks from issuers that are located all over the world. Despite the fact that many of its largest positions have fairly low dividend yields, it does seem that the fund's managers prefer to invest in dividend-paying securities rather than ones that do not pay dividends. The fund collects these dividends and combines them with any capital gains that it manages to realize from the sale of appreciated common stocks. The fund also employs leverage to allow it to control more securities than it could with just its own equity, which should generally boost both the dividend income and the capital gains that it is able to realize. The fund then pays all of this money out to the shareholders, net of its expenses. When we consider how large realized capital gains can be, we would probably expect that this strategy will allow this fund's shares to boast a very high distribution yield.
That is certainly the case, as the Eaton Vance Tax-Advantaged Global Dividend Income Fund pays a monthly distribution of $0.1001 per share ($1.2012 per share annually), which gives it a 7.07% yield at the current price. As stated earlier, this is a substantially higher yield than most of the main common equity indices possess, but it cannot really compete with the best fixed-income funds right now. For the most part, the fund has been consistent with its distribution over the years but it has certainly not been perfect:
As we can see, the fund did boost its distribution during the post-pandemic bubble when there was an enormous amount of money sloshing through the economy, and the price of everything was surging. The fund had to cut its distribution once the Federal Reserve started raising rates and tightening monetary policy, though. That makes sense, as most things handed losses to investors in 2022 so it is only prudent that the fund cut its distribution in order to preserve the net asset value. The fund's current distribution is a bit less than the $0.1025 per share that it had prior to the pandemic so the current level is the lowest level that the fund has had in over a decade. However, we can still see that it was pretty consistent with respect to the distribution in the years following the Great Recession. Thus, those investors who are seeking a safe source of income that can be used to pay their bills or finance their lifestyles may be reasonably satisfied.
As a few people have commented in other recent articles, the current inflation plaguing the economy has reduced the purchasing power of the distributions of any fund that pays a static distribution. This suggests that we want to focus our buying attention on those closed-end funds that have consistently grown their distributions over time. However, the only funds that have done that over the past three or four years are the ones that invest heavily in floating-rate debt securities. Thus, the best option is to use some of the distribution to purchase more shares of the fund, as that would result in a steady increase in the distribution that you receive.
As I have pointed out in numerous previous articles, the fund's history is not necessarily the most important thing for anyone who is considering purchasing shares of the fund today. This is because a buyer today would receive the current distribution at the current yield. This individual will not be adversely affected by any action that the fund has taken in the past. As such, let us have a look at the fund's finances and see how well it can sustain its current payout.
Fortunately, we have a very recent document that we can consult for the purpose of our analysis. As of the time of writing, the fund's most recent financial report corresponds to the full-year period that ended on October 31, 2023. This is a much more recent report than the one that we had available to us the last time that we discussed this fund. This is quite nice, as it should cover the period of market weakness that occurred over the summer of 2023. This period saw the price of most common stocks around the world decline as the market began to accept the Federal Reserve's stance that interest rates would not be dropping back to bubble levels anytime soon. The fund probably took some losses during that time period. This report should give us an idea of the magnitude of these losses, in contrast to the semi-annual report which was the newest report that was available the last time that we discussed this fund.
During the full-year period, the Eaton Vance Tax-Advantaged Global Dividend Income Fund received $70,037,393 in dividends and $10,382,221 in interest from the assets in its portfolio. When we combine this with a small amount of income that was received from other sources, the fund had a total investment income of $100,128,743 during the period. The fund paid its expenses out of this amount, which left it with $63,825,641 available for shareholders. This was unfortunately not enough to cover the distributions that the fund paid out during the period. Over the full-year period, the fund paid distributions totaling $91,842,498 so it distributed more than its net investment income. At first glance, this might be concerning as the fund is not generating sufficient investment income to cover all of the payouts that are being made to its shareholders.
However, there are other methods through which a fund can obtain the money that it requires to cover the distribution. For example, the Eaton Vance Tax-Advantaged Global Dividend Income Fund invests primarily in common stocks and these assets deliver a significant percentage of their total returns in the form of capital gains. The fund might be able to realize some capital gains in a friendly market and distribute those to the shareholders. Realized capital gains are not considered to be investment income for accounting or tax purposes but they clearly represent money coming into the fund that can be paid out to the shareholders. The fund fortunately had some success in this area over the full-year period. It reported net realized gains of $26,449,417 and had another $61,866,264 net unrealized gains.
Overall, the fund's net assets increased by $60,298,824 after accounting for all inflows and outflows during the period. This is a very positive sign, as it indicates that the fund did manage to fully cover its distributions over the period. If the market continues to deliver a performance that is similar to what we have seen over the last year, we should not have to worry about the fund's ability to sustain its distributions.
Valuation
As of December 20, 2023 (the most recent date for which data is currently available), the Eaton Vance Tax-Advantaged Global Dividend Income Fund has a net asset value of $19.30 per share. However, the shares only trade for $17.08 each. This gives the fund's shares an 11.50% discount on net asset value. This is in line with the 11.22% discount that the fund's shares have averaged over the past month. Thus, the current price looks like a reasonable entry point if you wish to add this fund to your portfolio.
Conclusion
In conclusion, the Eaton Vance Tax-Advantaged Global Dividend Income Fund looks like a reasonable way for an investor to obtain a high level of income without sacrificing the upside potential of investing in common stocks. The fund's current yield is unfortunately a bit lower than that of many other closed-end funds, but it does appear that it can sustain the payout and it trades at an enormous discount on the net asset value.
Unfortunately, Eaton Vance Tax-Advantaged Global Dividend Income Fund has a history of underperforming both the S&P 500 Index and the MSCI World Index, so it seems that anyone who wants this fund will need to sacrifice a bit of return in order to obtain a higher level of income.
For further details see:
ETG: Fully Covered 7.07% Yield And An Attractive Entry Price