ETD - Ethan Allen: Digital Marketing Fueled Growth
Summary
- Strong digital marketing presence to fuel revenue growth.
- Multiple walk-in stores across 44 states attract customers with a free interior design of their choice.
- Expanding client base.
- Beat earnings for the fourth time in a row.
I see great potential in Ethan Allen (ETD) for various reasons. Firstly, they have some superbly designed products. They also have a variety of styles and they can design your home interior for you. They also have a plethora of stores across 44 states.
Physical presence is essential, I believe in this sector, especially for the spending capacity the company is aiming for. But along with all that, they are showing a massive increase in numbers.
The numbers I'm talking about are internet traffic, revenue, and earnings. The last two are easy to understand. I'm guessing that the internet traffic might not seem so obvious. We'll look at that in more detail below as well as some fundamentals and technicals.
Digital Marketing
In my opinion, digital marketing is a fundamental aspect of marketing in just about any company. But even more so when the company sells a product with a widespread client base. Without wanting to create a crash course in digital marketing, I believe it's important to understand where ETD's growth is likely going to come from.
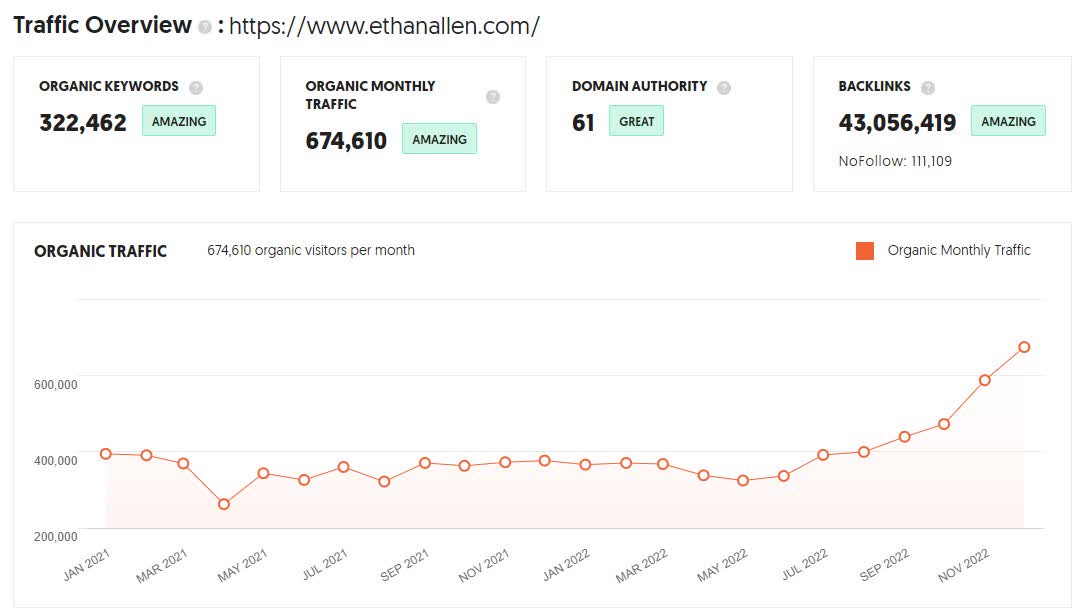
So, let's take a look at some basic SEO metrics. I used an SEO app to check some basic statistics on ETD's website. I found that of the 674 thousand monthly visits to the company's internet domain, 209 thousand monthly visits were to their landing page. Many of the other static pages were also accountable for large numbers of visits.
This indicates to me that most of the traffic they are generating is due to the fact they are a well-known brand. A metric that confirms this is the number of times their landing page is shared on social media.
The SEO app I use sees over 211 thousand shares per month on social media such as Facebook or Instagram.
The chart above shows the traffic to the domain owned by Ethan Allen. We can see how there is a sharp climb in visits from May 2022. Also important to note is the number of backlinks, these are other websites, blogs, or articles that have a link back to Ethan Allen.
In total, Ethan Allen's website has over 41 million backlinks, or mentions, from other places on the web. The domain authority is also quite high which will also help in driving traffic to their website. There are no set numbers to define what is good, bad, or average.
Mainly because it's always relative, to the sector, the website's goals, and so on. But these numbers show very strong growth. In May 2022, their website had just over 324 thousand visits. While by December 2022, they saw over 674 thousand visits.
I can't determine how many website visits turn into new customers, or create revenue in terms of services and items sold. However, there can be no doubt the company is growing and quickly. Web traffic must eventually translate into new customers, or customers returning for new items or services.
Ethan Allen Fundamentals
The company fundamentals that look at show growing numbers over the past 4 years except for the dip in 2020 due to the pandemic. The financial stability of the company is sound with a liabilities/assets ratio of 0.388. That's a low number in absolute terms and also relative to its closest peers that have an average ratio of 0.622.
Seeking Alpha
Revenue and earnings have been on the rise since they dipped in 2020. EBITDA jumped 239.5% in 2021 and by 54.86% in 2022. Revenues have shown smaller percentage increases which indicates the company is keeping more of its profits.
Another aspect I look at for any stock is valuation. ETD has an EV/EBITDA ratio of 4.05x, which is low in absolute terms and 59.44% lower than its sector average.
Industry Trend
Given the price range of most of Ethan Allen's products, I would say their clients are middle class and higher. So, I set about trying to understand how middle-class income households may be expanding or contracting.
However, I found that there are several ways to define the middle class. This complicates matters, which definition do you choose? If you follow Pew Research's definition of middle class, this section of society has been shrinking over the past 5 decades.
Although they see upper-income households as increasing. Without a clear definition of middle class. I decided to look at average income.
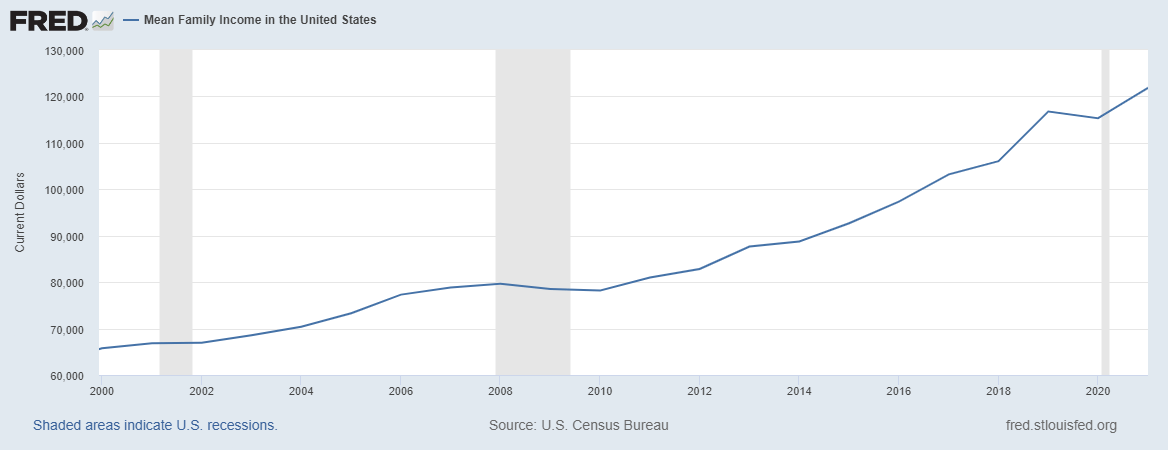
The graph above shows the mean household income in nominal dollars since 2000. We can see how it has increased from $65,773 in 2000, to $121,840 in 2021, That's an increase of 85.24%. True that I haven't taken into account inflation.
But my point is that the average household income has increased considerably. How many families are making it into higher income brackets, I wasn't able to determine. As mentioned before it depends on where you place the goalposts.
However, society is getting more affluent and when incomes increase, so too does spending power. If the client base isn't expanding there certainly seems like there is plenty of spending capacity at the level needed for Ethan Allen to grow.
Technical View
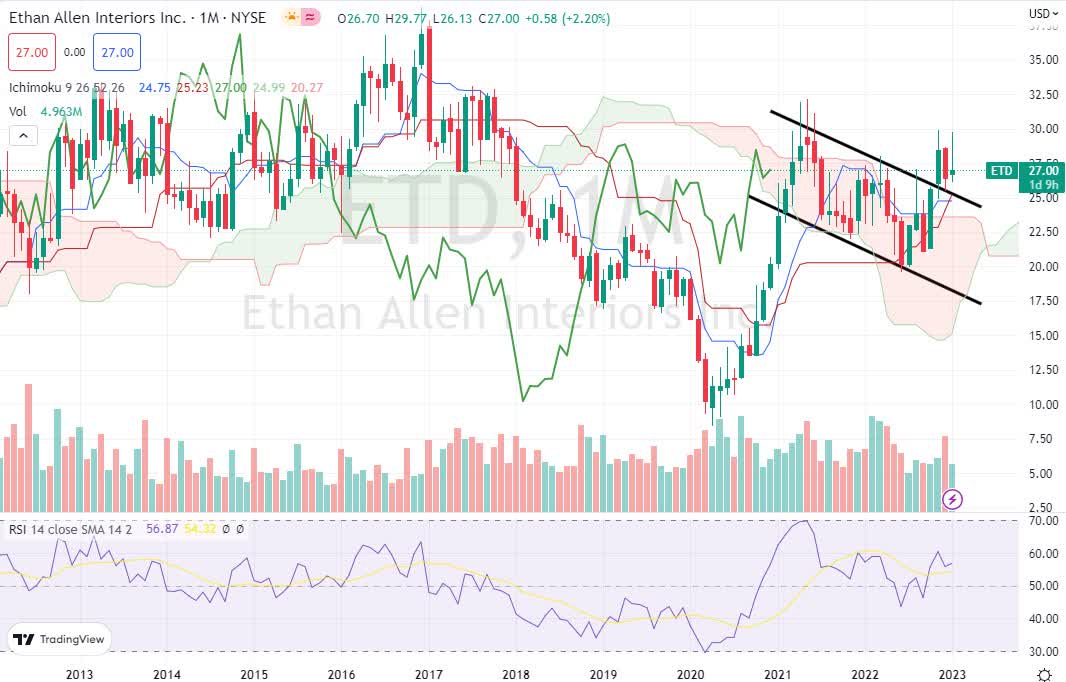
The monthly chart below has started showing signs of bullish momentum. Technically price action is still below the Ichimoku cloud. However, the last 3 candles have printed above the cloud. The moving averages turned bullish several months ago. And I would expect them to return to a bullish indication soon.
The forward cloud is green indicating more upward price action. The only thing lacking is the lagging line (green line) which is still in the cloud. Once that is clear, we have a bullish setup on the Ichimoku system.
Also, note that a downward-sloping pennant formed from March 21 to October 2022. The November 2022 candle saw price action break that pattern to the upside, an indication of higher prices. The RSI is also showing bullish momentum as its slope is rising and above the moving average and the 50 level.
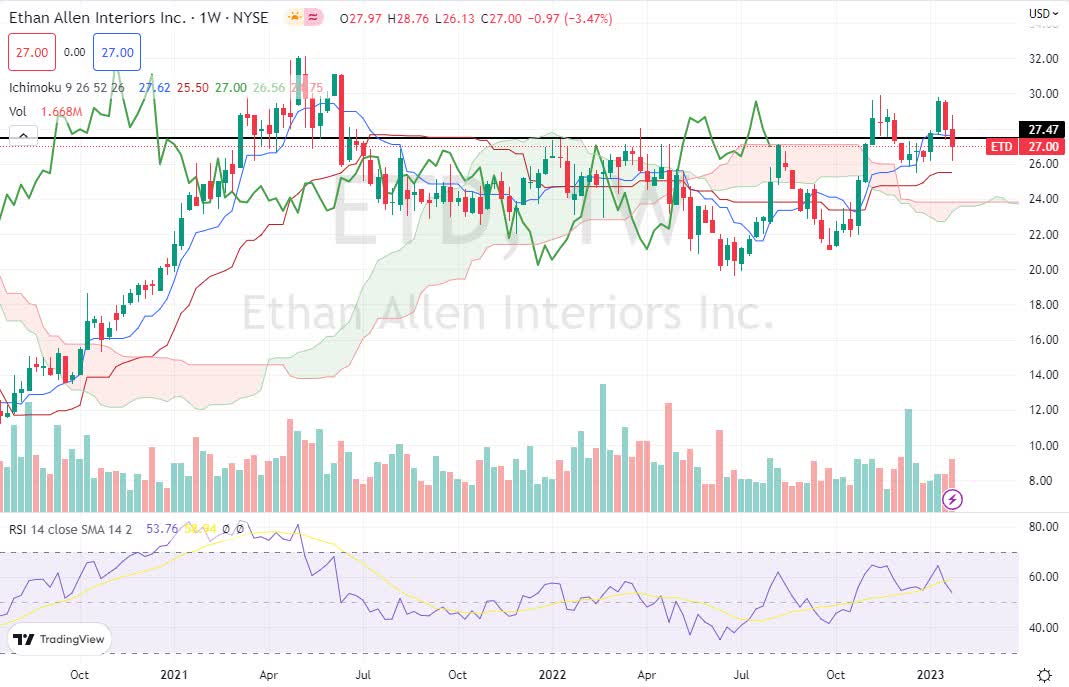
The weekly chart below shows the share prices for ETD have been trading in a wide range since its recent high in May 2021. The Ichimoku system is showing bullish momentum as price is above the cloud and the lagging line just closed the week on top of the cloud.
However, the last candle closed the week on the support and resistance zone that has been created by various touches going back to March 2021. The good thing is further downside movement is supported by the cloud at the $24 zone.
The RSI is above 50 but has pierced below the 50 level. I would expect any further downward momentum to find support on the cloud, and any dips below it, I would consider as entry opportunities.
Conclusion
I consider ETF's current stock price a low valuation compared to its peers and in absolute terms. An ever-growing presence in the digital space and possibly an expanding client base. In my opinion, this stock is a strong buy for the potential it has in the industry, and for the quality of its products.
Technically share prices are still recovering from the last dip in 2020, however, I would say the market will drive this stock higher as I'm sure they keep beating EPS expectations just like they did over the past 4 quarters.
For further details see:
Ethan Allen: Digital Marketing Fueled Growth