CGO - ETO: Outperforming The Market And Good Peer Comps
2025-04-03 04:28:47 ET
Summary
- The Eaton Vance Tax-Advantaged Global Dividend Opportunities Fund offers high income by investing in global dividend-paying equities, providing a better alternative to fixed-income securities.
- The fund's global focus allows it to exploit international profit opportunities, potentially outperforming U.S.-centric funds, especially in volatile domestic markets.
- The fund does not appear to be doing as good of a job at taking advantage of foreign market strength, but it is still outperforming domestic markets.
- Despite recent underperformance, the fund's higher yield and lower expense ratio compared to peers make it attractive for income-focused investors.
- The fund's current valuation at a discount to its net asset value and historical averages suggests a potentially good entry point for investors.
The Eaton Vance Tax-Advantaged Global Dividend Opportunities Fund ( ETO ) is a closed-end fund that income-seeking investors may choose to purchase in an attempt to earn a very high level of income from the assets that are already in their portfolios. This is a basic reason for purchasing almost any closed-end fund, but this one has a few reasons why investors might prefer it over some of the other ones in the market. One of these is that, as the name of the fund implies, the Eaton Vance Tax-Advantaged Global Dividend Opportunities Fund invests in dividend-paying common equities that are located all over the world. This alone makes this fund somewhat better than most income-focused funds in the market, due at least in part to the fact that the majority of funds that seek to provide investors with income do so by investing in fixed-income securities.
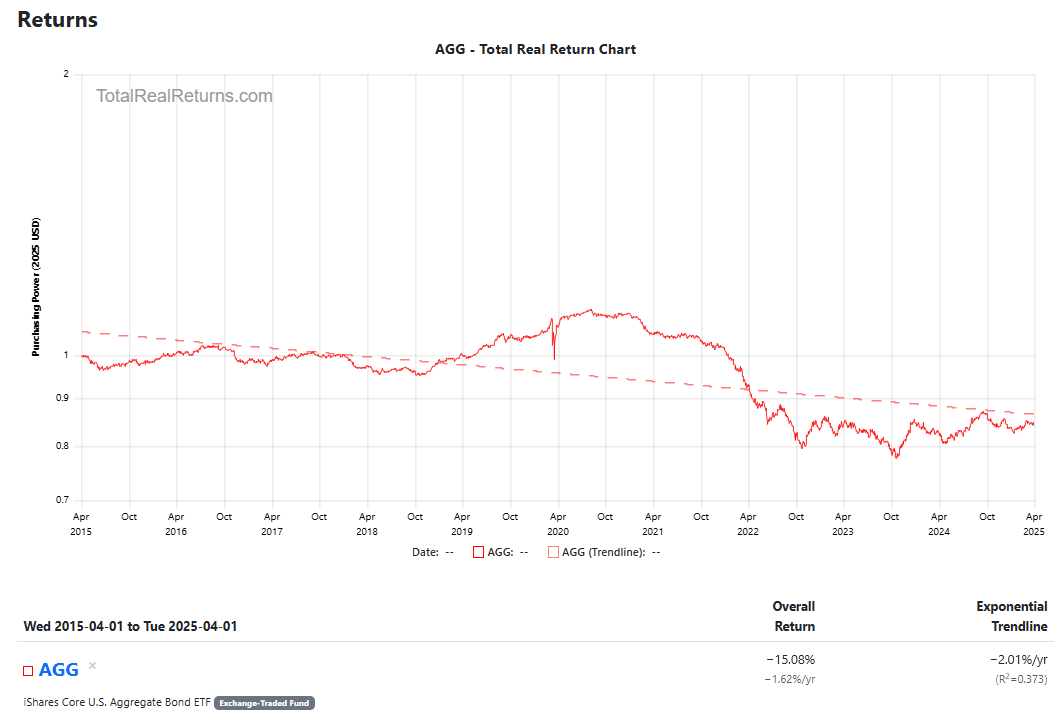
In a few recent articles, I showed that bonds have generally failed in their primary function as a store of value over the past ten years. We can see this in the simple fact that domestic investment-grade bonds have delivered a negative real return over the past decade:
This chart shows the return of the Bloomberg U.S. Aggregate Bond Index, which tracks the price of domestic investment-grade bonds, over the past ten years (April 1, 2015 through today). However, unlike most performance charts, this one assumes that an investor took all of the distributions and coupons paid out by the index fund and used them to purchase additional shares of the index fund on the distribution date. In addition, the chart is also adjusted for inflation using the Consumer Price Index for all Urban Consumers. These assumptions result in the index delivering a negative 15.08% return over the ten-year period. If we add the domestic junk bond index ( JNK ) to this chart and make the same assumptions, we get this:
ETO: Outperforming The Market And Good Peer Comps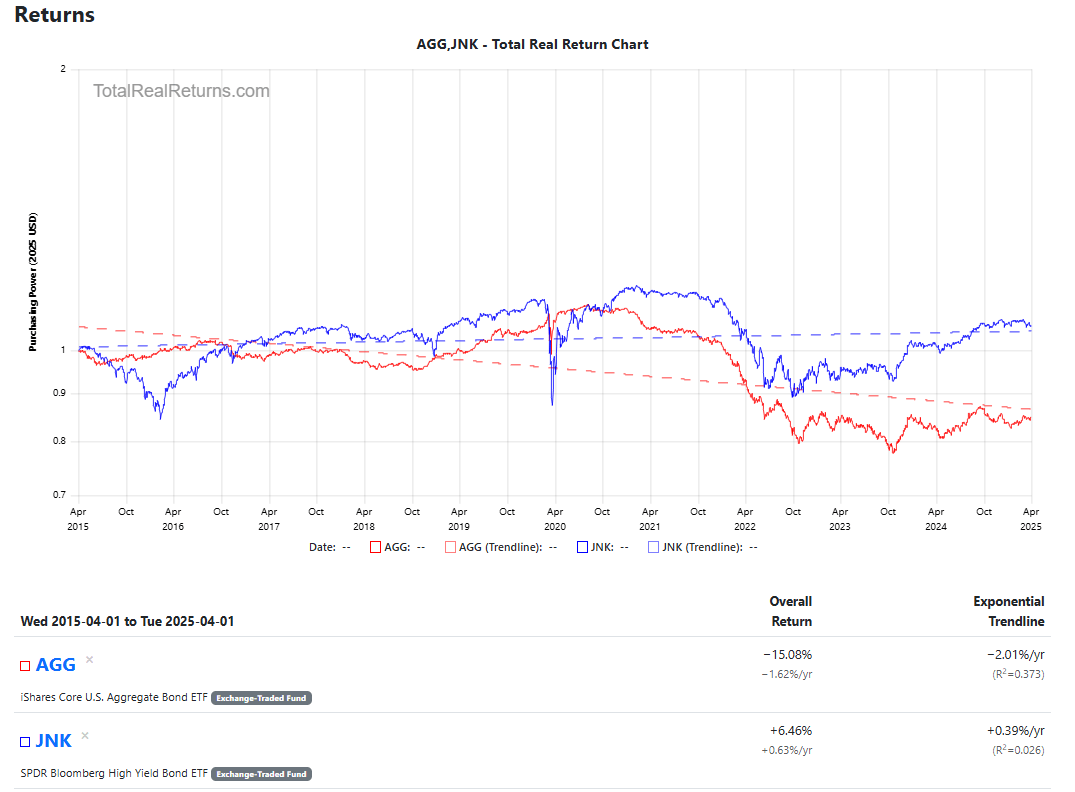