EUSA - EUSA: Equal Weight Midcap Equities Treading Water
2023-09-26 20:49:51 ET
Summary
- The iShares MSCI USA Equal Weighted ETF is an equity exchange-traded fund that tracks the MSCI USA Equal Weighted Index.
- The index is an equal-weight take on large and mid-cap segments of the US market.
- EUSA has failed to post a substantial performance this year, with a total return of only 4.9%.
- Historically, the fund has had a performance in line with the much better-known Invesco S&P 500 Equal Weight ETF.
Thesis
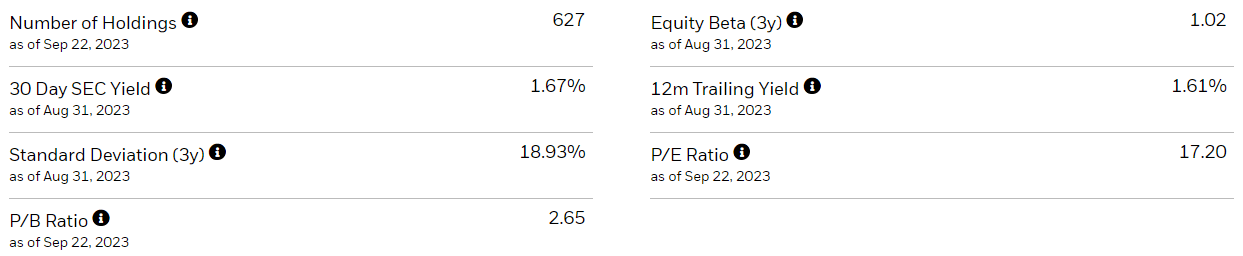
The iShares MSCI USA Equal Weighted ETF ( EUSA ) is an equity exchange-traded fund. The vehicle contains 627 names and is built to replicate the MSCI USA Equal Weighted Index . The index is an equal-weight take on large- and mid-cap segments of the US market and is discussed in detail in a section below. As an equal weight index, MSCI USA EW assigns each of its components the same weight upon rebalancing.
The fund rebalances quarterly, mirroring the index, and represents an accurate cross-sectional picture of the U.S. stock market as a whole. Similarly to its S&P 500 equal weight peer Invesco S&P 500 Equal Weight ETF ( RSP ), EUSA has failed to post a substantial performance this year:
The ETF has a standard deviation of 18%, indicating volatility in line with the S&P 500, but has failed to produce a substantial positive return in 2023. It is interesting to note that on a total return basis the short-dated Treasuries fund iShares 0-3 Month Treasury Bond ETF ( SGOV ) is about to overtake EUSA performance-wise.
While the S&P 500 has been propelled higher by the ' Magnificent 7 ' this year, the rest of the stock market has had very muted returns. This performance is the reflection of the true, wider equity market. Mid-caps and smaller caps are those companies that have been affected to a larger degree by the rising cost of funds and the percolation of higher rates in the economy. While global mega caps have sported iron-clad balance sheets for a couple of years now, the story is very different as one moves towards smaller companies.
The main risk driver for this fund is mid-cap equities in the U.S. The valuation metrics for this fund are stretched at the moment, with the fund P/E ratio sitting at 17.2x, all while long-term yields are aggressively moving higher:
10-Year Rates (Creative Planning)
10-year yields have moved to levels unseen since October 2007, and higher rates translate into a higher discount rate for equities, thus lower prices. The fundamentals do not look encouraging for EUSA, and despite the relentless talk that some market participants engage in respect to a new bull market, we disagree.
We feel higher rates and tighter lending conditions have been very slow to percolate down to the real economy, but are now starting to take their toll on credit conditions, mortgage rates, credit appetite, and discount ratios. We have just seen how SGOV is about to outperform EUSA for the year. There is no reason to take risk via an equity fund with an 18% standard deviation when you can get over 5% annually with SGOV with a 0.5% standard deviation.
This bond/equity deviation is going to become even more pronounced as the year progresses, with no AI revolution to prop all names that are present in an equal-weight fund like EUSA.
MSCI USA Equal Weighted Index
As per its literature:
The MSCI USA Equal Weighted Index represents an alternative weighting scheme to its market cap weighted parent index, the MSCI USA Index. The index includes the same constituents as its parent (large and mid cap securities from US markets). However, at each quarterly rebalance date, all index constituents are weighted equally, effectively removing the influence of each constituent’s current price (high or low). Between rebalances, index constituent weightings will fluctuate due to price performance.
It is important to note that the index rebalances quarterly, and immediately after rebalancing each of the individual names in the fund will have the same weight. A retail investor currently looking at the fund holdings (outlined below) will see some discrepancies due to the mark-to-market moves for each stock between the rebalancing dates. As a particular name gains in value intra-period, it will have a higher weighting until the rebalancing date.
The Index has Information Technology, Industrials, and Financials as its top sectoral components:
Sectors (Index Website)
Analytics
AUM: $0.52 billion
Sharpe Ratio: 0.49 (3Y)
Std. Deviation: 18.9 (3Y)
Yield: 1.6%
Z-stat: n/a
Leverage Ratio: 0%
Composition: Equal Weight MSCI USA Index
Holdings
The fund falls in the Mid Cap-Blended Morningstar portfolio category:
Morningstar Allocation Box (Morningstar)
Due to its equal weight build, the fund has a mid-cap tilt when compared to other names. The fund contains over 600 names in its portfolio:
We can notice from its analytics that the ETF has a standard deviation very similar to the S&P 500 and a high P/E Ratio of 17.2.
Its top names are all under 0.3% of the fund holdings:
Top Holdings (Fund Fact Sheet)
As a reminder, the index and the ETF rebalance quarterly, thus any difference in individual name weighting is going to be smoothed out on the rebalance date.
Performance
The fund has mirrored to a large extent the performance of its peer Invesco S&P 500 Equal Weight ETF in 2023:
Long term, EUSA closely matches the RSP performance:
Outside the 2022/2023 period, the two funds have almost identical performances.
Conclusion
EUSA is an equities ETF. The fund represents an equal-weighted take on the largest 627 names in the market and is similar to the better-known fund RSP. Historically the two have had a very strong price correlation, with only a slight divergence as of late since EUSA is more tilted towards mid-caps.
The fund rebalances every quarter and represents a diversified take on the U.S. stock market. The vehicle has a standard deviation in line with the S&P 500 at 18%, but has failed to produce meaningful results in 2023 due to the absence of an overweight position in the 'Magnificent 7'. With a low total return this year, high standard deviation, and high P/E ratio, the ETF is not a compelling choice at this stage of the economic cycle.
We are of the opinion that we will see another market correction once higher rates truly percolate through the economy, and that an equal take on the U.S. equity market which is tilted towards mid-caps, will not be able to produce significant results until the Fed starts cutting rates. If you already Hold the name, continue to do so for an equity portfolio allocation, while new capital looking to enter equities should follow the trend and choose an S&P 500 allocation.
For further details see:
EUSA: Equal Weight Midcap Equities Treading Water