HLLY - Evaluating Holley Inc. Investment Potential Amidst Elevated Risk And Interest Rates
2023-09-18 14:23:52 ET
Summary
- Holley Inc. presents strong fundamentals with impressive ROE and ROA figures, coupled with a significant reduction in debt levels from 2020 to 2022.
- However, the stock appears overpriced with a high EV/trailing 12-month EBITDA ratio and PE ratio, potentially deterring risk-averse investors.
- Holley's stock performance has been volatile, with recent declines but strong year-to-date gains. Investors should consider taking profits and decreasing positions.
Investment Thesis
Holley boasts a strong financial standing, supported by a steadily improving balance sheet in the brief three years since it began trading. Nevertheless, considering the significant abnormal price gains thus far and the stock's high volatility, I am not particularly confident that it can achieve returns surpassing the market in the future, primarily due to its elevated price. As a result, I would refrain from including this stock in a low-volatility portfolio unless it experiences a substantial price drop. For those currently holding the stock, it might be wise to contemplate taking profits and decreasing your position size.
Company overview
Holley functions as an automotive enterprise, specializing in the creation, production, and global distribution of carburetors, fuel pumps, fuel injection systems, and a range of high-performance automotive aftermarket products tailored to the preferences of car and truck enthusiasts. Their clientele spans across the globe.
IPO recap
Holley, a special purpose acquisition company (SPAC), finalized a binding merger agreement that led to its transformation into a publicly traded entity on the New York Stock Exchange (NYSE). It commenced trading in November 2020, with an initial offering of 25 million primary shares and an additional 3.75 million shares available through a greenshoe option, constituting 15% of the total. The offering was set at a price of $10 per share and successfully generated $250 million in capita l
Stock Price Performance
Holley's stock performance has faced recent challenges, registering a 7.32% decline in August, primarily driven by a sharp 28% drop in mid-August. However, when considering year-to-date returns, HLLY has outperformed the broader market significantly, posting gains of 140.57%, while the S&P 500 achieved a 16.21% return, and the Russell 2000 reached 5.34%.
This substantial rally was punctuated by a notable 27% increase in mid-August, which followed their announcement of second-quarter adjusted EBITDA results surpassing the average analyst expectations. Interestingly, the August rally was surprising due to its rapid ascent, but it was later accompanied by a decline. This decline may have been influenced by a combination of profit-taking investors and a specific shareholder's intention to sell 5.5 million shares . The latter factor potentially contributed to the stock price decreasing from $7.33 to $6.71 in aftermarket trading, representing an 8% downturn.
Technical Indicators
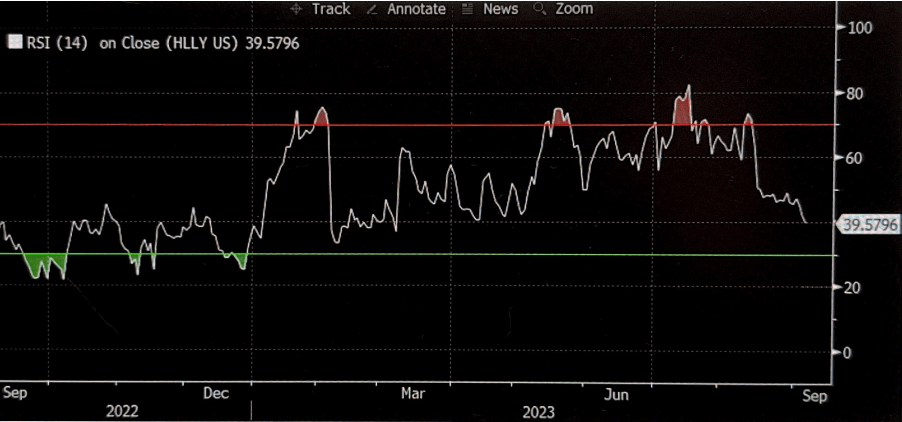
The relative strength index ((RSI)), a widely-recognized momentum-based oscillator utilized to gauge the velocity and direction of price movements, has reached a value of 39 . The most recent instance of this occurrence was observed in early 2023, after which the stock experienced a remarkable rally, gaining almost 270%. Typically, a stock is regarded as being in an oversold condition when the RSI reading drops below 30 (as indicated by the green line). Consequently, based on the current RSI level, I do not believe it has reached a point where it's advisable to consider buying just yet.
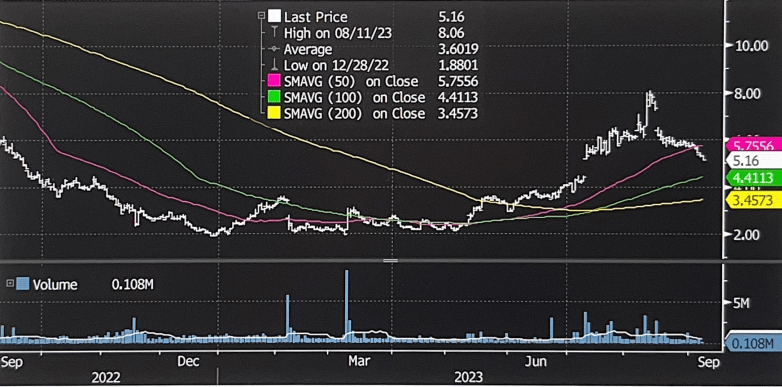
The simple moving averages ((SMA)) for the 50-day, 100-day, and 200-day periods are $5.73, $4.38, and $3.45, respectively. Presently, with the stock price at $5.31, it has only surpassed the 50-day average but has not yet crossed the 100-day and 200-day averages. This suggests a selling signal. It's worth noting that the stock is still trading significantly higher than the 100-day and 200-day SMAs, by 17% and 49% respectively, which represents a substantial difference.
Nonetheless, relying solely on technical indicators is insufficient, and it's crucial to adopt a statistical approach when assessing volatility. This is because investors who solely rely on technical indicators (a practice rarely seen among portfolio managers working for large institutions) operate under the assumption that prices adhere to a strict, binary pattern, which is an incorrect premise.
Volatility
Regression analysis, a statistical technique, provides a quantitative means to assess the sensitivity of Holley's performance to fluctuations in the market activity of a specific index. This analysis helps in evaluating the potential future performance of the company's stock.
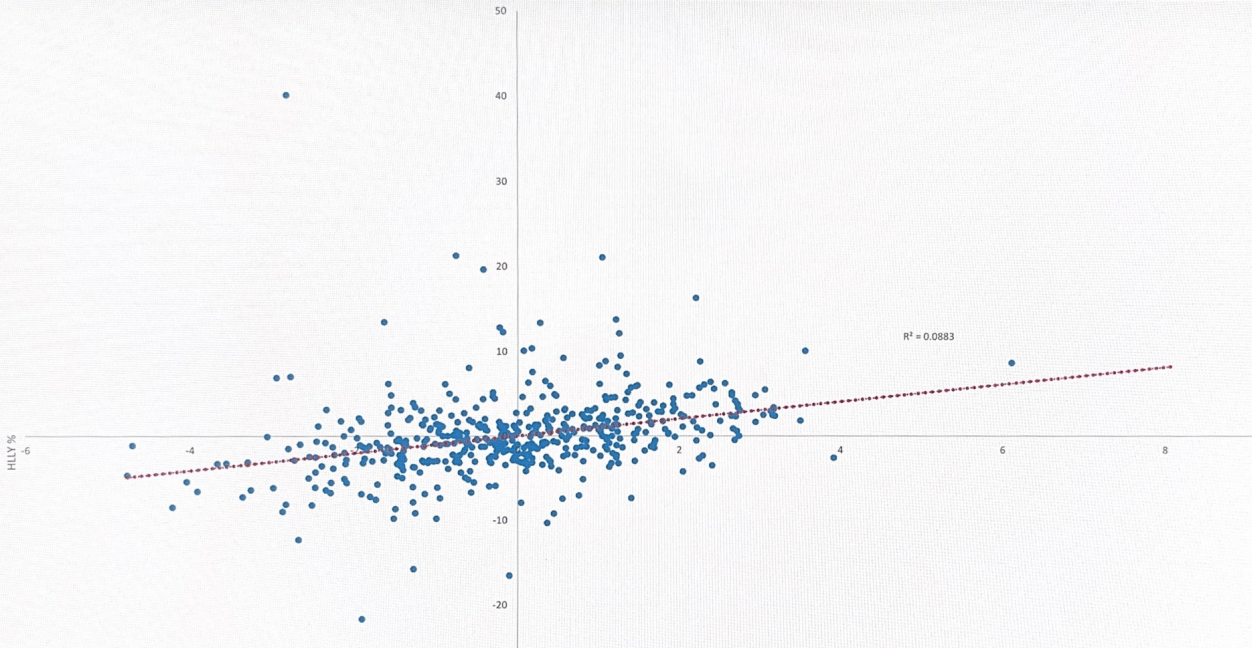
Given the considerable volatility in Holley's stock price, we conducted a regression analysis by comparing daily returns of HLLY and RTY stocks over a six-month period. The resulting equity raw beta value is 1.58, with a standard deviation of 6.4. It's important to note that this measure differs from the traditional beta metric as it gauges the volatility of the stock's percentage price change in response to a 1% move in a representative market index. This provides a valuable insight into how much the stock tends to move relative to the broader market within a short timeframe.
For those interested in the standard beta calculation, it's determined by calculating the slope of the regression analysis, resulting in a raw beta of 1.011. It's important to note that the regression analysis covers a date range from 2021 to 2023, encompassing a beta value that reflects an average of highs and lows within that time frame. Consequently, it's lower than the 6-month beta mentioned earlier.
As indicated in the graph, the R-squared (R2) correlation coefficient is relatively strong at 0.088 when plotted against the Russell 2000 index. Therefore, I conducted the regression analysis against the S&P 500 index, but the correlation weakened significantly at 0.063. Additionally, it's worth mentioning that using the S&P 500 index as a benchmark might not be appropriate since HLLY is a small-cap stock. Comparing it to the Russell 2000 index yields more relevant results, and I obtained similar correlation findings when plotted against the S&P 600 at 0.087.
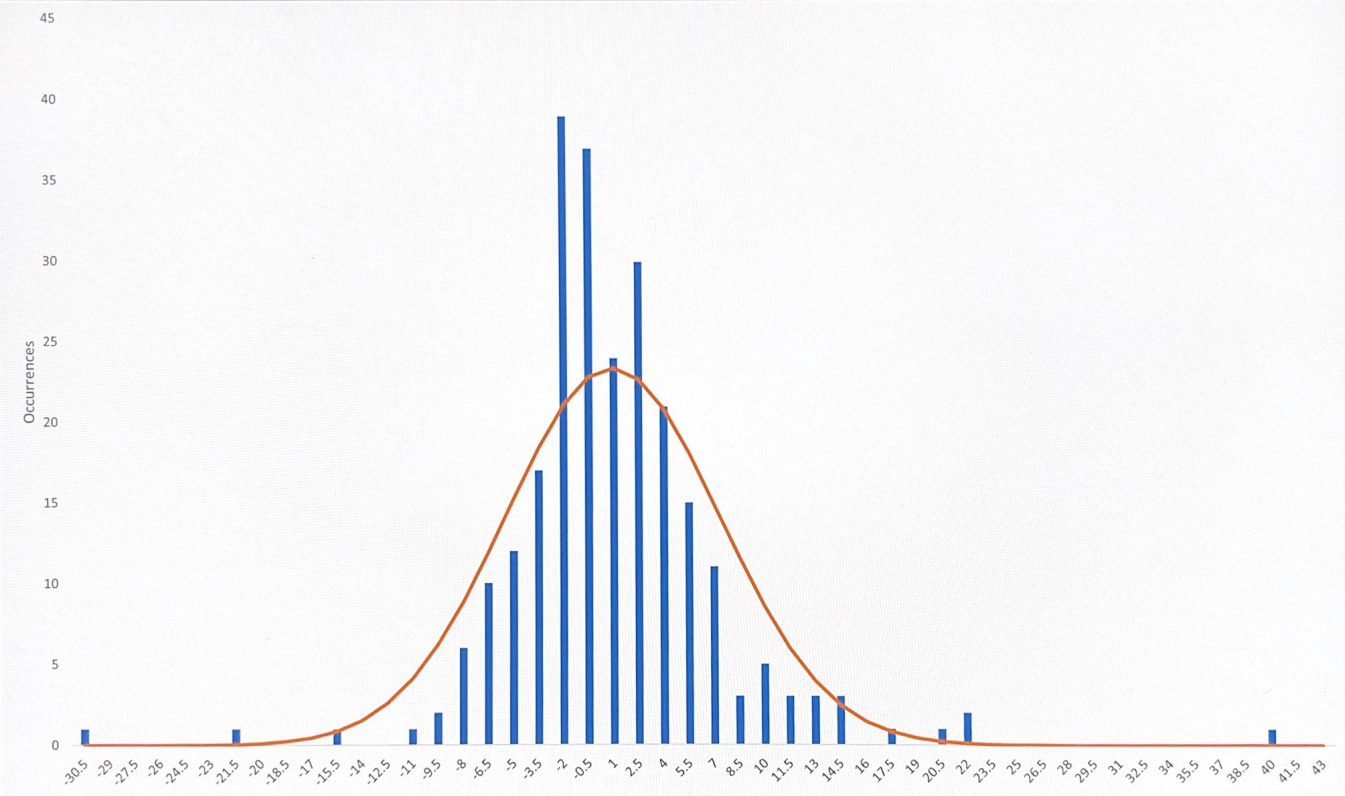
By specifying an observation parameter of 260 and a bin number of 50, we can create a histogram depicting the price returns of HLLY and the corresponding frequency of each return. When we superimpose a normal distribution curve on this histogram, we can observe the stock's pronounced volatility, which is evident in the 1 and 2 sigma values of 6.4% and 12.4%. Please note that these return figures pertain to a one-year period.
Earnings
There has been a recent uptrend in earnings estimate revisions for HLLY, which can be considered a positive indicator from a fundamental perspective. This is because a favorable trend in earnings estimate revisions often translates into near-term price appreciation.
The second-quarter results have displayed a consistent improvement in both sales and profitability. Notably, the revenue of $175.3 million exceeded the consensus estimate of $172.9 million, reflecting a 1.38% positive surprise. Moreover, the adjusted EBITDA of $37.9 million outperformed the estimate of $31.8 million. This improvement in profitability was driven by enhanced cost-cutting measures, leading to an adjusted EBITDA margin that exceeded 21% in Q2. Consequently, these positive developments have led to an upward revision in the full-year 2023 outlook, with adjusted EBITDA now projected to be between $118 million and $128 million, and revenue expected to fall within the range of $635 million to $675 million.
The table below illustrates how the actual Q2 results surpassed estimates across all metrics and provides the anticipated estimates for Q3, along with the percentage change relative to the actual Q2 results.
Bloomberg
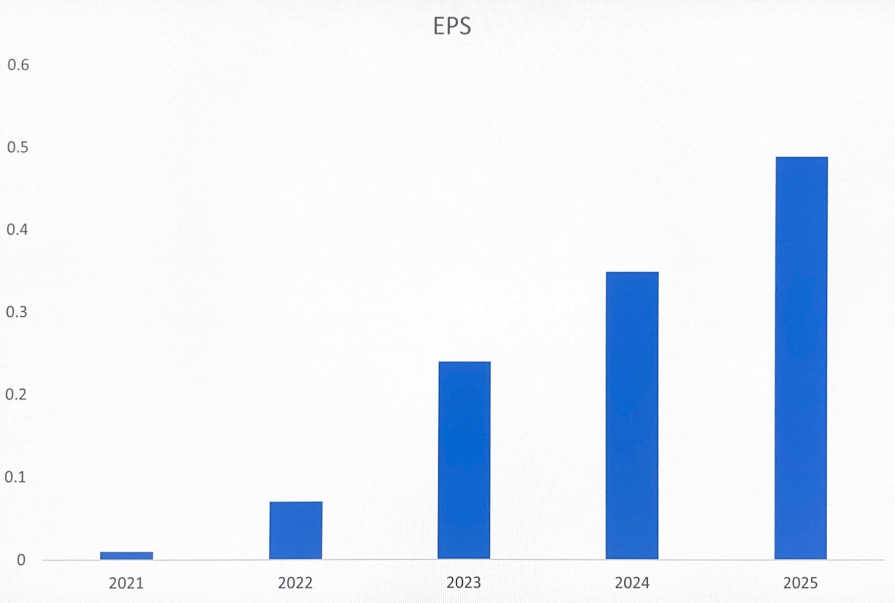
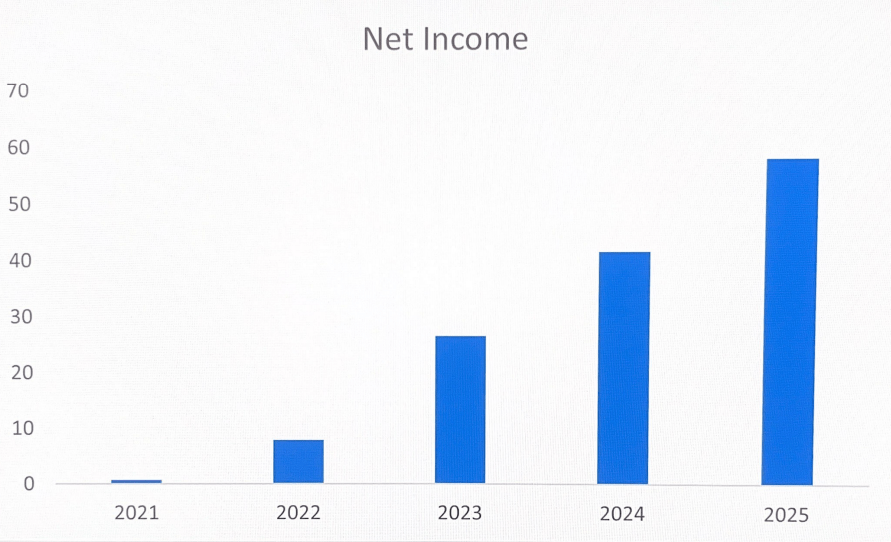
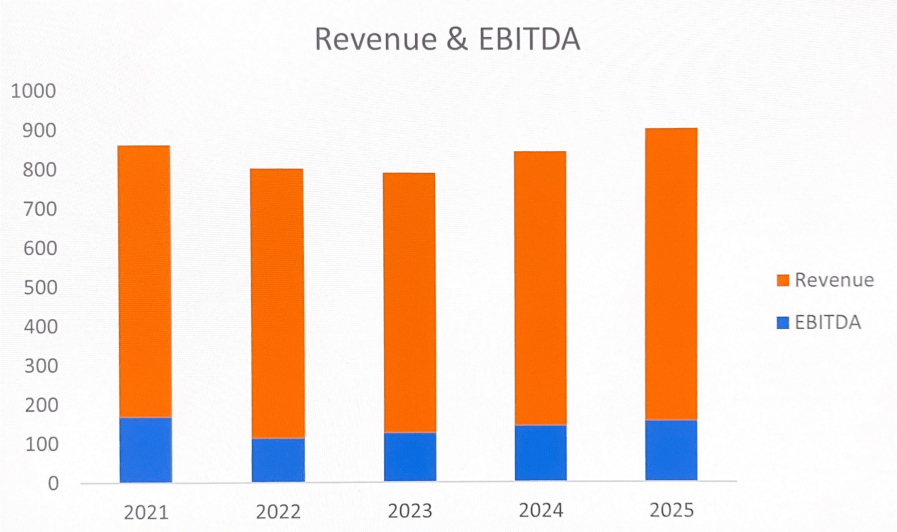
Considering the significant fluctuations in the Q2 results, which could potentially be an outlier, it becomes imperative to analyse these metrics over an extended timeframe. The following graphs depict these metrics on an annual basis to smoothen out the quarterly fluctuations and incorporate market expectations up to 2025. It's crucial to bear in mind that the availability of financial data for this company is constrained, and future estimates are merely projections, subject to modification due to the inherent volatility associated with small-cap stocks.
As illustrated in the graph below, there is a nearly twofold increase in EPS between 2024 and 2025. Consequently, the projected PE ratios from Bloomberg are estimated to be 15.93 for 2024 and 11.34 for 2025. In comparison to the current PE ratio of 19.31, this suggests the possibility of the stock becoming more attractively priced in the future.
The consensus estimate for earnings per share ((EPS)) tends to exhibit an upward trend, with a substantial 47.1% increase for the current year. This suggests a strong consensus among sell-side analysts covering HLLY that the company is likely to report better earnings than previously predicted .
Valuations
Based on the provided assumptions, I have calculated the equity risk premium to be 5.934%, indicating that investors are demanding higher returns due to the associated higher risk.
Here are the assumptions used for the calculation:
1. Expected market returns = 10.117% (based on the average daily S&P 500 market returns from 2000-2023).
2. Risk-free rate based on US 10-year government bonds yield = 4.246%.
3. Beta = 1.011.
Despite having solid fundamentals, including a return on equity ((ROE)) of 20.48% and a return on assets (ROA) of 6.04%, coupled with decreasing debt levels (debt-to-equity ratio dropping from 250% in 2020 to 156% in 2022) and an improving product line contributing to higher revenue and income forecasts, it's worth noting that the stock appears to be overpriced. This assessment is primarily based on its elevated EV/trailing 12-month EBITDA ratio of 15.7 and a PE ratio of 45.4, which place it on the higher end of the valuation spectrum. This suggests that, especially for a risk-averse portfolio, the stock may not present an attractive investment opportunity at its current price level.
Conclusion
In conclusion, the analysis reveals several key insights into the investment prospects of the stock in question. While the company demonstrates robust fundamentals, including impressive returns on equity and assets, as well as a commendable reduction in debt levels, it's essential to consider the broader financial context.
The computed equity risk premium of 5.934% indicates that investors are seeking greater returns, a challenge in a high-interest environment that tends to disproportionately impact small-cap growth stocks. Furthermore, the stock's relatively high EV/trailing 12-month EBITDA ratio and PE ratio indicate that it is currently priced at the upper end of the valuation spectrum. Given these factors, caution should be exercised, particularly for those with risk-averse investment preferences.
In light of these findings, it may be prudent to await a more favorable entry point into the stock, especially if it experiences a price correction. While the company's fundamentals are promising, a careful assessment of the risk-return trade-off should guide investment decisions, ensuring alignment with one's investment goals and risk tolerance.
For further details see:
Evaluating Holley Inc. Investment Potential Amidst Elevated Risk And Interest Rates