NLY - Evaluating Risk / Reward In 8-10%-Yielding Agency mREIT Preferreds
2023-04-26 11:56:18 ET
Summary
- We take a look at the Agency-focused mortgage REIT preferreds sector - a sector that continues to be popular with income investors owing to decent quality and high yields.
- We highlight some of the key metrics to focus on when evaluating both risk and reward.
- And we highlight our current holdings.
This article was first released to Systematic Income subscribers and free trials on Apr. 19.
Many investors are immediately attracted by Agency mortgage real estate investment trusts, or mREITs, on the basis that these companies predominantly hold Agency MBS - mortgage-backed securities that bear no credit risk - but trade at very elevated yields. In this article, we focus on preferred securities issued by these companies and take a look at some of the key metrics when analyzing both risk and reward in the sector and highlight some of our own holdings.
Oddly enough, there is no official definition of what makes an Agency mREIT. A strict 100% definition would likely capture only one company - ARMOUR Residential REIT, Inc. ( ARR ) - with most of the rest of the Agency mREIT space holding at least some exposure to credit (including NLY, AGNC, DX and others). For our purposes, an Agency mREIT is one whose Agency MBS allocation is in the neighborhood of 80-90%, which encompasses around 7 companies. This is why we tend to refer to the sector as Agency-focused mREITs rather than Agency mREITs.
Some Agency-focused mREITs hold both Agency MBS and Agency MSRs (mortgage servicing rights). This may not seem like a big deal, but this issue is important. MSRs have a number of attractive features, such as negative duration, which can offset the positive duration of Agency MBS.
However, MSRs also have unattractive features which come to the fore during periods of stress. Specifically, MSRs tend to sharply drop in price during crises. In these episodes, such as during the Great Financial Crisis ("GFC") or the COVID shock, interest rates tend to fall very sharply. This causes rapid losses for MSRs because of their negative duration (i.e., prepayments will tend to increase when rates fall, lowering the value of the mortgage servicing annuity). Secondly, MSR liquidity rapidly dries up, meaning they tend to drop in price much more than what is predicted by the change in interest rates as there are fewer MSR takers in a market shock. This is in contrast to Agency MBS, which remain liquid, in part, because the Fed tends to step in to provide a backstop to that market.
Finally, MSRs are essentially Agency MBS derivatives because their ultimate value depends on the level of mortgage rates. In other words, there is no "par" that investors get back on an MSR as it's just an annuity whose value depends on mortgage rates - the higher the mortgage rates, the lower the likelihood of prepayment and the longer the servicing annuity stream survives which pushes its price higher and vice-versa. And, yes, MSR interest rate exposure can be more-or-less hedged with the same instruments that hedge Agency MBS, however this hedge is far from perfect as many companies found out in 2020 when their prepayment models went haywire. In short, when investors are told a given mREIT is "safe" because it's a "pure" Agency MBS, they should ask how much of its portfolio is actually in Agency MBS (both spec-pools and TBAs) as well as how much of the rest is in MSRs or credit assets.
Possibly, the first thing investors who jump into Agency mREITs learn is that over the longer term, buy-and-hold returns end up fairly disappointing and don't much resemble the high yields of these securities. A big reason for this is that mREIT book values and, hence, stock prices, have tended to drift lower over time, whereas the equity market, in aggregate, has tended to move higher.
This misconception (expecting book values to move higher with the rest of the stock market) treats mortgage REITs as traditional "widget makers." Investors who have spent any time looking at mREITs have probably noticed that mREIT equity and book values (not the same metric, but roughly directionally similar) have tended to move lower over time. This is in contrast to successful traditional companies which are able to generate value over time and drive a rise in their level of equity or the difference between their assets and liabilities.
The basic reason why mREITs don't follow this pattern is simply because mREITs are not traditional companies. They are not in the business of making "stuff" - they are just leveraged portfolios of fixed-income securities. The specific reason why mREIT equity / book values tend lower is a bit more involved.
First, current Agency valuations (i.e., Agency "basis" or OAS) are at a historically extreme level, i.e., Agencies are unusually cheap versus Treasuries. Any straight line drawn from a previous level of mREIT equity / book value to today is going to be downward sloping given the depressed nature of Agency MBS prices.
Second, there is an annuity aspect to the MBS portfolio as some of the net income received includes the principal which means the mREIT will be overpaying relative to its actual underlying yield profile, causing its level of equity to fall over time, all else equal.
Third, there are various drags on the portfolio such as hedging costs. As volatility increases the mREIT effectively has to buy high and sell low or more precisely, pay fixed high and receive fixed low when it rebalances its interest rate swap portfolio. This is partly offset by long volatility hedges via swaptions but the swaptions themselves carry an embedded cost via theta or time decay.
Fourth, mREITs tend to go through deleveraging episodes where the book value steps lower as the company sheds assets to ensure its leverage does not rise above its comfort level.
Active management can push the other way and allow the mREIT to add value; however, historically, it has not been able to override these factors.
At this point mREIT investors discover mREIT preferreds and realize that preferreds tend to offer stronger total returns at a lower volatility. The chart below shows this dynamic for a, rightfully, well-regarded AGNC Investment Corp ( AGNC ).
Systematic Income
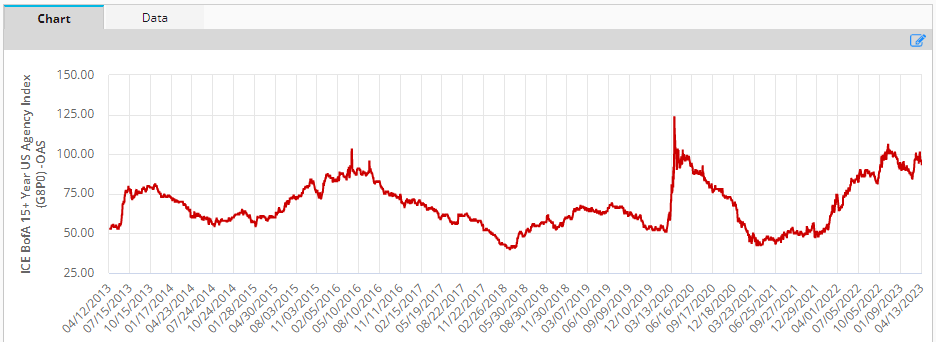
The key point here is not that mREIT common is uninvestable. Rather, it requires a much more tactical approach than the preferreds. The main reason is that the Agency OAS is highly mean-reverting as the following table shows.
And if we look at the normalized book value trajectory of the Agency-focused mREIT sector we see that it basically follows Agency OAS. For example, the biggest drops in sector book values (highlighted in the chart below) happened in 2015, 2018, 2020 and 2022. If we refer to the Agency OAS chart above we can see that it is in these years that Agency OAS rose quickly.
Systematic Income
In a "normal" credit sector we would see a quick bounce-back in values however book values don't bounce back when Agency OAS retraces and this has largely to do with the deleveraging that these companies have to undergo in order to keep leverage from rising to uncomfortable levels. This tends to lock in economic losses in their portfolios.
The obvious question is whether preferreds investors should also be mindful of this pattern. The short answer is of course since preferreds investors want book value to be as high as possible. The long answer is more complicated, however because what preferreds investors are really after is equity and, specifically, equity / preferreds coverage or the ratio between total stockholder equity and preferreds liquidation preference, i.e., the amount of equity per unit of preferreds. Obviously, the more equity there is the better off the preferreds are, all else equal.
However, mREITs have other ways to push this ratio up than just an increase in book value. They can issue additional equity (e.g., NLY and AGNC recently), they can redeem preferreds (e.g. TWO not too long ago) and they can buy back preferreds (e.g., IVR last year). All of these actions can keep the equity / preferreds coverage at a healthy level despite a drop in book value. To be fair, these actions are nearly always not enough to reverse sharp drops in book value but they can help at the margin.
The key takeaway here is that investors need to be mindful of both the portfolio make-up of any given mREIT as well as the trajectory of its book value and equity / preferred coverage level, something we explore in more detail below.
Gauging Risk In The Sector
One approach to allocating to mREIT preferreds is to say that, well, no Agency-focused mREIT preferred has ever suspended dividends so we don't need to worry about it. However, not only is there a first time for everything, this also doesn't mean that all securities are created equal or bear the same kind of risk.
Digging a little deeper, a slightly more sophisticated analysis will tell investors that they ought to pay attention to leverage levels in the sector. That surely points in the right direction but, as a standalone metric, it's nearly useless.
Finally, a security-level analysis might tell investors that mREITs holding MSRs are particularly safe because MSRs are unlikely to go down in value as households are much less likely to refinance (and, hence, reduce the value of the servicing annuity) since they're likely already sitting on low-rate mortgages.
This is a heroic conclusion that seems to assume that households locked in their mortgages near the lows and/or that rates will stay higher for longer. It also ignores the fact that the market for MSRs tends to dry up during periods of stress like it did in Q1 of 2020, requiring very large bid/offers to sell assets. And unlike for Agency MBS, there will be no Fed repo facility for MSRs to keep that asset class functioning.
This brings us to the question of what actually matters for preferreds. Conceptually, preferreds investors don't care as much about marginal moves in various securities as their common share counterparts. What preferreds investors really care about is the tail risk scenario which would leave them naked i.e. with insufficient equity protection where total stockholders' equity is less than the preferreds liquidation preference.
And in fact this is something that investors ought to think much harder about today than a few years ago. This is because equity / preferred coverage ratios have fallen significantly across the sector i.e. the sector has become riskier since 2019. The chart below shows the equity coverage ratios for 2019 and 2022 across the sector. Only DX grew its ratio but that was only because of a redemption of one of its two preferreds. The other mREITs had significant drops with an average drop of 36%.
Systematic Income
This all sounds fairly theoretical. Let's bring some intuition to this. This is what the equity coverage ratios look like today.
Systematic Income
The way we can think about this is the following. One, this century Agency OAS blew up roughly around 1% on average during crises or market dislocations (e.g., GFC, COVID, 2022 inflation shock).
Two, Agency mREITs tend to have book value sensitivity of between 10-15% to a 0.25% change in Agency OAS. In other words, for a 0.25% rise in Agency OAS the sector will lose around 10-15% in book value, all else equal. For a 1% rise in Agency OAS the book value impact is on the order of 40-60%.
In short, a "typical" crisis halves the book values in the sector. A good second order approximation here is to know that mREITs will start to deleverage very quickly in a crisis to lower their leverage which means that the ultimate book value drop does not scale linearly but slows down i.e. it starts off at 10-15% but at a 1% Agency OAS rise falls to something like half that. In short, a reasonable approximation here is that book values might drop 30-40% (rather than 50%) in a crisis unless there are exceptional reasons (or incredibly poor risk management).
Let's see how things have played out over the last two difficult periods. Arguably, both the COVID period and the 2022 inflation shock were fairly modest crises. The Fed stepped in very quickly in 2020 and the 2022 sell-off was very slow-moving, allowing mREITs plenty of time to manage through it.
Here is what the annual book value changes look like in the sector. The average book value drop between 2019 and 2020 (x-axis) was 28% and the average book value drop between 2021 and 2022 was 35% - not too bad relative to our back-of-the-envelope.
Systematic Income
IVR is an interesting outlier, having underperformed in both instances. As of 2022, it has equity / preferred coverage ratio of 2.6x. Its average book value drop across these two periods was 66%. If we see a 66% drop in book value its equity / preferred coverage ratio moves to 0.9x. At that level, the preferreds are uncovered by around 10% - an extremely bad outcome. That should make IVR preferreds investors fairly nervous about holding the preferreds as they are only one crisis away from twisting in the wind.
CHMI preferreds are slightly better. Book value fell 33% on average in the last two relevant periods and this would push coverage from 2.2x to 1.5x. A figure north of 1x is surely more comfortable than below 1x but at that level investors will not only feel nervous but will also feel the impact on the prices of the preferreds which will surely drop sharply to reflect this dire situation.
Some investors may feel pretty good about equity coverage north of 1x since crises don't happen back to back and coverage of 1.5x doesn't seem horrific. However, we need to remember that book values in the sector tend to fall over time so a rock bottom coverage metric, even if it's above 1x, is pretty nerve-wracking.
Systematic Income
So, how should investors go about allocating in the sector? In our view, they should certainly not buy the highest-yielding Agency mREIT preferreds. It can be very satisfying to feel smug about retail securities like these being inefficiently priced however the road to investment hell is paved with the assumption that the market is totally inefficient and the highest-yielding securities are a gift to discerning investors. The reality is that the very highest-yielding securities in the sector are those that bear the lowest coverage ratios and also those that saw the worst book value performance over the last 4-5 years. In our view, things are actually the other way around. The highest-yielding Agency-focused mREIT preferreds are actually not providing nearly enough yield compensation for their poor fundamentals and bad historic risk management.
Gauging Reward In The Sector
Despite being popular with retail investors, preferreds are some of the most complex securities. Here we are not talking about the underlying mechanics of their portfolios (which are complex enough) but actually their yields.
What makes these securities particularly challenging is the Fix/Float profile of some of the stocks. In order to gauge relative value, investors need to know when the securities are expected to switch to a floating-rate profile as well as have a sense of what the future base rate is going to be and how it's going to evolve. They should also have a sense of the redemption likelihood (the Fix/Float stocks can be redeemed on the same date the coupon switches to a floating-rate).
Two important things to remember is that investors should not take the stripped yields of this sector at face value. For example, the stripped yield of NLY.PG is 6.89% today whereas its actual yield is around 10%. What's going on here? Well, NLY.PG recently switched to a floating-rate coupon of Libor + 4.172% or 9.362% for the next coupon versus its previous coupon of just 6.5%.
This may sound like a highly unusual case, however, stripped yield can trip up investors even in securities that don't switch over to a floating-rate coupon for the next period. Specifically, in a period of sharply changing short-term rates investors cannot rely on stripped yield to give them an accurate sense of the yield of floating-rate preferreds. For instance, since 2022, investors who looked to stripped yield to gauge the yield on floating-rate preferreds would have been consistently wrong - in some periods by as much as 2% - for the simple reason that the stripped yield gives you a lagged picture of short-term rates. Just as stripped yield understated yields as short-term rates rose since 2022, it will overstate yields once short-term rates start to fall.
Another way stripped yield can trip up investors is in comparing two floating-rate preferreds. For example, in a rising short-term rate environment one floating-rate preferred could reset a month later than the other and capture a higher base rate. This may artificially flag up as a higher yield even if it's not actually the case.
If the stripped yield gives investors a lagged rearview yield picture, can the floating-rate coupon do a better job? In short, if we know that one stock is paying Libor + 4% and the other Libor + 4.5%, it seems obvious that the yield of the second is higher? While knowing the coupon is useful it can be highly misleading. This is because yield is a function of two things - the coupon and the stripped price. Without the stripped price investors won't know the yield even if they know the coupon.
In our own CEF Preferreds Tool we combine the coupon (using today's Libor) and the stripped price for what we call Float Yield . In our view this makes comparing floating-rate preferreds much more straightforward, without the issues discussed above.
Systematic Income Preferreds Tool
That said, stripped yield remains the workhorse of fixed-rate preferreds alongside yield-to-call. Reset yield is very useful as well and is the expected yield on the first call date based on the forward base rate on that date. There are a number of other yield flavors we like to include in our Preferreds Tool which give a more rounded picture of valuations.
Given the problems around a naive approach to sector yields (i.e. relying on stripped yields or coupons), what can investors do? The handful of investors who can crunch all the numbers in their heads a la Rain Man are fine but what about the rest of us? What we find very useful (and without which we would be lost as well) is what we call forward yields. Forward yields are simply a future view of yields based on forward base rates.
The chart below captures this for a handful of preferreds. For a fixed-rate preferred ARR.PC forward yield is just a straight line (green). For Fix/Float preferreds the line is based on the forward rate. It is flat until the first call date (when the stock switches to a floating-rate coupon) and then moves in accordance with forward rates.
Systematic Income Preferreds Tool
These forward rates are shown below. These rates are calculated based on interest rate futures prices and the term structure of the yield curve. Here we see that forward short-term rates like SOFR and Libor (which will go away in June) are expected to move lower over the next couple of years which is not unexpected. Obviously, future interest rates may not resemble today's forward interest rates but that doesn't actually matter a whole lot for this analysis as they're a neutral starting point. Investors who think that short-term rates will remain higher for longer, for instance, can adjust their yield projections upward for Fix/Float preferreds and vice-versa.
Systematic Income Preferreds Tool
Stance And Takeaways
In this article we discussed some of the ways investors can go about navigating the Agency mREIT preferreds sector along with how to avoid some of the more common pitfalls.
In terms of allocation, our own approach to the sector is to avoid what we call uninvestable preferreds. These include preferreds with ultra low equity / preferred coverage such as CHMI and IVR preferreds. Yes, these preferreds offer higher yields but not only have they seen greater book value erosion (a great indication of poor risk management) but they also stand one crisis away from a catastrophic level of equity coverage.
Some of the securities we continue to like are the floating-rate Annaly Series F ( NLY.PF ), trading at a 10.5% yield (i.e. Float Yield above at today's Libor). The company has done a reasonable job conserving book value and now boasts the highest equity coverage figure in the sector. It has also done a good job topping up equity by issuing new common shares.
We also like the AGNC Series G ( AGNCL ), trading at a 9.3% stripped yield. AGNCL is the only CMT (i.e., 5Y Treasury Yield)-linked stock in the Agency-focused sub-sector which provides good diversification to Libor (soon to be SOFR) based preferreds which take their marching orders from the Fed. It also has a long fixed-rate period till Oct-2027 which will keep coupons fixed even if the Fed starts to cut rates tomorrow.
For further details see:
Evaluating Risk / Reward In 8-10%-Yielding Agency mREIT Preferreds