CAHPF - Evolution Mining: Margins Bounce Back In Q2
Summary
- Evolution Mining has declined over 25% from its highs and logged its fourth consecutive weekly decline, affected by weakening sentiment sector-wide with a sharp decline in the gold price.
- Unfortunately, the stock has underperformed the Gold Miners Index in the period, which I attribute to the stock being one of the most overbought names heading into February.
- However, Evolution had a solid fiscal Q2 report, H2 2023 is shaping up to be better, and it looks set to maintain its industry-leading margins with ongoing work at RL/Mungari.
- That said, while Evolution could easily put together an oversold bounce, I don't see the stock in a low-risk buy zone just yet, so I see patience as the best course of action for investors.
Just over six weeks ago, I wrote on Evolution Mining ( CAHPF ), noting that while the company had a better 2023 ahead with it finally hitting its stride at Red Lake, it was time to book profits above US$2.25. This is because sentiment in the stock had shifted from extreme pessimism in Q3 2022 to elevated optimism after the stock had doubled in a four-month period, and it was now nearing a major potential resistance area at US$2.40 to US$2.50. Since that update, the stock has shed nearly 25% of its value and is back below its 200-day moving average, pushing medium-term momentum to the downside. Let's look at the company's fiscal Q2 results below and how the stock looks following its recent correction:
Unless otherwise noted, all figures are in United States Dollars, with AUD/USD conversions at a 0.70 exchange ratio for operating costs. Evolution Mining's fiscal Q2 is calendar year Q4 and is equivalent to Q4 for North American gold producers.
Q2 Production Results
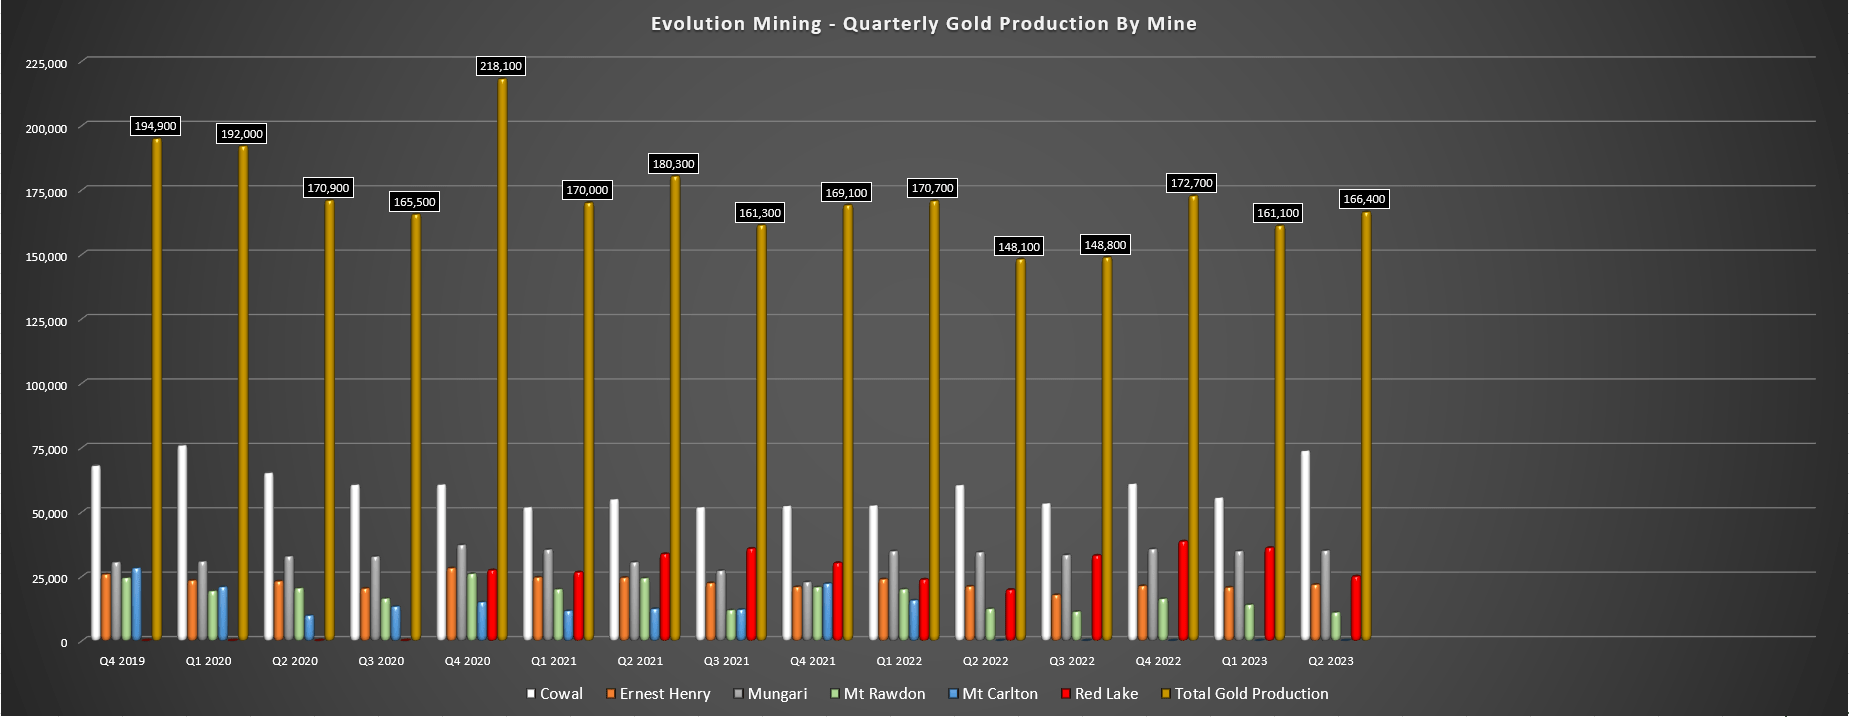
Evolution Mining released its fiscal Q2 production results last month, reporting quarterly production of ~166,400 ounces of gold, an 11% increase from the year-ago period. The culprit for the production increase vs. fiscal Q2 2022 was higher-grade development ore available at Cowal, an increase in production at its Red Lake Mine despite a tough quarter (~25,000 ounces vs. ~19,800 ounces), and solid quarters from Ernest Henry and Mt. Rawdon, with the former enjoying industry-leading margins, with all-in-sustaining costs [AISC] coming in at (-) A$3,748/oz or (-) US$2,620/oz. Let's inspect the quarter in a little more detail below:
Evolution - Quarterly Production by Mine (Company Filings, Author's Chart)
Looking at the above chart, we can see that this was a very solid fiscal Q2 performance from Evolution, with gold production roughly in line with fiscal Q2 2021 levels despite the divestment of the Mt. Carlton Mine and a rough fiscal Q2 2023 for Mt. Rawdon because of elevated rainfall. A monster quarter at Cowal (~73,700 ounces produced) helped Evolution to deliver a robust operating performance, with production at this asset up 22% year-over-year with the benefit of ~105,000 tonnes of development ore mined from underground at an average grade of 1.76 grams per tonne of gold, pushing average grades to 1.14 grams per tonne of gold and providing a 110 basis point boost to recovery rates (85.3% vs. 84.2%) in the period.
Meanwhile, at Ernest Henry, production came in at ~21,800 ounces and ~15,500 tonnes of copper, a meaningful improvement from the year-ago period because of higher grades and throughput. Evolution noted that it processed ~1.62 million tonnes in fiscal Q2 at an average grade of 0.56 grams per tonne of gold and 1.03% copper, equivalent ~2.0 grams per tonne gold-equivalent. Given the increase in copper prices from the previous quarter and increase in copper tonnes produced (~15,500 vs. ~14,500), AISC came in at an incredible figure of negative A$3,748/oz, helping to pull the company's consolidated costs down to A$1,099/oz [US$770/oz] for the quarter despite a softer performance from two of its smaller assets in the period.
As for the weaker operations, Red Lake had a tough fiscal Q2, which is unfortunate given that it started off the year so well. Evolution noted that increased mining dilution and elevated absenteeism impacted the operation in the quarter, with the company producing just ~25,000 ounces in the period, a significant set back from the strong start to FY2023 (~36,100 ounces). During the quarter, development rates slipped to ~3,500 meters (fiscal Q2 2022: 3,800 meters), and tonnes mined declined to ~180,000 tonnes vs. ~194,000 tonnes, albeit at slightly higher grades. Fortunately, tonnes processed were up as were head grades, but this was still a very disappointing quarter after the very encouraging fiscal Q1 performance.
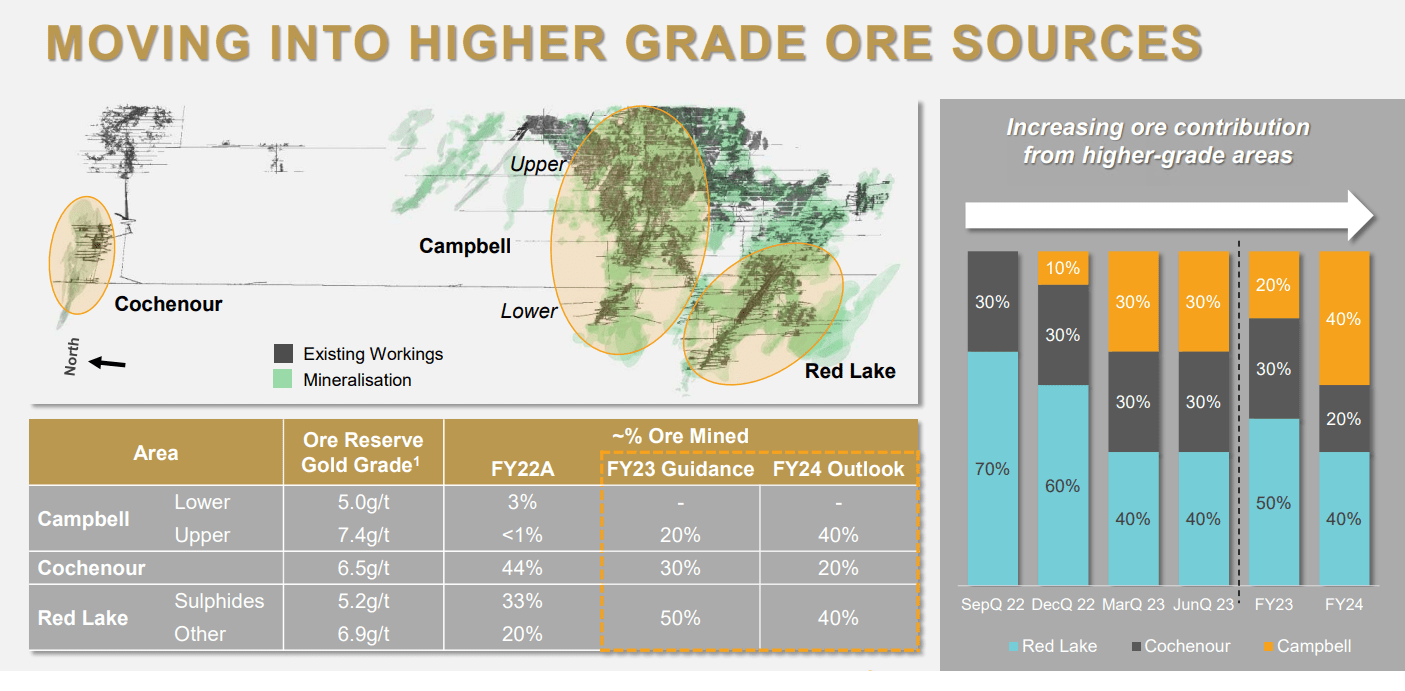
The silver lining is that grade reconciliation has been in line with expectations, the Upper Campbell area where there's much higher grades will represent a larger percentage of feed post-FY2023 and the asset had a much better January after a rough December. In addition, Evolution noted that it has made management changes with the appointment of Thomas Lethbridge (formerly Operations Head at Cadia and General Manager of Mt. Rawdon). Meanwhile, the focus on putting in place a new operations head is in progress, with Evolution's Chief Operating Officer spending "significant time at the operation" until it begins delivering on a more consistent basis.
Overall, the strong performance at Mungari, Cowal, and Ernest Henry masked the disappointing quarter at Mt. Rawdon (extensive rain events) and Red Lake (elevated absenteeism), allowing the company to pay down A$45 million in debt in the period and still finishing with a strong liquidity position (A$838 million). However, it would be nice to see Red Lake string together a few consecutive quarters of convincing performance without issues to have more confidence in this asset, which is dragging on Evolution's cost profile materially (Red Lake Q2 2023 AISC: A$2,761/oz [US$1,933/oz].
Margins & Financial Results
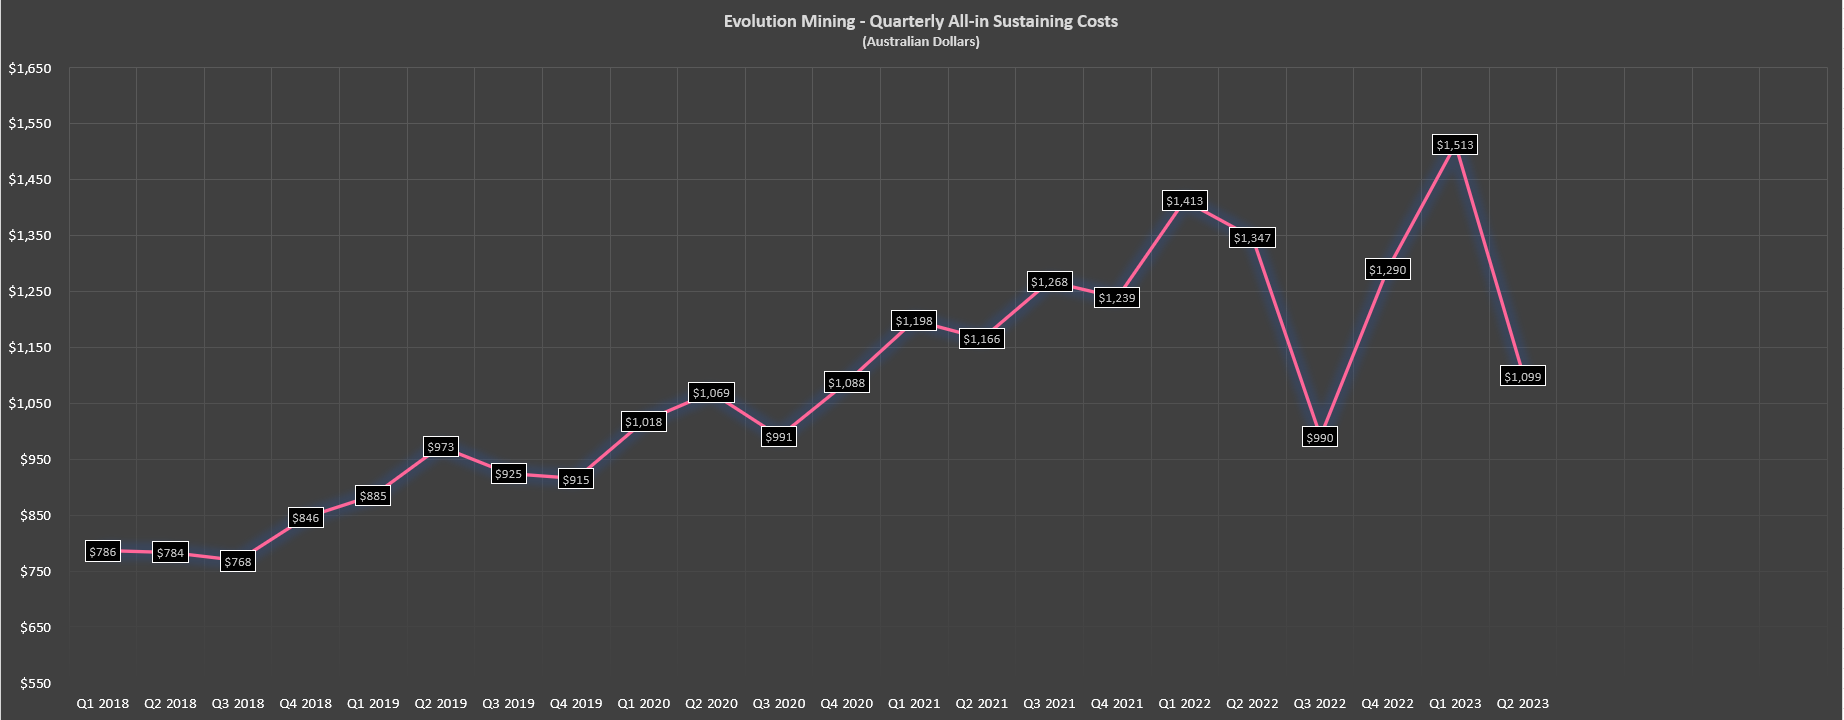
Moving over to costs and margins, Evolution and the rest of the sector continue to suffer from inflationary pressures, but the company reported incredible cost performance in the period. The company's company-wide AISC declined nearly 30% sequentially to A$1,099/oz and over 18% year-over-year from A$1,347/oz in fiscal Q2 2022. The sharply negative AISC at Ernest Henry (increased by-product credits) helped with the significant improvement in Evolution's consolidated costs, and AISC margins soared from A$1,031/oz to A$1,452/oz, giving Evolution some of the strongest margins sector-wide despite two of its assets stuttering in the period.
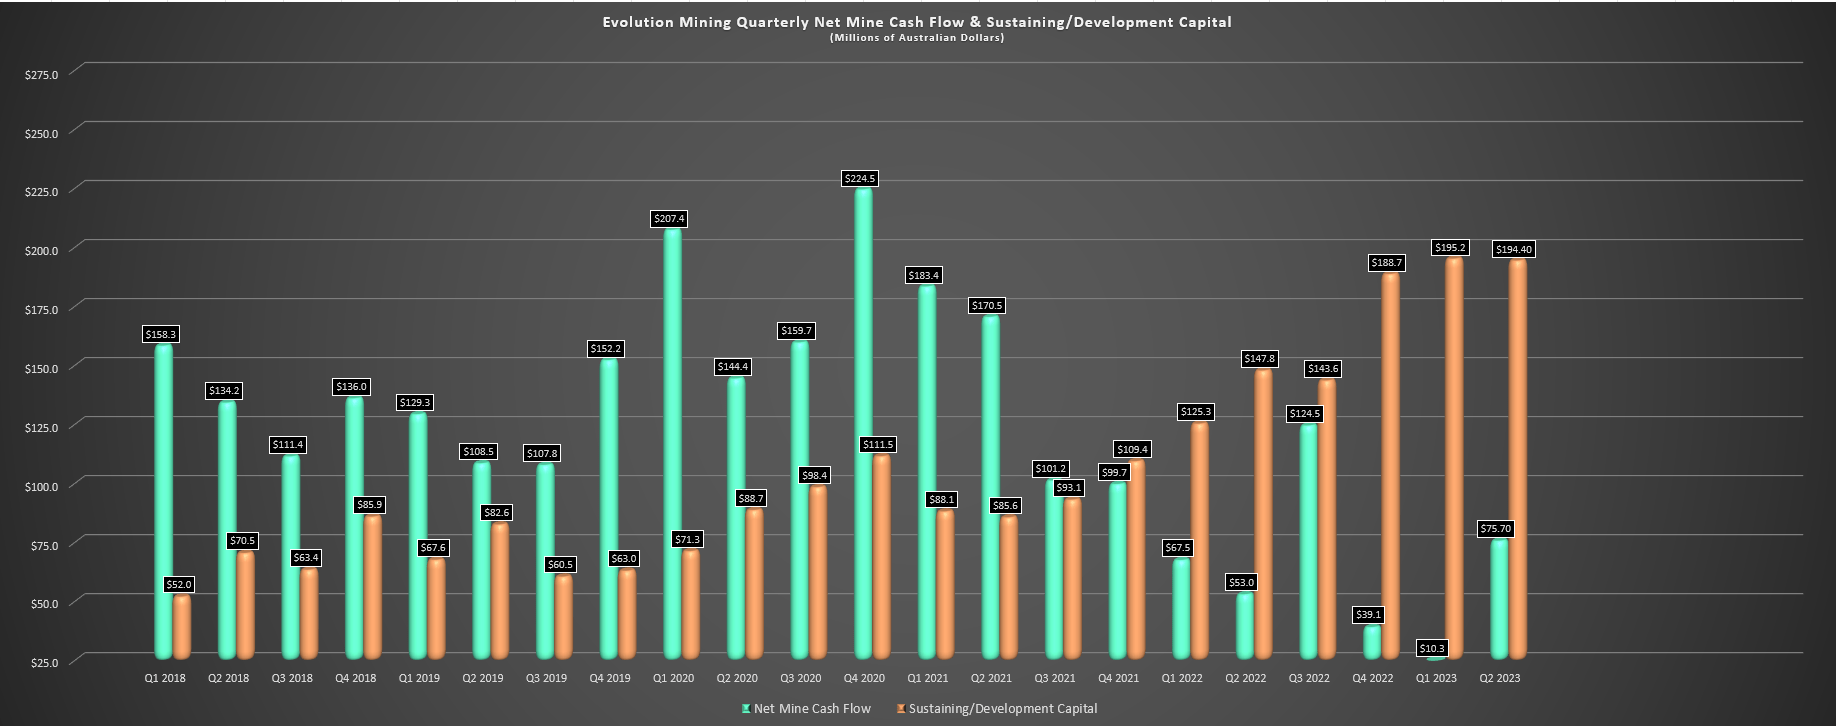
Evolution - Net Mine Cash Flow & Capital Expenditures (Company Filings, Author's Chart) Evolution - Quarterly Unit Costs (Company Filings, Author's Chart)
Given the strong cost performance, Evolution saw an increase in operating cash flow sequentially to A$270.4 million, up from A$206.3 million in fiscal Q1 2023. On a year-over-year basis, net mine cash flow improved to A$75.7 million vs. A$52.9 million despite a significant increase in capital expenditures in the period. That said, group cash flow came in at negative A$43.1 million after incorporating interest expense, negative working capital movements and income tax, plus corporate/discovery costs. The good news is that this period of significant capital spending (fiscal Q2 2023: $194.4 million) should improve in FY2024 at the same time as Red Lake and Cowal production ramps up, with stope ore due from Cowal next quarter and Red Lake set to produce closer to 50,000 ounces per quarter in FY2024, a material improvement from the fiscal Q2 2022 run rate.
Finally, from a balance sheet standpoint, Evolution finished the period with ~$1.46 billion in net debt, making it one of the more leveraged producers in the sector as it wades through this period of significant investment (Cowal Underground & Red Lake Optimization). However, while Kinross ( KGC ) trades at a huge discount to its peer group because of its higher leverage, the differentiator for Evolution is that it has very robust margins and can weather a decline in the gold price and still continue generating significant cash flow. In Kinross' case, the company's cost profile is much less attractive (US$1,320/oz vs. Evolution at US$880/oz). Plus, while Evolution has a large net debt position, it benefits from a relaxed maturity schedule and 60% of its debt is fixed at a relatively low 3.6% interest rate. Let's look at Evolution's valuation:
Valuation & Technical Picture
Based on ~1,836 million shares and a share price of US$1.82, Evolution Mining trades at a market cap of $3.34 billion and an enterprise value of ~$4.36 billion. This leaves the stock trading at a slight premium to its estimated net asset value of ~$3.11 billion, which isn't unusual given its track record of solid reserve replacement, industry-leading margins and Tier-1 jurisdictional profile. Using what I believe to be a fair multiple of 1.25x P/NAV, I see a fair value for Evolution Mining of US$2.30, with the stock now having 26% upside to fair value following its violent correction. However, I prefer a minimum 35% discount to fair value to justify buying small-cap and mid-cap producers.
If we apply this discount to Evolution's fair value (US$2.30), the ideal buy zone for the stock from a valuation standpoint is below US$1.50 where the stock would have an adequate margin of safety. However, given Evolution's higher leverage relative to some of its peers during this period of re-investment, I believe a 40% discount is more suitable, translating to a low-risk buy zone of US$1.39 or lower. So, while the stock is back to trading at more reasonable levels after being overvalued to finish January, I don't see the current pullback offering nearly enough margin of safety just yet.
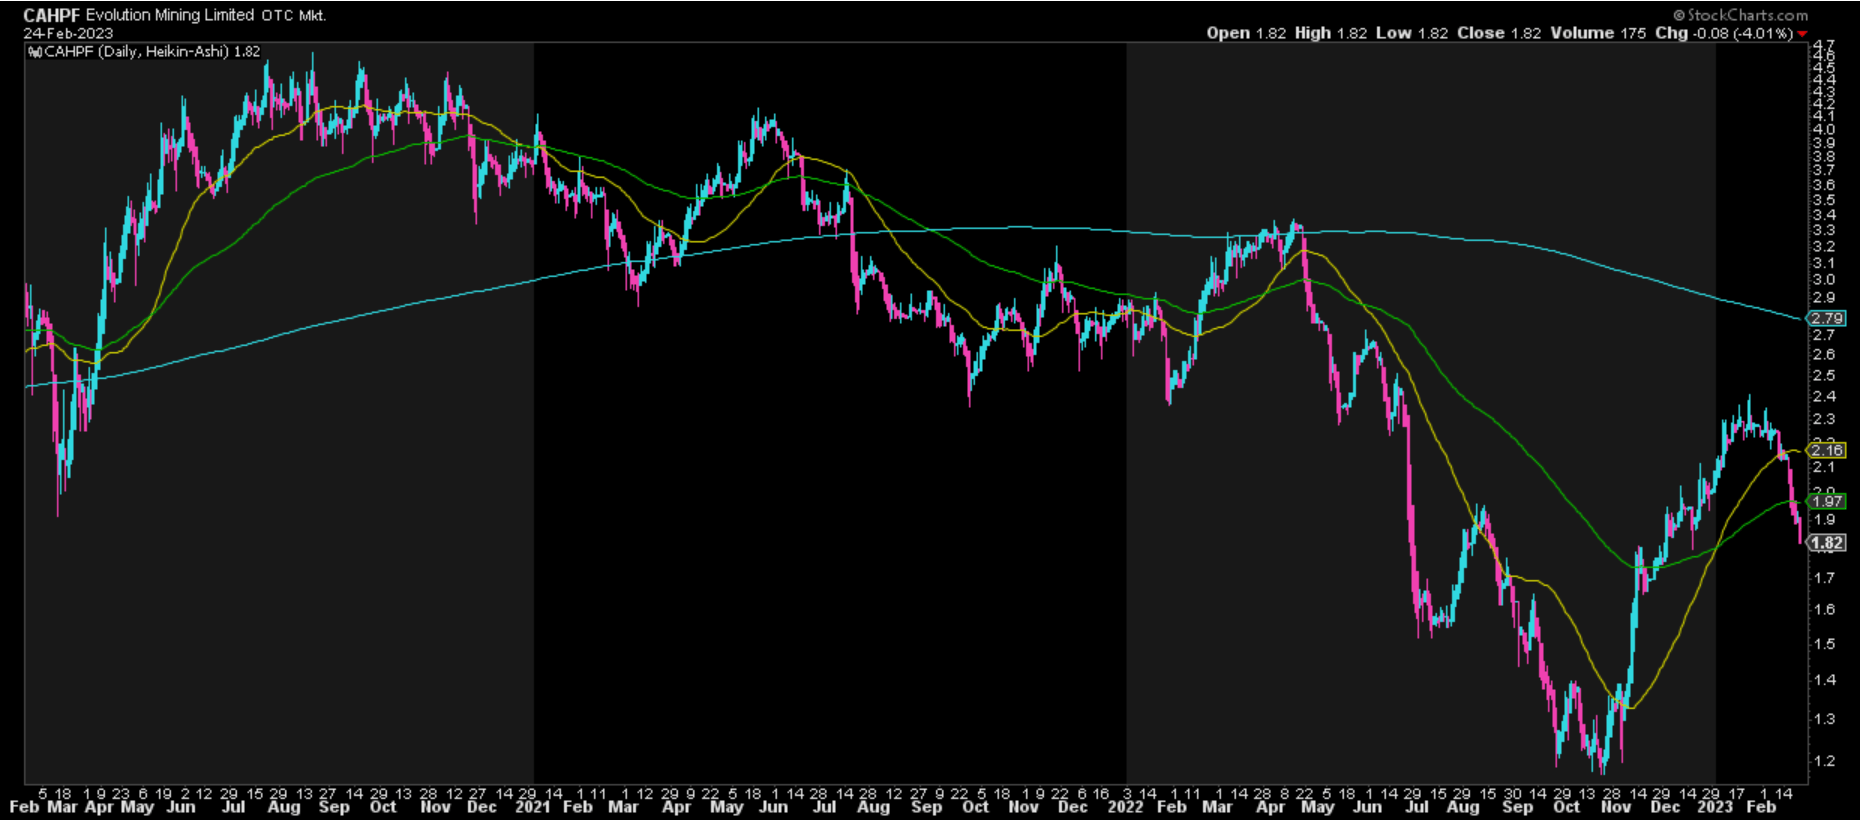
Moving to the technical picture, CAHPF has seen momentum shift to the downside after sliding below its 200-day moving average and, given its near-parabolic rally, its next support level doesn't come in until US$1.20 - US$1.30 with strong overhead resistance at US$2.25 - US$2.40. This doesn't mean that the stock must collapse to US$1.20 - US$1.30, but even after this sharp correction, the stock is still near the mid-point of its support/resistance range with ~$0.50 in potential upside to resistance and US$0.50 in potential downside to support. Given that Evolution is down for four consecutive weeks, a bounce wouldn't surprise me.
That said, given the persistent selling pressure during this correction, I see a higher probability that any oversold bounce fizzles out, with the stock likely to test the US$1.70 level at a bare minimum before a durable bottom is in place. Therefore, I do not see this as a low-risk buying opportunity just yet.
Summary
Evolution Mining put together a solid fiscal Q2 report with impressive cost performance with AISC of A$1,099/oz [US$770/oz], and it continues to be one of the highest-margin producers globally, just behind Orla Mining ( ORLA ). And although fiscal Q2 was a tough quarter for its Red Lake Operations, we should see a much better year in FY2024 with higher grades on deck and the mine benefiting from economies of scale. Given that this is one of the few drags on Evolution's cost profile, a dip in unit costs at Red Lake (optimization) and potentially Mungari (process plant expansion) should help Evolution to claw back lost margins from inflationary pressures as its higher-cost assets begin to see more respectable cost profiles.
That said, the goal is to buy cyclical stocks when they're hated like in Q3 2022, and we're not there yet. So, while I think Evolution is a solid buy-the-dip candidate, I would need a dip below US$1.40 to become more interested in the stock and start watching for a potential bottoming setup.
For further details see:
Evolution Mining: Margins Bounce Back In Q2