ATEC - Examining The Recent Breakout For Alphatec Holdings (Technical Analysis)
Summary
- Alphatec has broken out to the upside following a charge off its July FY22 lows.
- The rally has extended to the present day, and we examined to see if it has the legs to extend further.
- Here we took a technical approach to understand the various marketplace factors impacting ATEC's directional price distribution looking ahead.
- Several studies provide confluence to guide price visibility downstream.
- Net-net, we rate ATEC a buy at $12.50–$12.60 and are seeking a suggested return potential of 19%-59% to ~$20.
Investment Summary
Taking note of the recent breakout in Alphatec Holdings, Inc. ( ATEC ) shares, we decided to perform a deeper analysis to understand what's driving the upside and the longevity it may present. You'll see in Exhibit 1 that ATEC has maintained an upward trajectory since June FY22 and has now bifurcated away from the S&P 500 index since November into the new year. Here, we take a technical approach to understand market positioning and investor behaviour in the latest ATEC rally, examining several factors to gauge price visibility a further down the line. I'll run through the following series of charts to display our assessment findings.
Net-net, we rate ATEC a buy at $12.50-$12.60 and believe there is scope for the stock to extend to price objectives of ~$15 then $20 in the medium term, a total of 19%-59% upside potential.
Exhibit 1. ATEC has bifurcated from the benchmark as the broad indices continue to reprice to the downside, offering an extended alpha opportunity
Data: Updata
ATEC market positioning, relative strength and rate sensitivity
Looking at the chart below [Exhibit 2], showing money/order flows in red and ATEC's relative strength versus the S&P 500 in black, there's been a high correlation between the pair.
In the back-end of 2022, ATEC exhibited large equity inflows to see it rally off its June lows. At the same time, its relative strength against the benchmark began to rally at pace, and has continued on trend to the present day.
This is important, as each period of inflows has corresponded with upsides on in price distribution. Similar relationships are noted to the downside. Further inflows could see ATEC gain in relative strength to the benchmark back at early FY21' highs, adding a further bullish tilt. We'll be watching money and order flow for ATEC very closely on this basis over the coming weeks and months to hopefully observe the same.
Exhibit 2. Correlation between money/order flows and ATEC relative strength to the benchmark
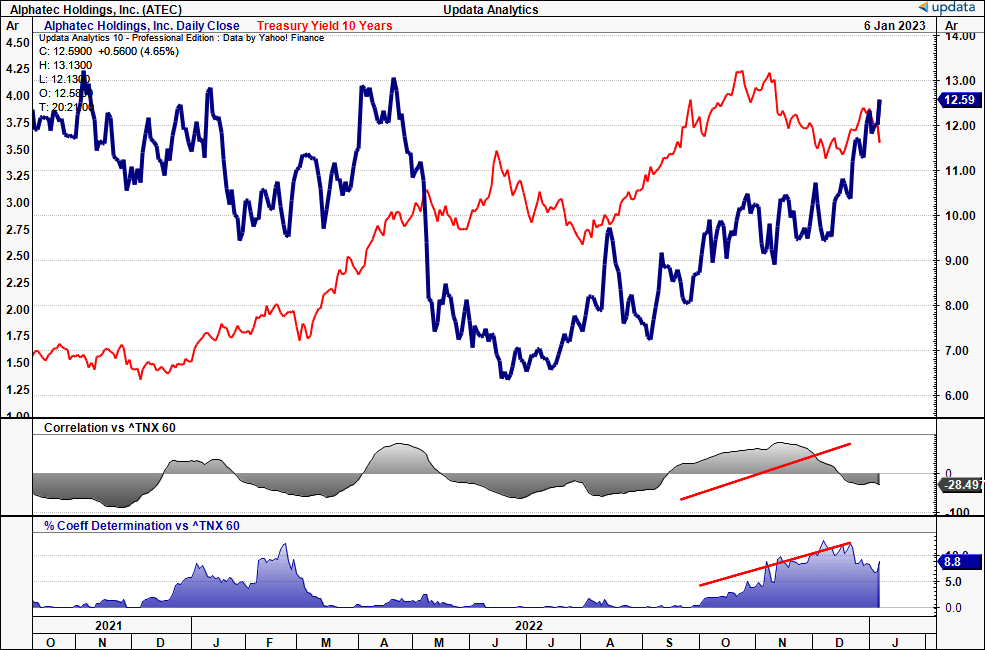
Given that it's been a rates-driven story for broad equity markets these past 12 months, it's essential to look ATEC's sensitivity to the rates volatility. You'll see below that ATEC has been a beneficiary of the repricing of treasury yields, with an upward bias alongside the UST 10-year [Exhibit 3].
This is illustrated in both the correlation statistic [black shaded line] and the coefficient of determination [r-squared, blue shaded line] which have both curled up since October FY22, demonstrating the above point.
There's good reason to believe that Treasury yields will either continue lifting, or that at least we'll be spending some time at these ranges in FY23'. This tells us that investors may continue rewarding ATEC irrespective of the rates volatility moving forward, definitely an upside factor in the risk/reward calculus.
Exhibit 3. ATEC displays upside sensitivity to surging treasury yields, and looks to have been a beneficiary of the re-pricing in rates
Another way we looked at the price action was examining the daily trends in volume, to provide confluence to the studies in Exhibit 2. To do this, we checked the positive and negative volume indices in relation to the daily volume trends [Exhibit 4].
For the positive volume index, it will show an increase when volume increases, and no change when it decreases. The opposite is true for the negative volume index. Combined, the indicators illustrate what the 'smart money' might be doing, as institutional investors are often more active when volume is low.
This is often the reason that we see a large breakout after volume dries up, either on daily or weekly time frames. In particular, increases in the negative volume index are said to illustrate the presence of institutional accumulation. Whereas, an uplift in the positive index is indicative of retail inflows.
What's pleasing to see, is that we have entries from both retail and institutional buyers based on the presentation of these studies. This, coupled with the corresponding daily/weekly volume trends, tells us that a good breadth of large buyers are present in this stock.
Exhibit 4. Positive and negative volume indices illustrating presence of institutional and retail buyers
ATEC Price distribution studies
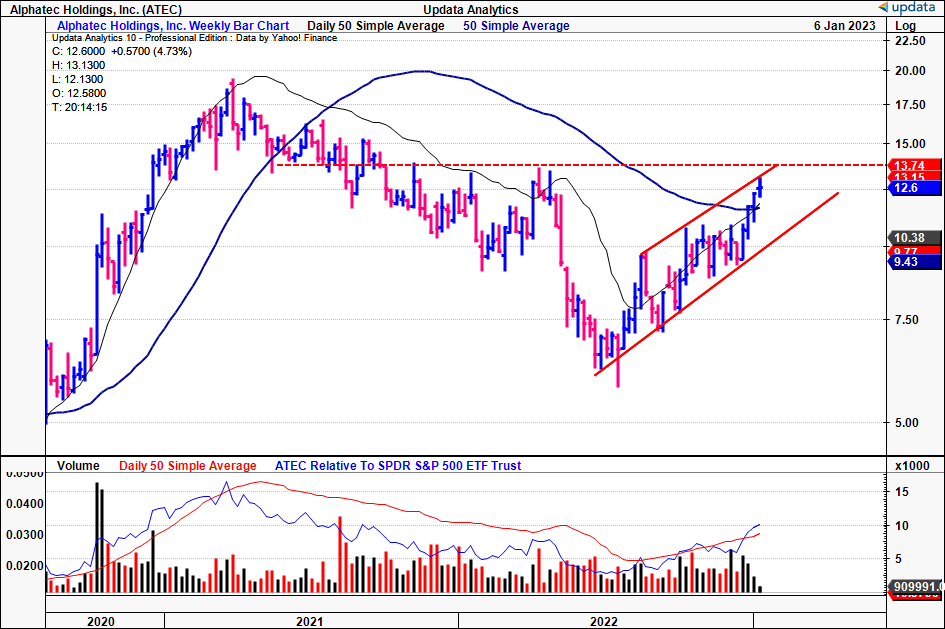
Looking at the weekly price evolution of ATEC across FY22, the stock rallied hard off its June lows and now rests above the 50DMA and 250DMA. In fact, it rode the 50DMA as a line of support since turning up, and traded within the ascending channel shown. It is now testing the ceiling of the channel, with a strong ascending base formed where it has bounced from support 3x.
The latest moves are still within the channel, and a breakout above the resistance level would need to continue for 3-4 weeks in order to avoid a sharp pullback, in our opinion. Looking at the longer-term resistance levels [shown in horizontal dashed line], ATEC is looking to test this level once again, having failed 3x in the past. Hence, this would be a key zone of infection for ATEC looking ahead, and we're looking for it to break this mark.
Exhibit 5. Weekly price distribution with shares in ascending channel off ascending base, trading above 50DMA and 250DMA. Looking to test and break longer-term resistance level
On that note, we looked at two Fibonacci retracements at different ranges to observe potential pricing objectives looking ahead.
First, looking at the May/June highs to the July low. Based on the retracement levels shown, it's already retraced ~95% of the down-move, and now looks to $13.70 as the next target. From there, we'd be looking at a further upside target to $23, as shown.
Exhibit 6. Fibonacci retracement from May-July lows, next targets $13.70 then $23
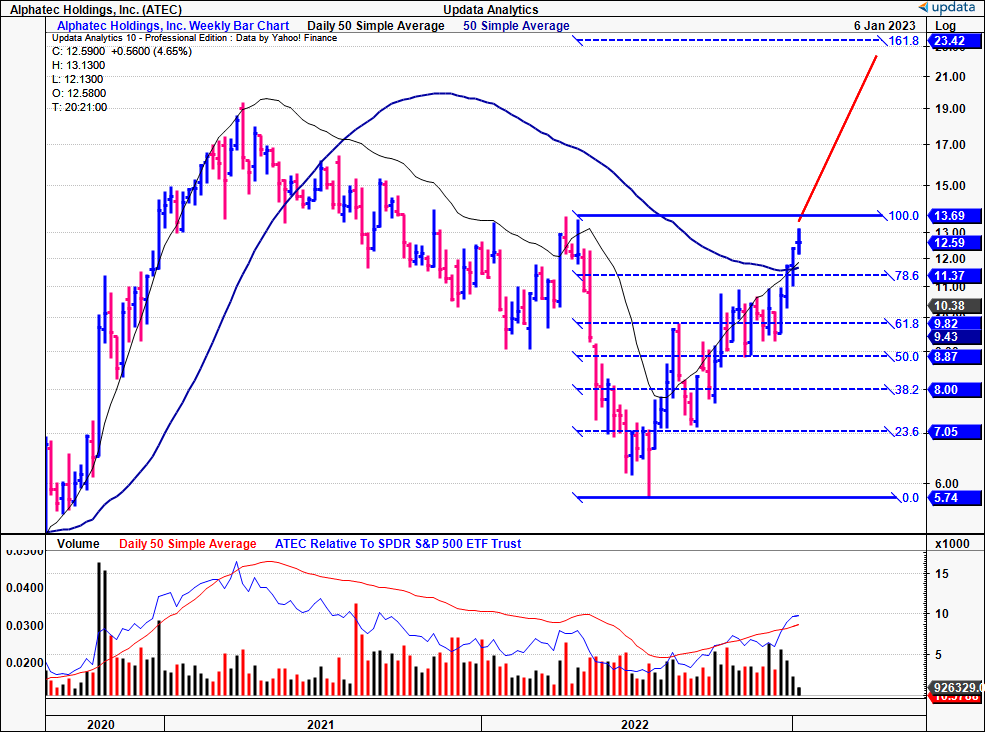
We did the same tracing the fibs down from ATEC's March FY21' peak [Exhibit 7] we're looking to targets of $14.30, representing 78% recovery, and then $19.30 to retrace 100% of the move. Hence, there's scope for ATEC to re-rate to the price ranges discussed here.
Exhibit 7. Longer-term Fibonacci trend down from March FY21' peak, next targets to $14.30 then $19.30
Next, we checked in on the trend-indicators that would give us objective insight into the directional outlook for ATEC.
You can see below that shares are trading above the top of the cloud, with all 3-indicators also positioned above the cloud as well [Exhibit 8, Ichimoku chart]. Importantly, the lagging line is well above the cloud, supported by on-balance volume, in-sequence with the previous volume studies above. Hence, we've got further confluence of buying support extending the upside. We'd also point out that momentum studies indicate there's velocity of price change corroborating the upside.
Exhibit 8. Trading above cloud support, confluence from on-balance volume and momentum. We are bullish on this setup
Data: Updata
Finally, we checked in on our point and figure studies on two different time frames to obtain objective price targets for ATEC.
In the weekly chart, we've got upside targets to $15.40, in-range with the objectives outlined earlier. Being that this is a weekly chart, these are longer-term price targets that we look to over the coming weeks.
Exhibit 9. Longer-term upside targets starting at $15.40
Data: Updata
Tightening it in on the daily charts, there are multiple targets pointing to the $13-$13.50 mark, again in support of the previously mentioned numbers. With these objective targets in mind, we're confidence in looking to the price objectives listed on our Fibonacci studies earlier.
Exhibit 10. Near-term upside targets to ~$13-$13.50
Data: Updata
In short
Based on this extensive market analysis, we believe there is scope for ATEC to extend its latest rally. The move looks justified from the presence of both institutional and retail buyers, and there's confluence on initial price objectives from ~$15 and then ~$20, a total of 19%-59% upside potential. A range of measures point to this suggested range, and the directional trend is well supported by various measures. Consequently, based on a technical outlook, we rate ATEC a buy at $12.50-$12.60, seeking a return objective to the targets listed above. Should it rally to this mark, we will re-evaluate the position. More importantly, if the stock pulls back more than 12% from the entry price of $12.50 [to $11.25], we will exit the position entirely. It can always be bought back at a later time, should this occur, and the stock rallies again. Net-net, rate buy.
For further details see:
Examining The Recent Breakout For Alphatec Holdings (Technical Analysis)