EXLS - ExlService Holdings: Overlooked Compounder That Keeps Delivering
Summary
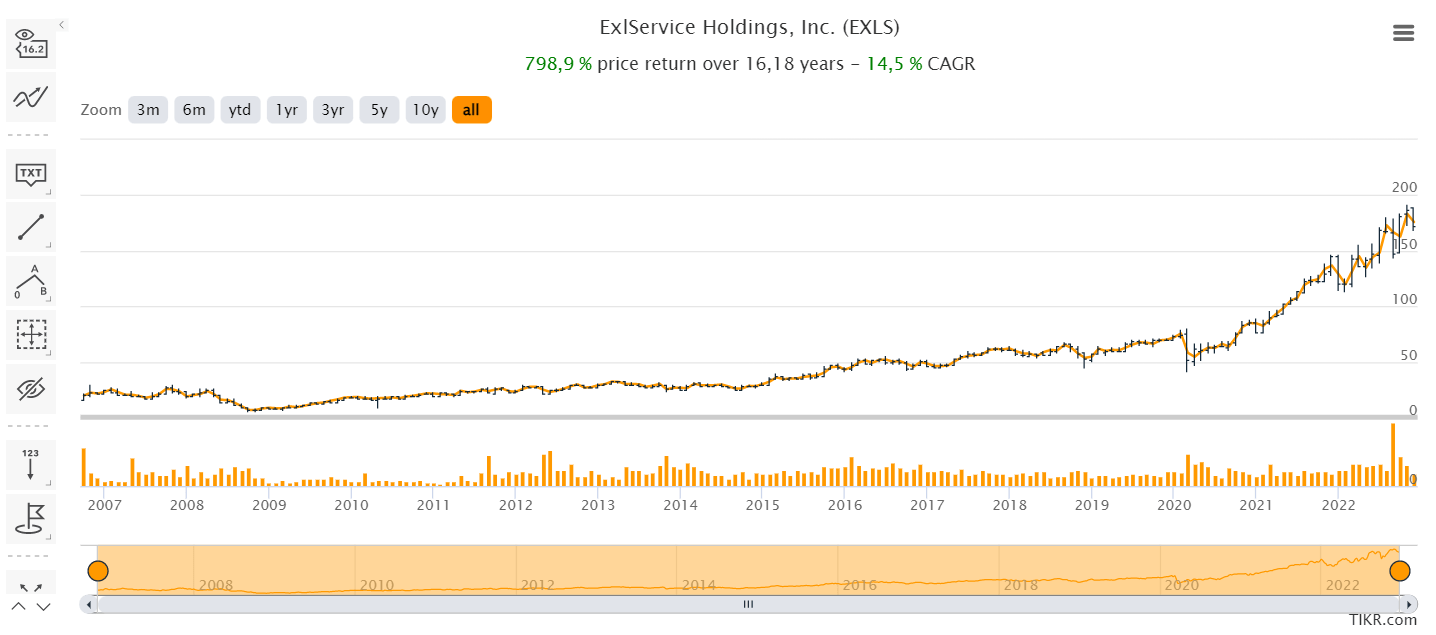
- ExlService Holdings, Inc. is a $5.7-billion mid-cap data analytics company that has been growing with a CAGR of 14.5% since going public >16 years ago (10-year CAGR = 20.6%).
- I believe ExlService is poised for long-term growth due to its diverse business model, strong financial stability, and targeted development strategy. It's further supported by a commitment to shareholder return.
- EXLS is trading at a relatively low valuation compared to its peers, despite delivering strong year-to-date performance.
- I assume the company will a) beat EPS guidance by ~5% and b) maintain its long-term P/E multiple of ~28x through the end of FY2023 - these assumptions lead me to a price target of $195 per share.
Intro & Thesis
ExlService Holdings, Inc. ( EXLS ) is a $5.7-billion mid-cap data analytics company that has been growing with a CAGR of 14.5% since its IPO 16.2 years ago (10-year CAGR = 20.6%):
I believe that this rapid growth will continue over the long term due to ExlService's a) well-diversified business model, b) relative stability, c) growth in the target market, d) strong financial performance, and e) clear development strategy and shareholder return policy.
The stock looks pricey, but in my opinion, Wall Street analysts are underestimating its future EPS growth. I rate the company a Buy, with a price target (end of calendar 2023) of $195 per share (~13% upside).
Business description & Financials
According to the most recent 10-Q filing , ExlService Holdings, Inc. is a data analytics and digital operations and solutions company that partners with clients to improve business outcomes and unlock their growth by bringing together deep domain expertise with robust data, powerful analytics, cloud, AI, and ML.
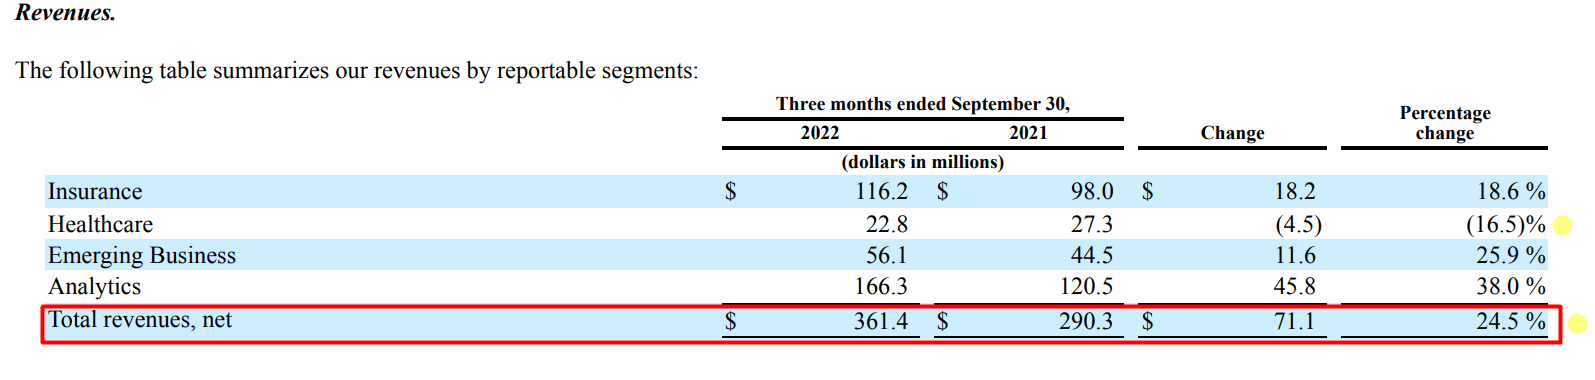
There are 4 reportable segments depending on the end customers: Insurance (32.15% of total sales), Healthcare (6.3%), Analytics (46%), and Emerging Business (15.5%). In itself, this listing of segments suggests quite good diversification by end markets - the company has no clear tie to the business cycle of any particular industry, which I think explains the rapid growth of its operations over the past 16 years.
ExlService's business model consists of the following 2 main revenue streams:
- Digital Operations and Solutions is a business unit that helps solve complex problems in the insurance, healthcare, and emerging business industries. This can include improving the insurance claims process, using advanced automation and robotics technologies, transforming customer experiences, and managing and improving various business functions. They either administer and manage these functions on an ongoing basis via longer-term arrangements or project work;
- Analytics is a business unit that helps the company's clients improve their outcomes by using data and data-driven solutions to gain insights and make informed decisions. This can be applied to all parts of the clients' businesses. The solutions offered by this business unit include services that help optimize healthcare and reimbursement, as well as predictive and prescriptive analytics for customer acquisition and management, risk assessment and management, credit, regulatory reporting, and payment integrity. These solutions also include tools for managing data and improving operational efficiency.
The effect of high-quality business diversification, which I briefly mentioned above, can be seen in the example of Q3 FY2022 when the YoY decline in Healthcare sales had no negative impact on overall sales growth due to its insignificant share:
EXLS's 10-Q [Q3 2022], author's notes
Almost all of the company's operational growth in the last quarter was organic (as was the decline in Healthcare):
Revenue growth in Insurance of $18.2 million was primarily driven by the expansion of business from our new and existing clients.
Revenue decline in Healthcare of $4.5 million was primarily driven by the ramp-down in certain existing clients during the three months ended September 30, 2022.
Revenue growth in Emerging Business of $11.6 million was primarily driven by the expansion of business from our new and existing clients aggregating to $13.8 million.
Revenue growth in Analytics of $45.8 million was primarily driven by higher volumes in our annuity and project-based engagements from our new and existing clients of $35.0 million, and contributions from our acquisition of Clairvoyant in December 2021 of $12.5 million.
Source: EXLS's 10-Q [Q3 2022], emphasis added by the author
According to Seeking Alpha data , in Q3 FY2022, the company beat revenue projections by $16 million (by 4.64%), nearly as much as the Clairvoyant acquisition (December 2021) brought in. In my opinion, that's often the beauty of such underfollowed stocks as EXLS - the small coverage of 3-5 analysts very often forgets to consider [or makes mistakes in considering] the latest corporate events and their real impact, which ultimately results in these stock consistently beating earnings (EXLS has outperformed 8 out of 8 recent EPS consensus estimates).
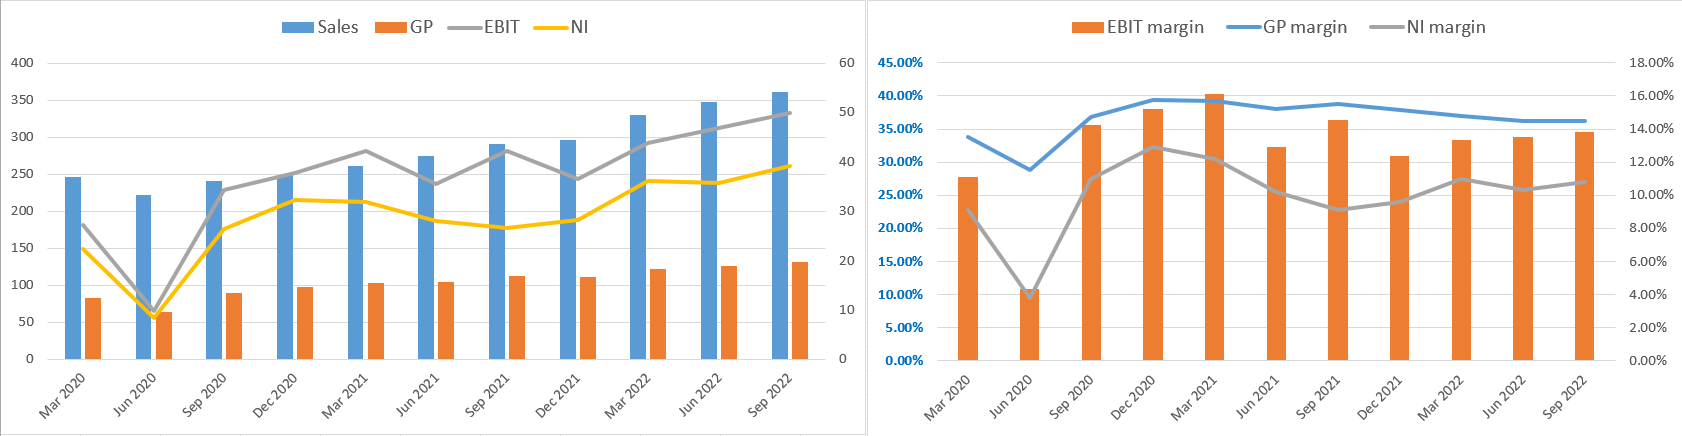
The company managed to maintain profitability even in June 2020, while many companies had obvious difficulties with it. In a very short time, the business returned on the right track and now continues to grow at a good pace while maintaining its usual marginality.
Author's calculations, based on Seeking Alpha
Looking at the company's cash flow statement, we can see that in terms of operations, the company continues to generate a lot of cash - in 9M 2022, CFO amounted to $111 million and change, down 11% year-over-year, but includes a one-time increase in unbilled receivables, which management says carry no material performance risk. In future periods, the company will recognize these receivables as revenue and the solidity of cash flows will again become more evident.
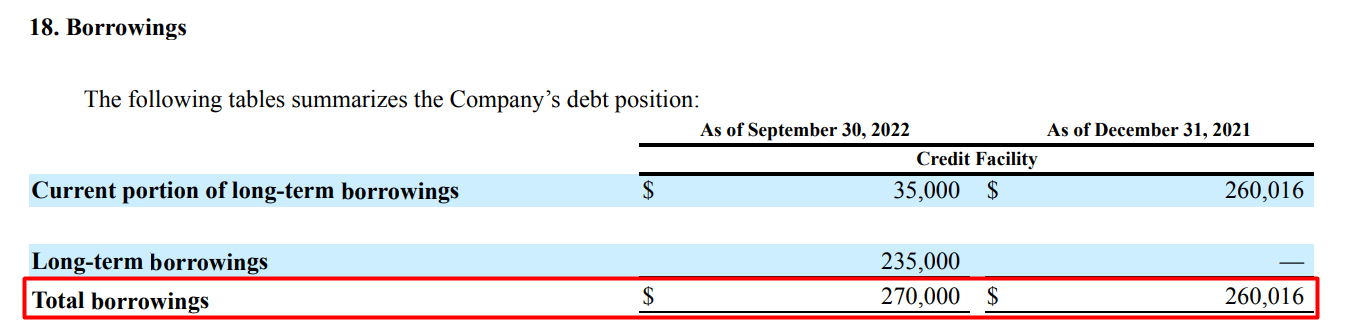
I am a little confused by the fact that EXLS spent 3.5 times more on total investments compared to last year (based on cumulative CFI numbers) and we see that it borrowed $235 million for this purpose - this happened immediately after the repayment of the old debt ($260 million under the "Current portion of long-term debt" line item on the balance sheet). As a result, EXLS's total debt has increased by 3.8% since the beginning of the year, while the interest is now many times more expensive.
On the other hand, interest expense as a percentage of total quarterly revenues is still below 1% (0.68%), which speaks to EXLS's credit strength - debt financing of CAPEX does not seem too risky to me in this particular situation. When we look at the company's addressable market and its prospects, it is immediately clear that these costs were necessary for future organic development - the average long-term CAGR of TAM is 8.56%, while even the most modest estimates tell us that the total TAM will exceed $1.4T in a few years:
| IT Services Market projections |
| Agency |
| TAM, current vs. last forecasted years |
| Long-term CAGR |
| Mordor Intelligence |
| - |
| 10.36% |
| Verified Market Research |
| $838B vs. $1731B |
| 8.50% |
| Techavio |
| $981B vs. $1459B |
| 8.27% |
| Statista |
| $1114B vs. $1570B |
| 7.10% |
Source: Author's compilation, links provided
Valuation & Expectations
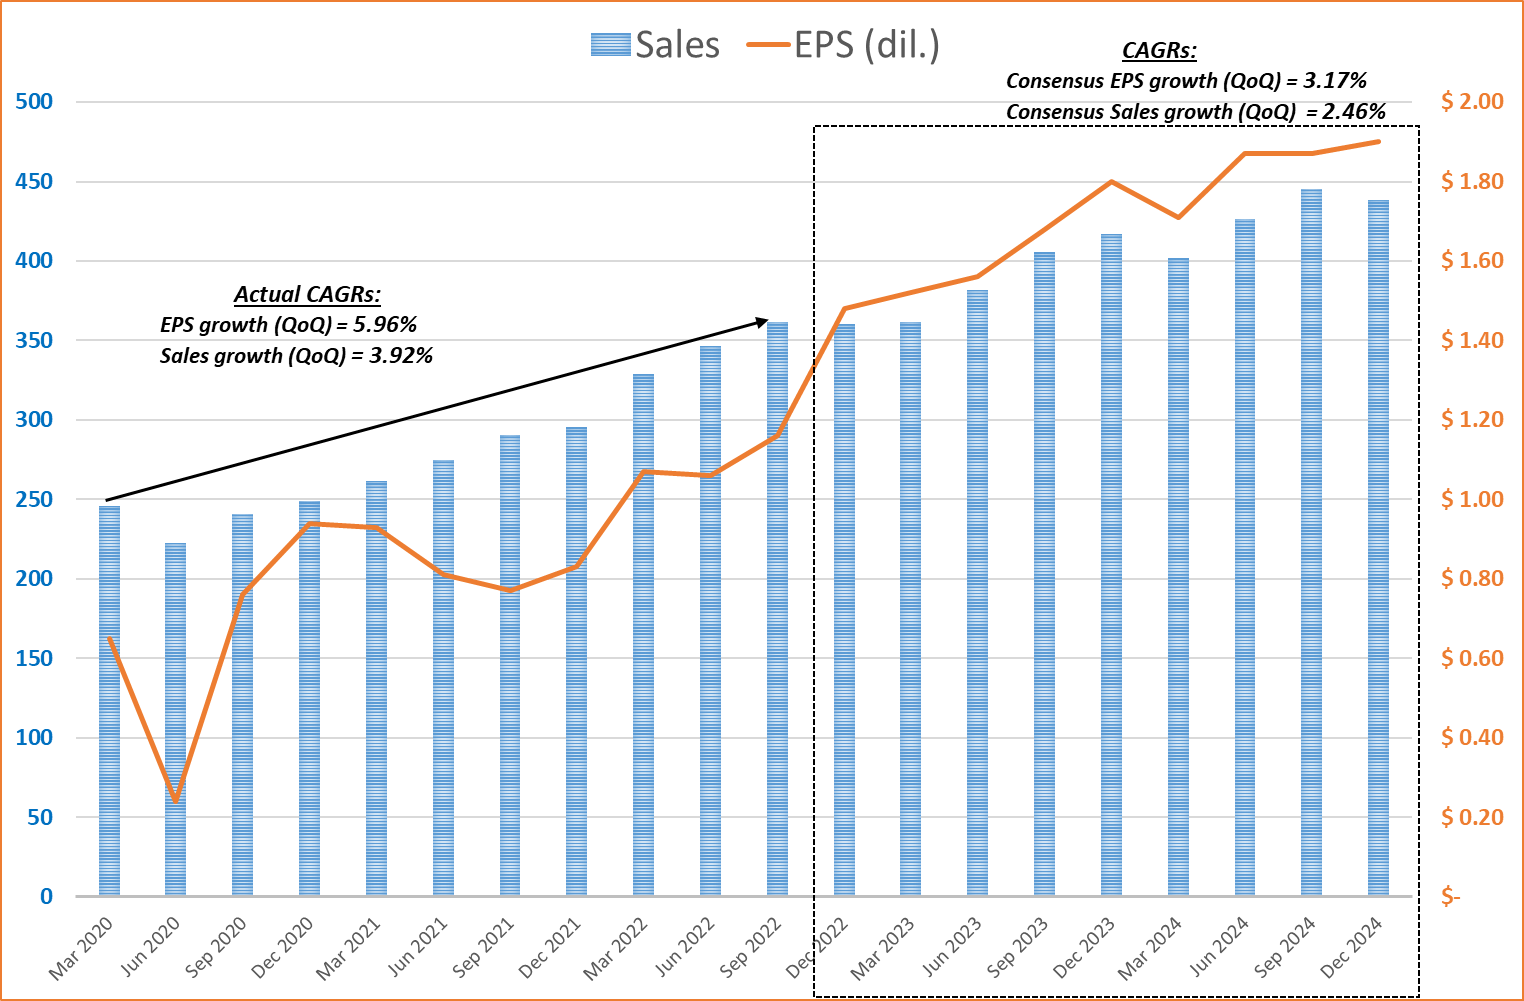
If we compare the growth of the company in the past with what the analysts are putting into the growth of the company now, we will see a pretty big discrepancy in the numbers. For example, the company's revenue and earnings per share have grown at a CAGR of 3.92% and 5.96%, respectively, over the past 10 quarters without any pronounced seasonality. If we mix the actual data with the forecast [consensus] data and continue the chart on the right, we see how the implied EPS CAGR falls to 3.17% and the CAGR of sales growth - to 2.46%:
Author's calculations, Seeking Alpha data
The Street's forecasts not only diverge from historical trends, but also from management's words - here's what Maurizio Nicolelli, EXL Services EVP and CFO said at JP Morgan's Ultimate Services Investor Conference [ November 2022 ]:
Our medium-term target for revenue going forward is between 11 and 13 percent overall for the company.
Our midpoint of our guidance for this year puts us at 18.3 percent. We've leveraged the company very well over the last two years. Going forward, we still think we can continue to drive margin, but it's incremental margin. Our guidance for the medium term is 18 percent plus, which essentially puts us in the 18 percent bracket. We're going to end the year in the low 18 percent range, but keep in mind, you still have headwinds in margins.
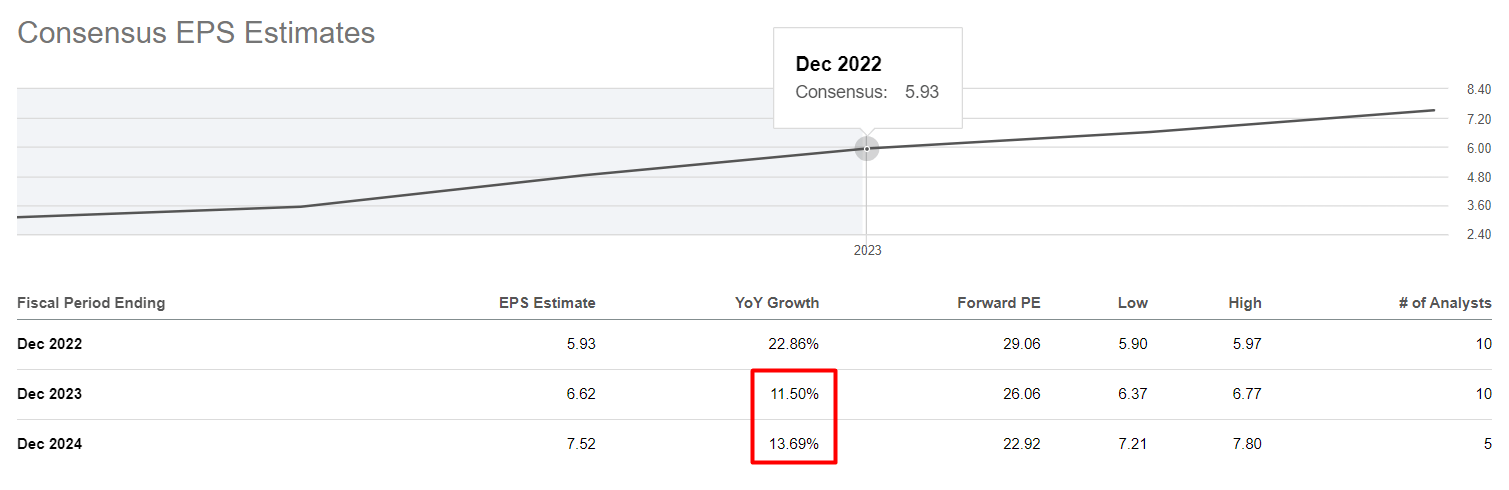
We continue to see EPS grow in double digits going forward for our medium-term targets.
We are talking about FY2023 - that is the medium-term target that Maurizio was referring to. According to him, we can expect double-digit EPS growth next year. But the Street prices the current price at the lower limit of that projection:
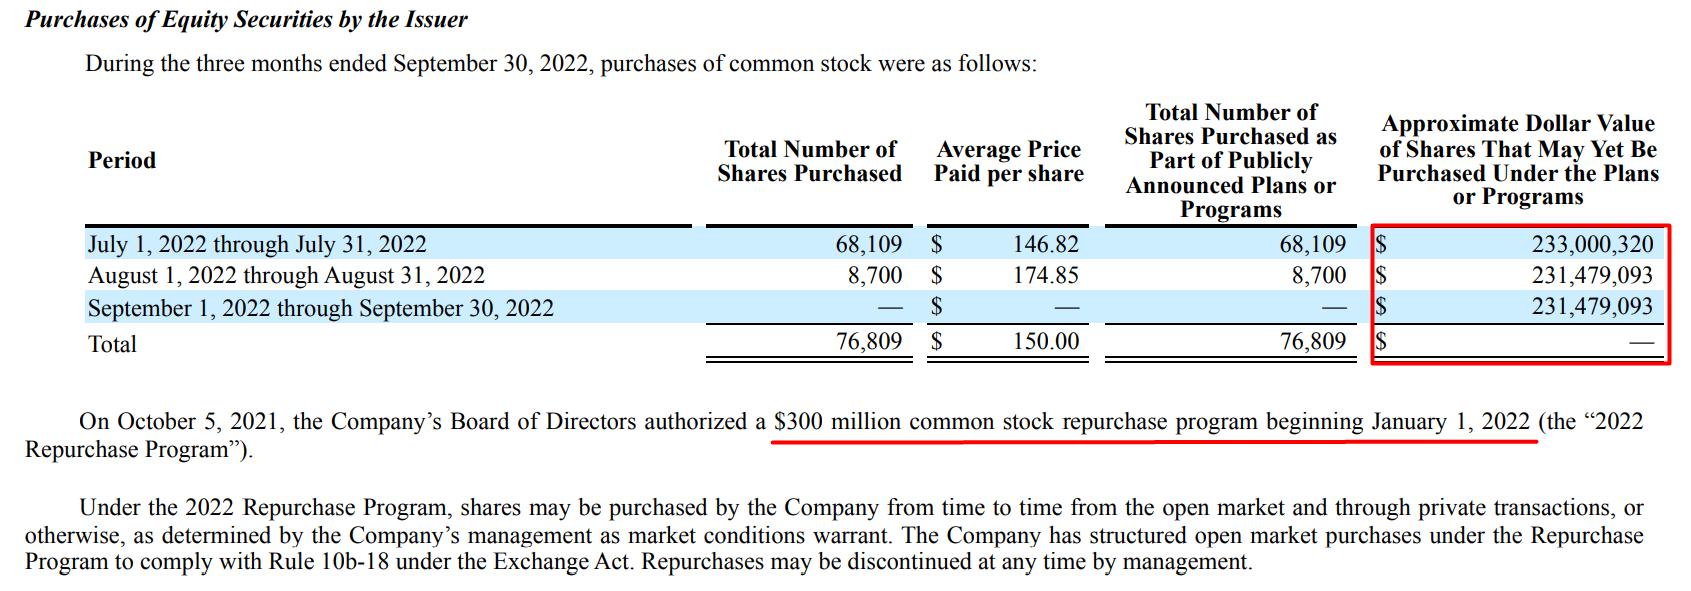
Considering that the company has reduced the number of its shares outstanding by 2.59% over the last 10 quarters ("compound quarterly decrease rate" of 0.26%), the current EPS forecasts can already be achieved thanks to the buyback program alone [i.e. excluding organic growth], of which more than 77% remains to be utilized:
And as we recall from the financial analysis above, the operating side of the business has sufficient cash flow to continue buying out periods of drawdowns in the stock.
Up to this point, I have only described the expectations - it's time to talk about EXLS's valuation multiples. Seeking Alpha gives EXLS a "D" grade [based on its Quant system], which is based on a comparison with the entire Information Technology sector . So I decided to narrow the list down to the major companies that qualify for comparison based on descriptions of their operational/business processes:
- SPS Commerce, Inc. ( SPSC );
- Insight Enterprises, Inc. ( NSIT );
- Perficient, Inc. ( PRFT );
- CSG Systems International, Inc. ( CSGS );
- Exponent, Inc. ( EXPO ).
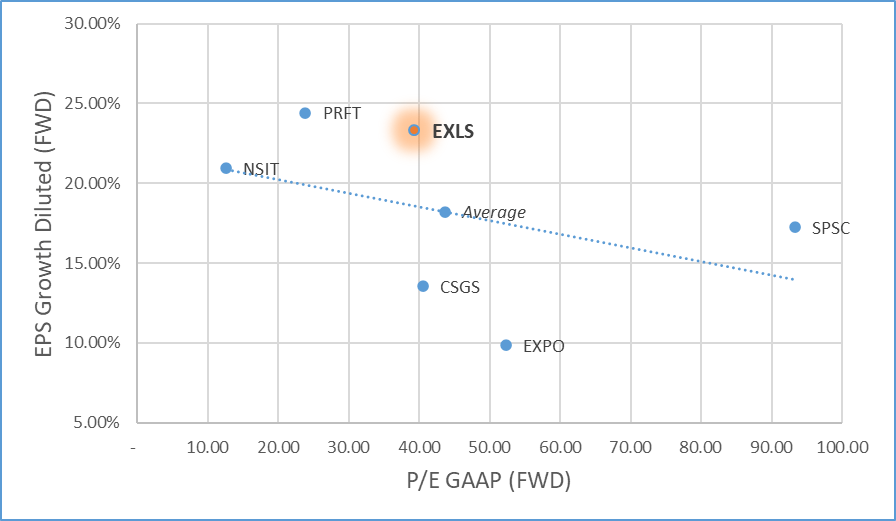
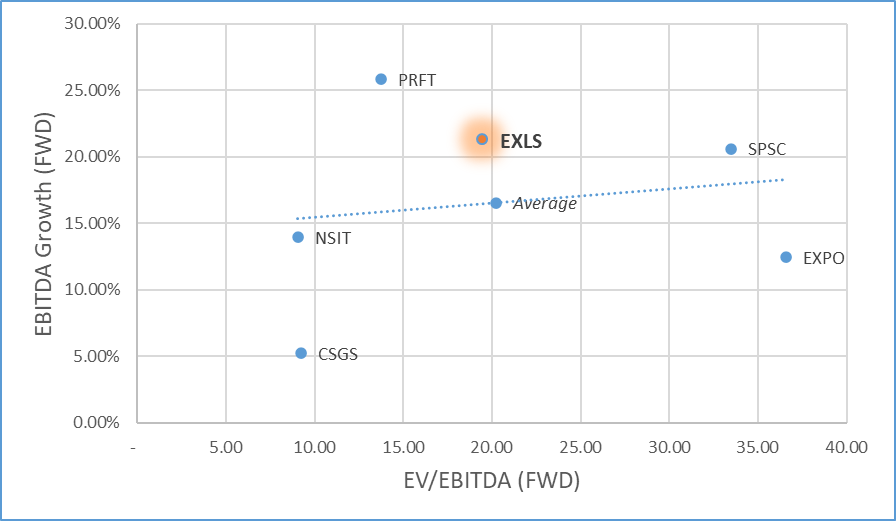
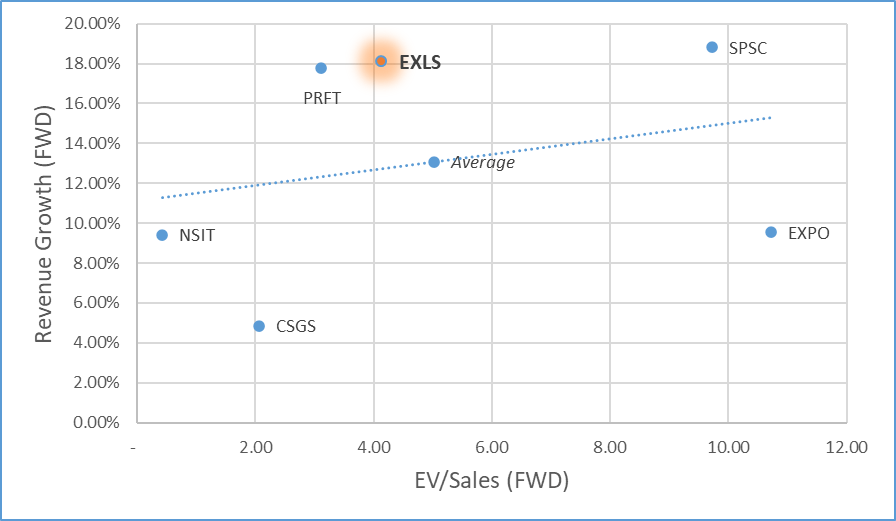
Normally, I consider the valuation of a company in the context of how its multiples compare to the growth expected from it in the relatively short term (1Y). This time, I propose to do exactly the same thing by placing the key valuation multiples on the x-axis and the corresponding growth rates on the y-axis:
Author's calculations, Seeking Alpha data Author's calculations, Seeking Alpha data Author's calculations, Seeking Alpha data
Based on the charts above, EXLS is trading at a relatively low valuation compared to its peers, despite delivering strong year-to-date performance:
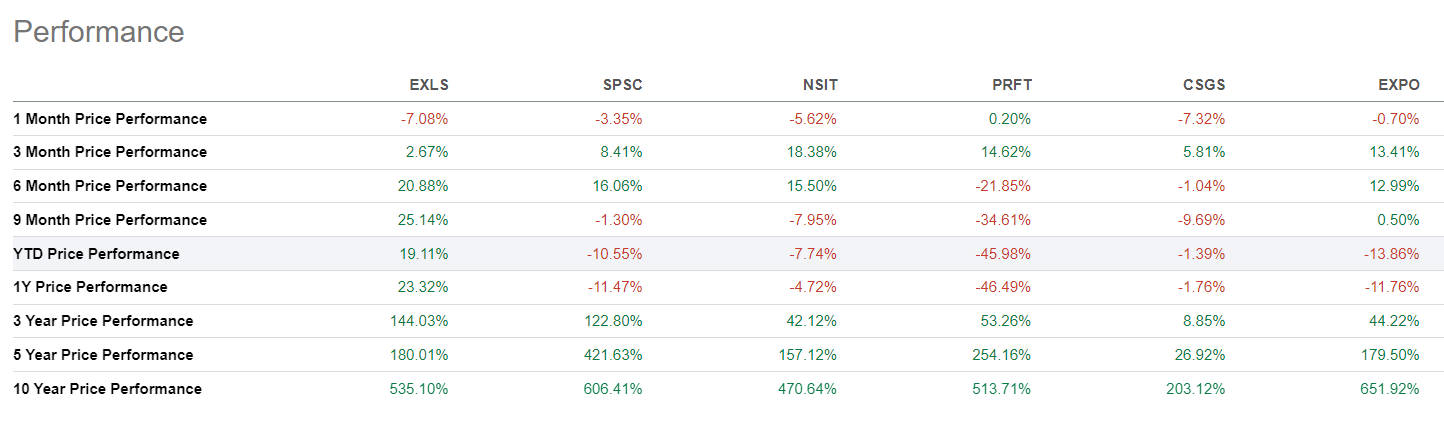
Perficient Inc. may be the only stock to rival ExlService Holdings in terms of relative valuation, but as we can see, this was the result of its sharp decline in 2022. In terms of the momentum factor, EXLS is unmatched among its peers by market capitalization and industry affiliation.
Bottom Line
The main risk for my thesis today is the EPS recession in the U.S. Once companies feel pressure on margins, they start to get rid of unnecessary expenses, under which various IT providers may fall.
Apparently, this risk will indeed occur in 2023. Enterprise Technology Research surveyed Fortune 500 companies, and based on the results , we see that IT spending will likely actually decline in the short term - something to keep in mind for anyone waiting for unprofitable tech stocks to grow next year:
ETR data, shared by @mdsmaldon [Twitter account]
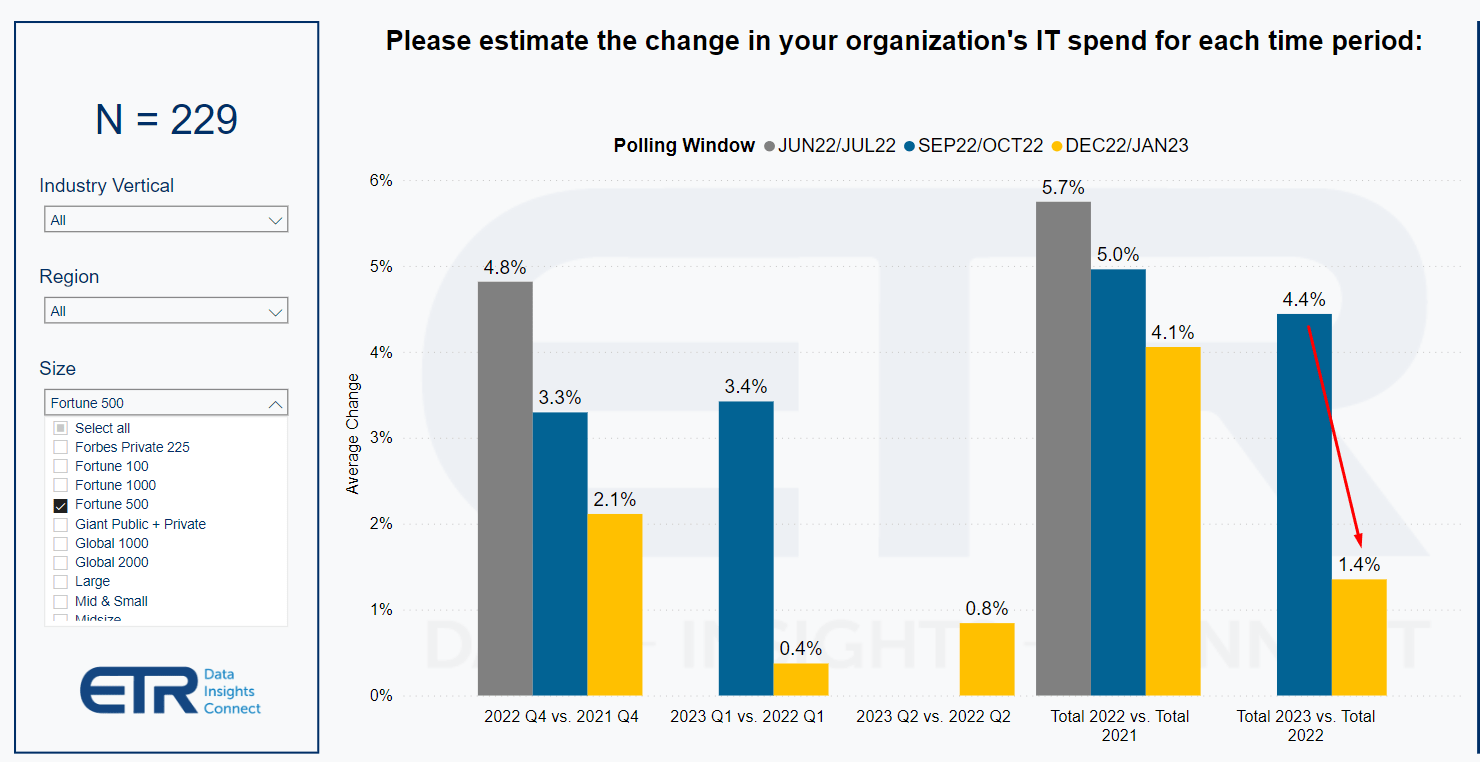
But you also need to understand that even the coronavirus in 2020 has not made ExlService's business unprofitable.
Since its IPO, the company has gone through various development cycles but has always been able to increase its financial performance in the long term. For example, ExlService has recorded the following CAGRs since 2006:
- Revenue per share = 13.41%;
- Earnings per share = 12.78%;
- FCF per share = 15.19%;
- Book value per share = 8.61%;
- Net profit = 15.43%;
- Common shares outstanding growth (stopped growing in 2006) = 2.28%.
Source: Author's calculations, based on Roic.ai data
Overall, I expect ExlService to be ready to face any challenges in 2023 after the capital expenses of the past period. A healthy balance sheet and high-quality business diversification will help it.
Based on the above, I assume the company will a) beat EPS guidance by ~5% and b) maintain its long-term P/E multiple of ~28x through the end of FY2023 - these assumptions lead me to a price target of $195 per share, which represents an upside potential of ~13% from the last closing price.
Thank you for reading!
For further details see:
ExlService Holdings: Overlooked Compounder That Keeps Delivering