WMT - Expedia Seems Undervalued: Travel To Regain The Past Highs (Technical Analysis)
2023-08-17 04:02:38 ET
Summary
- Expedia's fundamental performance has shown strong recovery, with a healthy profit and significant reduction in debt.
- The company has experienced growth in revenues, loyalty customers, and active app users, with double-digit growth expected for 2023.
- Regression models indicate that Expedia is heavily undervalued, with significant discrepancies between current valuation multiples and predicted values.
Investment thesis
This article presents my view on Expedia's (EXPE) strong recovery post-pandemics and my opinion that the stock is undervalued according to the valuation exercise based on regression models. The Buy recommendation is concurred by the technical analysis showing signs that the stock is currently under accumulation.
Fundamental performance
While caught up in the tech sell off in 2022, Expedia Group performed in FY 2022 in a spectacular manner, moving from the net income loss for FY 2021 of nearly $270 M to a healthy profit of $352 M for the full 2022. The diluted EPS for the end of FY 2022 was $2.17. The overall results when it comes to the fundamentals were also positive for the full-year free cash flow which grew to $2.8 billion, over 70% higher than 2019. Expedia reduced debt by $2.2 billion in 2022, resulting in a significant reduction in leverage. The company repurchased 5.2 million shares for approximately $500 million for the year, out of which approximately $350 million in shares in Q4 of 2022. Expedia entered FY 2023 with levels of shares remaining under the existing authorization for future repurchases at approximately 18 million shares.
Expedia Group Reports Fourth Quarter and Full Year 2022 Results (Expedia IR site)
Expedia, as the whole travel and hospitality sector, made understandable comparisons to the pre-pandemic results as the benchmark, hence the comparisons to 2019 appear in the earnings calls but this reference disappeared as of Q1 2023 calls. When you discount the global epidemic, the “only” major global problems you are left with are weather anomalies, wars, and energy prices, but even taking this into account, as CEO Peter Kern remarked, “ people are prioritizing travel over just about everything ”. Indeed, 2022 was a very good year for the company to have grown revenues by nearly 20% in comparison to the pre-pandemic . Expedia US grew new loyalty customers by over 300% and entered 2023 with nearly 70% more active loyalty members than any prior year, and almost 60% more active app users. Expedia dealt also with a big chunk of migration of its brands and geographies to the common platform, which continues in 2023. The guidance for 2023 is established to be double-digit growth on both the top and bottom lines.
Forward to Q2, the reported quarter was record high as the Adjusted EBITDA ($747 million) increased by 15%, providing 190 basis points of margin expansion, compared to 2022, while the B2B revenue at $861 million was also a record, an increase of 32% YoY. Expedia closed Q2 with significant earnings growth: a net income of $385 million, compared to a net loss of $185 million in 2022. Adjusted net income was $428 million, an increase of 38%, compared to 2022. The business notable news for Q2 was the launch of the loyalty program One Key in the US, promoted as the most flexible travel rewards program in the industry, and a new partnership with Mastercard ( MA ), as well as the first-ever travel benefit for Walmart Plus members ( WMT ). The One Key development will affect the marketing costs since all legacy loyalty programs will be now merged into one, and it is expected to help grow the margins in the back half of 2023. The noticeable trend continuation across geographies and preferred travel was stronger growth in APAC and Latin America, while North America and Europe have remained stable. For curious readers, travelers worldwide seem to continue to favor shorter stays in urban locations versus longer trips in sun and ski destinations.
Expedia’s strategic move from a transactional business model to life experience has paid off in the growth and retention of the loyalty members and app users: Q2 active loyalty members hit new highs and were up 15% YoY in our core brands, and the percentage of bookings coming through the apps was up 300 basis points sequentially versus Q1. No article nowadays seems to afford to skip the topic of AI and ChatGPT, so I’ll refer to the development on this front:
“earlier this year, we launched conversational trip planning, powered by ChatGPT and the Expedia iOS app. And last month, we launched it on the Expedia Android app. We have been learning from consumer interactions and are adding a number of new features to help consumers on their journey of discovery. Travelers can now start a new conversation by choosing from suggested prompts, and soon they will be able to return to a conversation at any time and even respond throughout a conversation by simply choosing a suggested response, all of which is designed to bring them one step closer to booking their desired trip.”
Financially speaking, the revenue of $3.4 billion was up 6% YoY, in line with the mid-single-digit top-line guidance, and was the highest second quarter on record, allowing the total revenue margin increase of 10 basis points to approximately 12.3%.
The headwinds for Q2 (comparing YoY) included FX affecting ca. 40 basis points to gross bookings, 170 basis points to revenue, and 530 basis points to EBITDA. Expedia suffered also an approximate 80 basis point headwind to the EBITDA margin. Nevertheless, given the view of the share price is undervalued, Expedia continued in Q2 its opportunistic and accelerated buybacks, totaling $1.2 billion year-to-date.
Predicting Multiples from Regression Models
The analysis uses the January 2023 regression models provided by Professor Aswath Damodaran on his site. The models are calculated each January for the key global markets, with the US market as a separate one.
According to this approach, a company's current trading multiples are compared to the same company’s predicted multiples based on regressions calculated from the state of the whole market in which it operates. Therefore, we are not seeking to draw conclusions from comparing the current trading multiples between a company in question and its sector peers or other companies with similar risk, growth, and cash flow (which is professor Aswath Damodaran’s definition of the “comparable” firms). Instead, we are looking for the relative difference in the form of the ratio between the current value and predicted value (i.e. difference of current minus predicted, divided by predicted). As a result, a company that trades currently in the market at a multiple lower (higher) than the one predicted from the market regressions based on the aggregate market data of all the companies in this market, is undervalued (overvalued). If we compare two companies and more, the one which has the biggest negative ratio is the most undervalued, while the one that has the biggest positive ratio is the most overvalued by the market. If you want to read more about this approach, check my article on Adobe (ADBE), where I present in more detail the regression equations and explain how I use them.
The multiples I will analyze here are for Price-Earnings to Growth ((PEG)), Price to Book Value (P/BV), Enterprise Value to Invested Capital (EV/IC), Enterprise Value to Sales (EV/Sales), and Price to Earnings (P/E). In the tables below they are presented in the descending order of a statistical value of R-squared, that is to say, by their explanatory power. I am skipping EV to EBITDA multiple due to its insignificant R-squared.
Is Expedia relatively under- or overvalued?
To perform this analysis, I collected the inputs for the fundamental values of Expedia. Find them in the tables below.
| Inputs |
| Value for EXPE Aug 16, 2023 |
| Source |
| Payout ratio or alternative "1- g/ROE" for stocks not paying dividend |
| 0.3386965377 |
| calculated alternative due to the null payout |
| gEPS - 3-5 years forward growth prediction by analysts/ to use also as a proxy for g of Sales on EV/IC |
| 0.3247 |
| LN of gEPS for the PEG calculation |
| -1.12485 |
| own calculation |
| B - beta of company, last 24M |
| 1.51 |
| Seeking Alpha |
| ROE = NI/ BV Equity TTM |
| 0.4910 |
| Seeking Alpha |
| ROIC - Return on invested capital = ROC = EBIT (1-t) / (BV of Debt + BV of Equity-Cash) TTM |
| 0.1116 |
| DFR = Debt to capital ratio = Total Debt/(Total Debt + Market value of equity) Q2 2023 |
| 0.2898 |
| own calculation, data from Seeking Alpha (in $ B: Market Cap: 16.05 ; Total Debt Q2 2023: 6.549) |
| Tax rate = Effective tax rate = Taxes paid/ Taxable Income; FY 2022 |
| 0.36 |
| Operating Margin = Pre-tax Operating Income/ Sales TTM |
| 0.1024 |
| as EBIT margin, Seeking Alpha |
If we apply these financial data to the regression equations provided by Damodaran, we receive the predicted values of the multiples. See the results below.
| Regression equations for year 2022 |
| R-squared |
| Predicted multiples |
| EV/Invested Capital= 3.53 + 1.30 g + 7.30 ROIC – 4.20 DFR |
| 0.567 |
| 3.550 |
| PEG = 6.71 + 1.20 Payout – 1.57 ln(gEPS) -0.77 Beta |
| 0.566 |
| 7.720 |
| P/BV= 2.32 + 4.60 gEPS - 1.33 Beta + 8.90 ROE + 0.80 Payout Ratio |
| 0.369 |
| 6.446 |
| EV/Sales = 2.32 + 2.60 g + 10.60 Oper Margin -1.40 DFR- 3.50 Tax rate |
| 0.306 |
| 2.584 |
| P/E = 8.63 + 2.23 Beta + 46.20 gEPS + 19.30 Payout |
| 0.25 |
| 33.535 |
We can compare now the predicted values of multiples to the values that are actual and based on stock price and raw financial data as of the day of writing. As I mentioned above, the comparison of the predicted vs actual values indicates the theoretical over- or undervaluation in the context of the aggregate data of all companies in the US market.
| Multiple |
| Predicted values of multiples |
| Currently trading at |
| Source of current multiple |
| Undervalued or overvalued by the US market values |
| EV/IC |
| 3.550 |
| n/a |
| own calculation |
| n/a |
| PEG |
| 7.720 |
| 0.36 |
| Seeking Alpha, forward PEG (forward Non-GAAP PE Ratio divided by EPS long-term growth consensus estimate for 3 to 5 year) |
| -95.34% |
| P/BV |
| 6.446 |
| 9.19 |
| Seeking Alpha, TTM |
| 42.57% |
| EV/Sales |
| 2.584 |
| 1.4 |
| Seeking Alpha, TTM |
| -45.82% |
| P/E |
| 33.535 |
| 20.02 |
| Seeking Alpha, P/E GAAP TTM |
| -40.30% |
Based on the ratios between current valuation multiples and regressions we can appreciate the scale of differences and try to establish a predominant inefficiency of the market. Starting from PEG predicted by the regression model (7.72) compared to the current forward PEG of 0.36, the conclusion that we can draw is that Expedia is extremely undervalued and the current value is less than 5% of what comes from the regression equation. Following the order of undervaluation, Expedia misses nearly 46% of its “fair” EV/Sales as well as a bit over 40% of its predicted P/E. These are quite big discrepancies between the views of the market against the value of the company. I would like to underline here that the Payout input has been replaced by the alternative equation usually proposed in the valuation textbooks, which is “1- g/ROE”, sending us back to the growth and profitability of the company. Moreover, while regressions for PEG and P/E share similar inputs (with the exception of log natural of growth in the PEG regression), the EV/Sales regression offers a complementary look at the valuation because it relies on three inputs that do not appear in other equations. Hence, the fact that predicted EV/Sales compared to the current value of EV/Sales results in an undervaluation and of similar scales as the difference for P/E, confirms for me the robustness of exercise. The only overvaluation result comes from comparing the P/BV. It is quite high, nearly 43% over the regression predicted value.
Overall, the predominant conclusion of the regression exercise is that Expedia is heavily undervalued according to three equations out of the four that have comparable values. The current value of EV/IC is not readily available in public and free sources, so I only calculate it on the basis of the regression equation for the reason of its highest statistical explanatory value (from all the equations presented by Damodaran). It may be used by the reader to compare separately the companies analyzed in my individual articles amongst themselves.
Technical analysis
I will analyze Expedia from a perspective of a number of technical analysis tools and show the screenshots on the monthly and weekly Heikin-Ashi candles charts - each timeframe presented through two separate sets of indicators which I bundled in views called Chart 1 and Chart 2. Those two timeframes will be complemented with a simplified daily Renko chart to reflect the price momentum. The details of my methodology can be found in my previous articles as those on Salesforce (CRM) or Adobe.
-
The Long-Term Trend
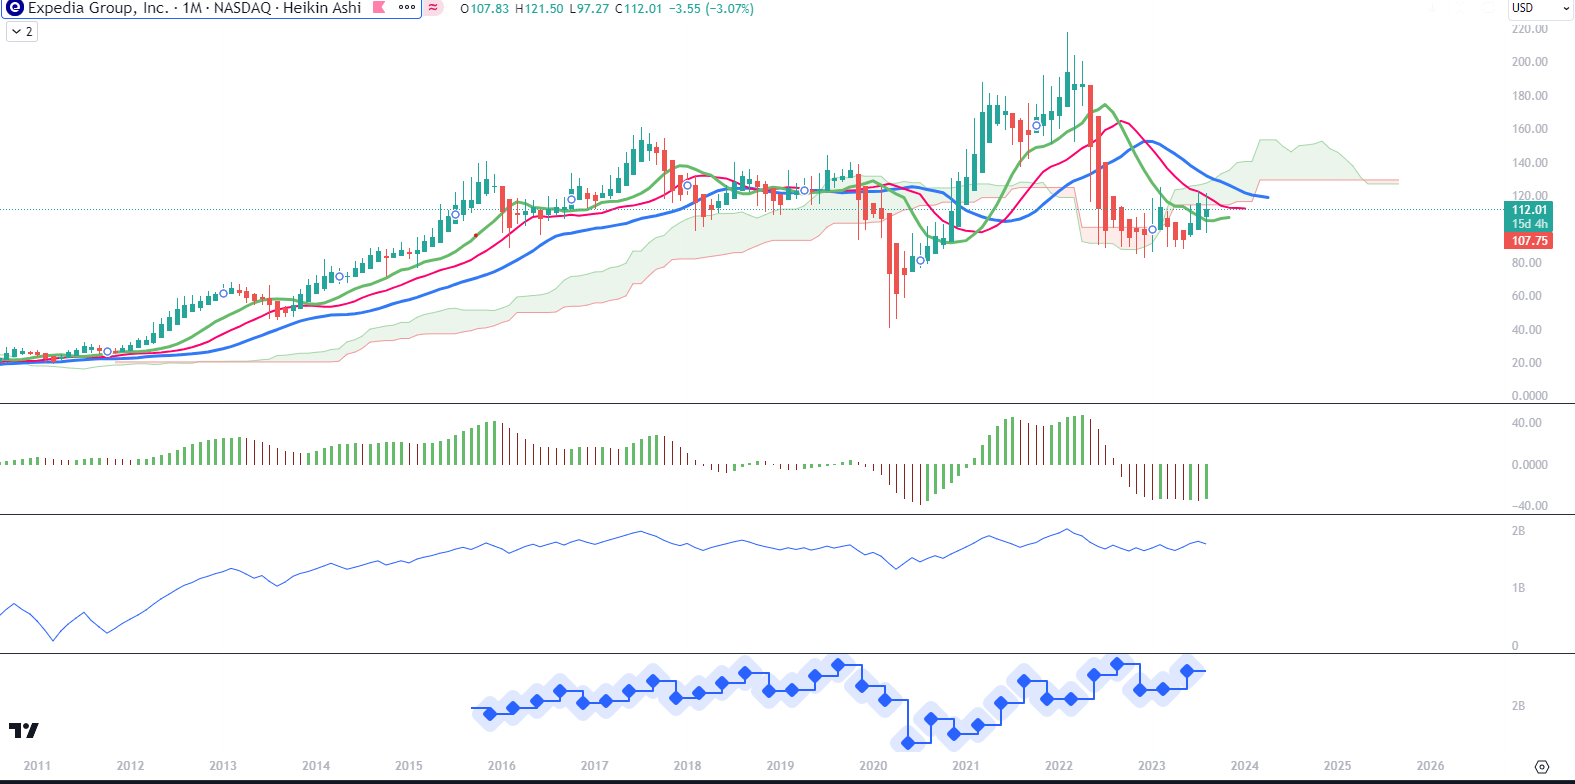
For long-term trend analysis, I use monthly charts. In Chart 1 setup, we see the August green Heikin Ashi candle starting already above the level of the green line of Alligator, which is the Lip line. The lines are in the bearish order since the Lip line is under Teeth (red) and the top one is Jaw (blue) but they are flattening and the Lip line is picking up towards the Teeth line. Ichimoku Cloud extension to the future is still red but it is also quite narrow, creating a very stable S/R level around $125-130. These levels go back to narrow ranges in 2018 and 2019. The Awesome Oscillator is still under zero. The change of depth of the bars is not very steep, like for example the recovery in the second half of 2020. In my opinion, this current turnaround of the price seems to have little energy and can be prolonged. The On Balance Volume (OBV) line is rising but without dramatic shifts. The bottom pane is indicating Revenues. Overall, this chart shows a picture of accumulation and/ or indecision.
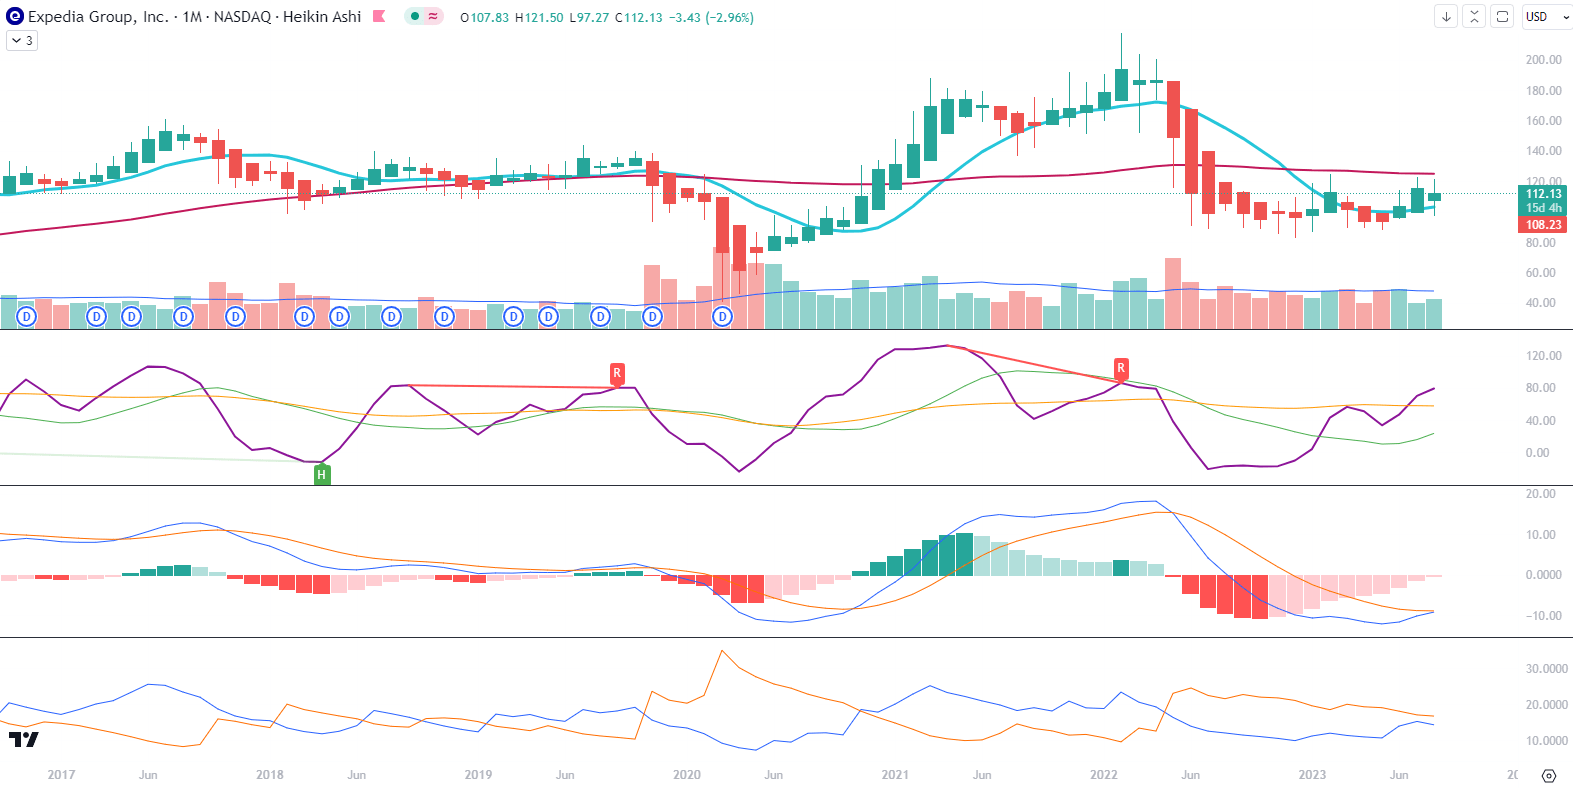
In Chart 2 setup, the 10-month Moving Average is now picking up after having flattened below the 50-month MA. The Composite Index Divergence Indicator (CIDI) is above both fast (green) and slow (orange) moving averages, and the fast one is approaching the slow one from below. Moving Average Convergence Divergence (MACD) is currently crossing its signal from below, but they are both below the zero level. Combined with the Positive Direction Indicator (DI+) line moving closely under the Negative Direction Indicator (DI-), I see mentioned technical signals that are not yet fully aligned but also do not contradict each other. On this timeframe and on both chart set-ups I would not be predicting a dynamic breakout any time soon. Nevertheless, one can also take advantage of the boring and slow convergence of technicals in order to spread the accumulation. I do not think that price will drop anywhere below $93 in the potential shakeouts if the accumulation is really taking place.
-
The Mid-Term Trend
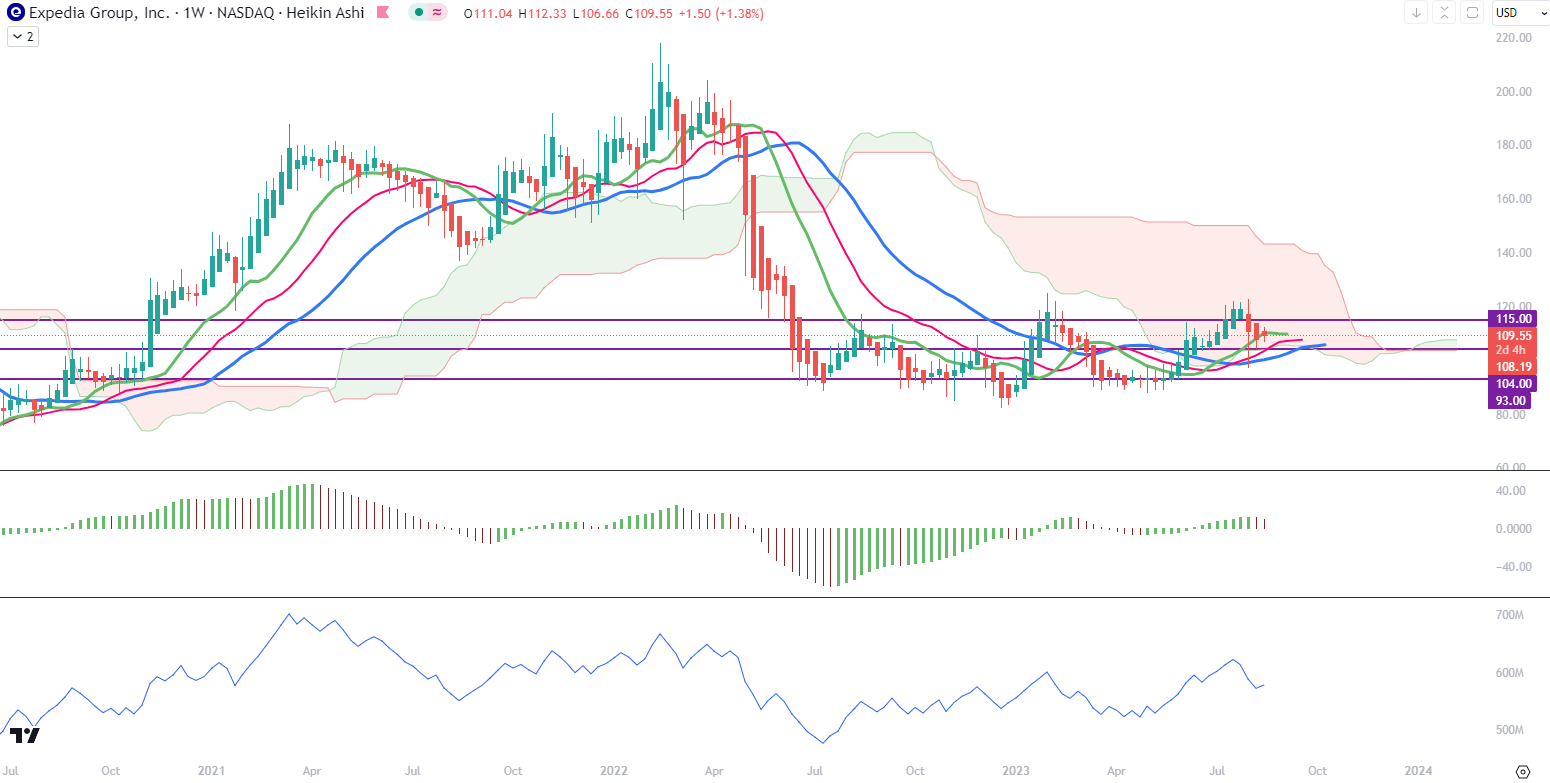
For the mid-term trend analysis, I use weekly charts. In Chart 1, I have drawn three S/R lines on the levels of $93, $104, and $115, which overlap with some of the Ichimoku Cloud’s edges, both from the past and in the projection to the future (which is also based on past prices). Ichimoku Cloud has changed into green but is still quite narrow. Alligator’s lines have made positive crosses and are now flattening to accommodate the recent drops in price. Negative momentum on this timeframe is also visible on the red bar of AO, but this indicator is already in the positive territory. As we see with OBV, the line has made new higher highs and higher lows, showing an increase in buying.
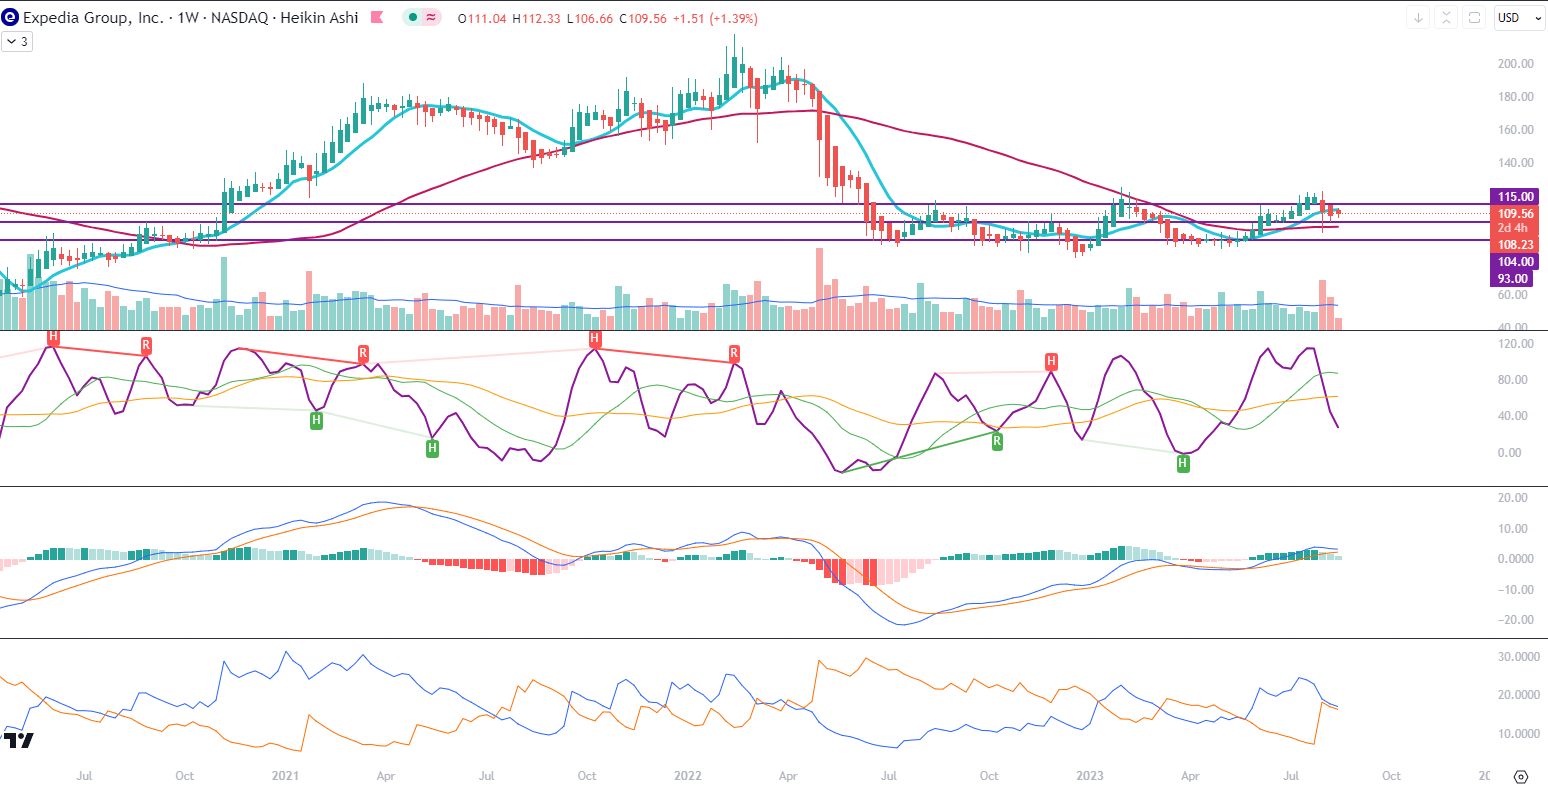
In Chart 2, the 10-week MA is above the 50-week MA, and the latter has flattened which I find to be a positive sign. CIDI has plunged under both slow and fast averages, possibly to make a U-turn in the coming 4-5 weeks. MACD and its signal are above the zero line but a crossing of MACD under the signal is to be expected. DI+ is also dangerously close to the DI-. This timeframe is, again, a picture of indecision. With the upcoming wave of the 13F forms from the Institutional Investors, we will soon be able to find out what the Q2 predominant transactions were when the prices oscillated in the nineties.
-
Price momentum
On the daily Renko chart, Expedia’s stock is kicking off a positive momentum with the blue 10-box MA crossing currently above the red 50-box MA line. Also, MACD and its signal have just emerged above the zero line, which happened for the last time in August 2020 (if we discount the last change of stock from strong to weak hands in April 2022, on the highs). This chart is the most positive when it comes to the technical view of the momentum.
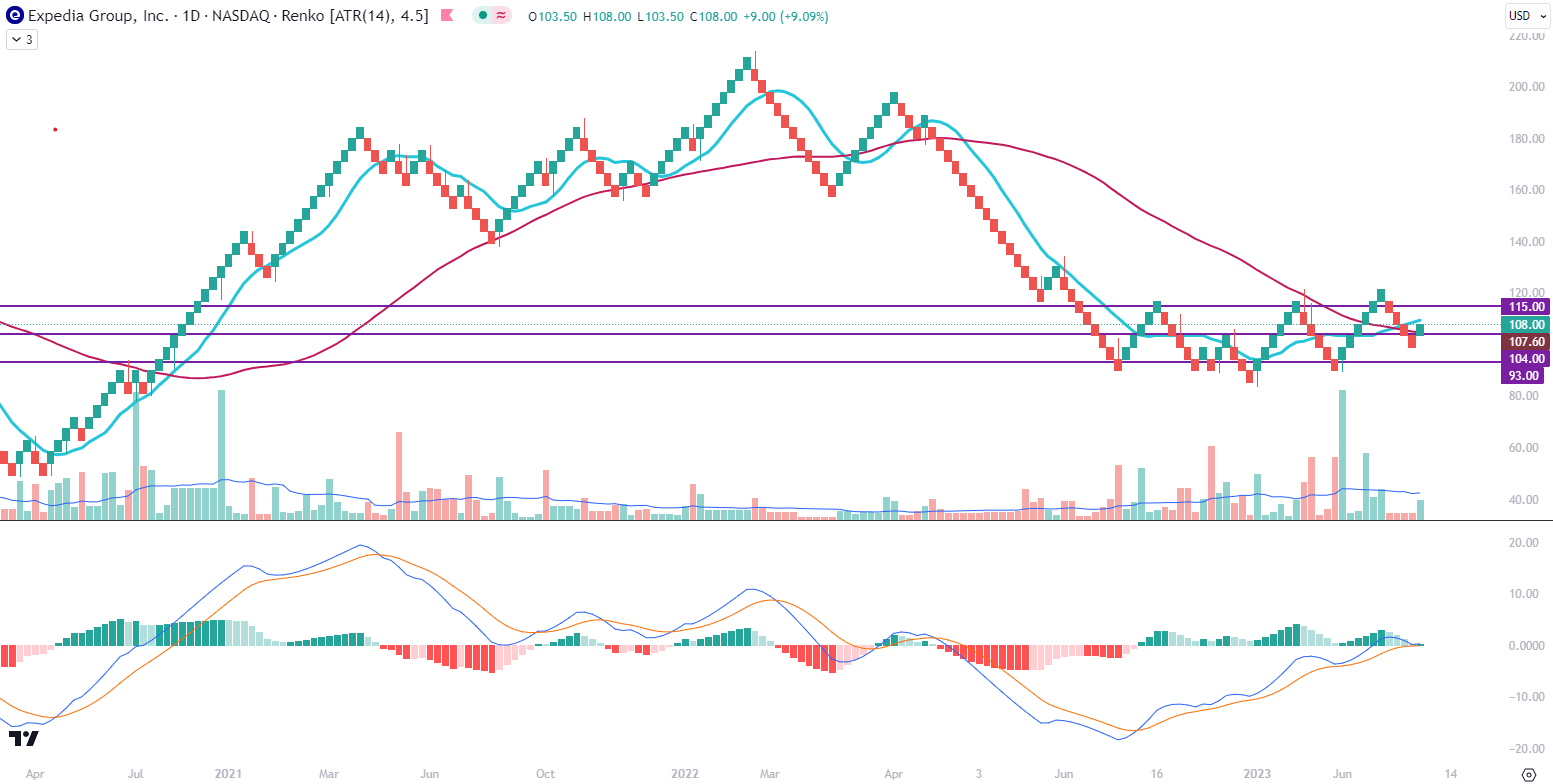
Conclusions
Having taken a look at the improvement in revenues and margins for Expedia, the outlooks on reaping benefits from their investment in the loyalty program, and the single technology stack providing marketing savings, I maintain the conclusion of the regression exercise that Expedia is a fundamentally undervalued stock. However, the technical analysis is not unequivocal, which may be actually good and allow the investors to prepare for a breakout. The historical highs of $120, $140, and up to nearly $220 are still good targets to reach and provide a potential for upside until the stock starts making new all-time highs.
For further details see:
Expedia Seems Undervalued: Travel To Regain The Past Highs (Technical Analysis)