EXPD - Expeditors International: Dividend Trends By The Numbers
2023-09-07 06:01:27 ET
Summary
- Expeditors International of Washington, Inc. is demonstrating interesting technicals that point to rising prices over time.
- The company has a history of aggressive, consistent dividend growth, which indicates fundamental strength.
- EXPD has a solid dividend payout ratio, low debt-to-equity ratio, and strong cash flow, suggesting continued dividend growth.
Intro
Expeditors International of Washington, Inc. ( EXPD ) is a freight & logistics outfit based out of Seattle in the US. The company is a dividend aristocrat having increased its dividend for the past 26 years. The stock came to our attention because of the current interesting technicals it is demonstrating.
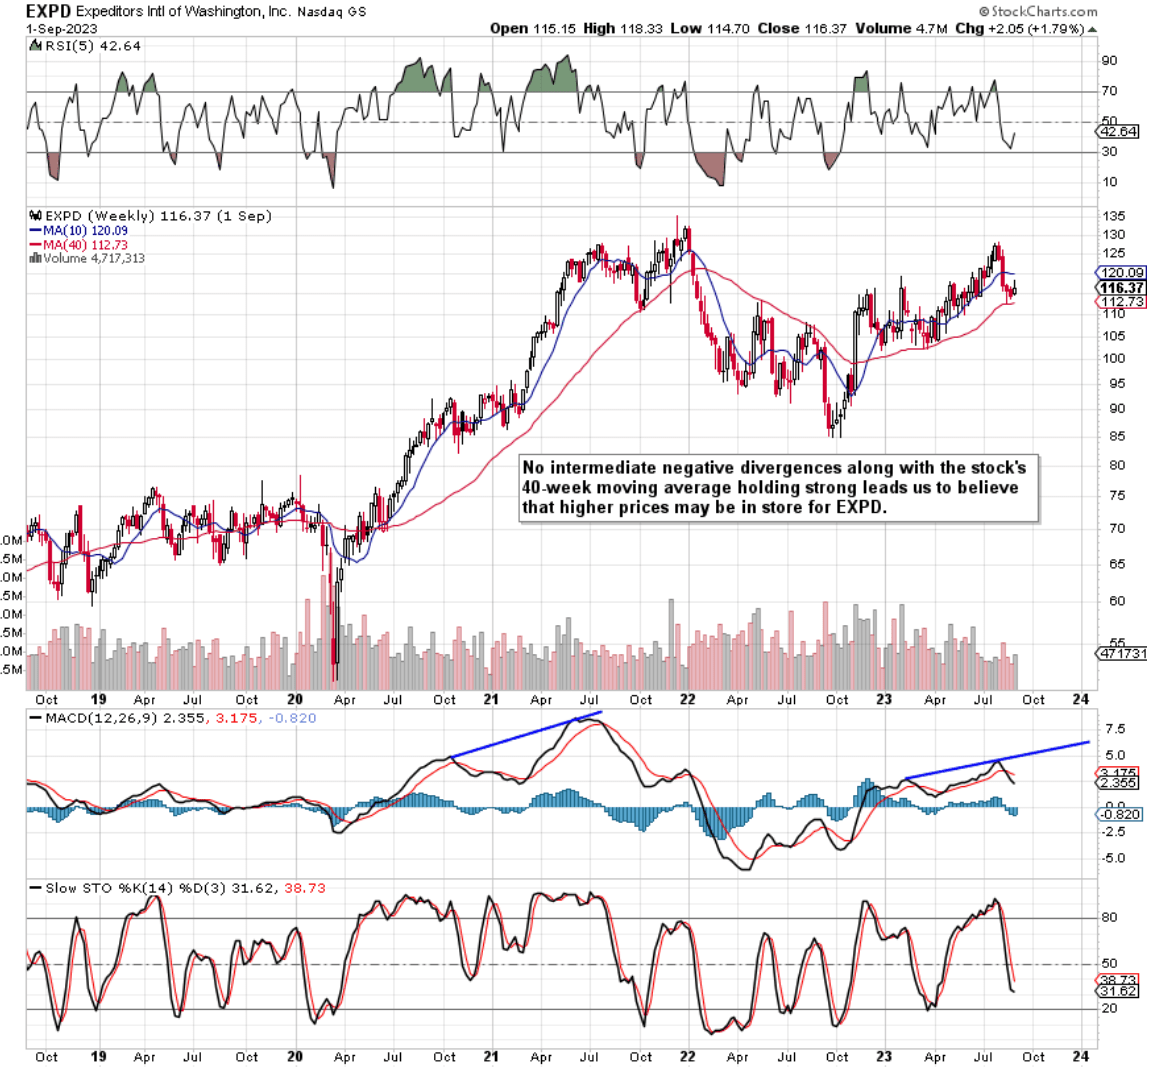
For example, we see on the intermediate chart that the lack of any meaningful negative MACD divergence plus the fact that the stock's 40-week moving average stopped the most recent down-move in its tracks both point to rising prices over time in EXPD. In fact, we had similar conditions back in mid-2021 when many would have believed that the stock's lofty intermediate MACD sell signal would have resulted in lower prices over time. This though as we see did not materialize with shares once more printing higher highs after bottoming at the 40-week moving average.
Chart analysis can be a potent tool when trying to ascertain share-price direction, especially in proven dividend aristocrats such as EXPD. We firmly believe that studying past technical patterns & trends is worthwhile as we are principally studying investor psychology, which in the main tends not to change. Therefore, let's go through EXPD's key trends which make up its dividend to see if indeed the strength of the payout ties in with what we are seeing on the stock's technical chart.
EXPD Intermediate Technicals (Stockcharts.com)
Dividend Growth
Although the 1.19% forward dividend yield may not turn many heads in terms of immediate income potential, we must remember (especially now in times of inflation) that dividend growth is of equal importance to an investor's income stream over time. In fact, aggressive consistent dividend growth usually lends itself to fundamental strength and we can see this with EXPD's intermediate 5-year chart above which demonstrates strong capital gains in the share price over this period.
In fact, as we see below, despite the fact that management recently increased the semi-annual dividend by only $0.02 per share, the company's 10-year average annual dividend growth rate is more or less equal to what we have seen from the stock over the past 12 months or so (9%).
| Timeframe |
| EXPD Dividend Growth |
| 12 Month ((TTM)) |
| 8.8% |
| 3 Year ((CAGR)) |
| 10.06% |
| 5 Year ((CAGR)) |
| 9.35% |
| 10 Year ((CAGR)) |
| 8.9% |
Cash Flow / Pay-Out Ratios
The dividend payout ratio gives the quickest insight into the sustainability of the dividend. As we see below, EXPD is in a solid place regarding the safety of the dividend as the payout ratio from both a cash-flow & GAAP earnings standpoint come in at 11.4% & 20.3% respectively. In fact, some investors would state that these payout ratios are indeed too low in that more of the company's profits should indeed be paid out in dividends, which would increase the dividend yield consequently.
| Dividend Pay-Out Ratio |
| Trailing 12-Month |
| 5-Year Average |
| Cash Dividend Payout Ratio |
| 11.4% |
| 23.3% |
| GAAP Earnings Dividend Payout Ratio |
| 20.3% |
| 22.3% |
Balance Sheet Leverage
The company's present debt-to-equity ratio comes in at 0.2 which is only slightly ahead of the 5-year average of 0.16. With respect to how EXPD's interest-bearing debt plays itself out on the income statement, we see that $25.8 million of interest expense was paid out of the company's operating profit ($1.358 billion) over the past four quarters. This equates to a trailing interest coverage ratio of 52.63, but given EXPD's track record in consistently reporting higher interest & investment income, leverage in this company remains a non-issue. This means high single-digit growth should continue in EXPD's dividend going forward.
Forward-Looking Earnings Expectations
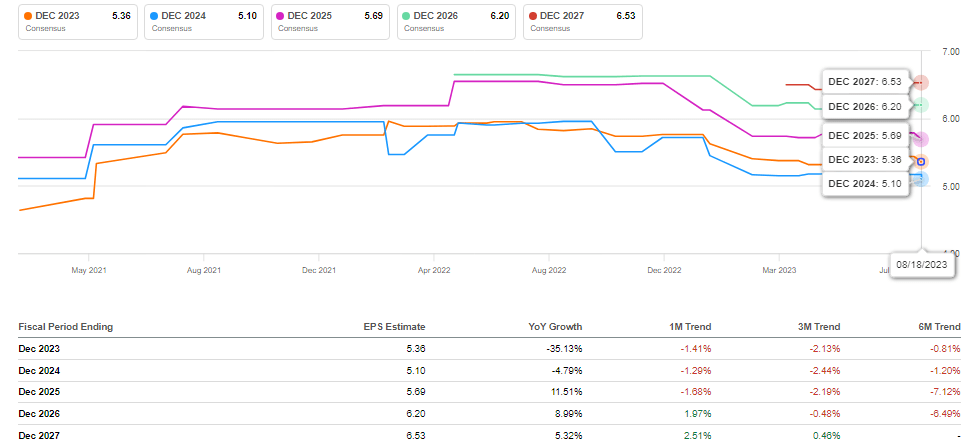
As we see below, although earnings are expected to fall both this year and next year, EPS revisions have slowly been stabilizing which is encouraging. Furthermore, when one goes through the firepower (cash-flow trends) the company has at its disposal to keep on increasing its earnings, it becomes evident that the projects below may be conservative at best. Elevated trailing 12-month operating cash flow of $1.86 billion for example (5-year average of $972 million) demonstrates the potential for the company to keep on growing its asset base and earnings alike. At the end of the company's most recent quarter, cash & ST investments totaled almost $1.7 billion (Price to cash multiple of 10.07) so continued strength here should continue to boost EXPD's income statement over time.
EXPD Forward-looking EPS Revisions (Seeking Alpha)
Conclusion
To sum up, given EXPD's bullish technicals & encouraging dividend trends to boot, we believe shares have every possibility of revisiting their 2023 highs shortly. Yes, there have been murmurs that the company's valuation is getting too lofty but shares remain in a bull market where higher prices look to be on the horizon over the near term. We look forward to continued coverage.
For further details see:
Expeditors International: Dividend Trends By The Numbers