EXPD - Expeditors: Potential Share Price Volatility Might Provide Buying Opportunities
Summary
- Expeditors' expertise in supply chain management has been well rewarded as supply chains have been disrupted by the impacts of the COVID-19 pandemic.
- The super profits Expeditors has enjoyed are likely coming to an end.
- Even without those super profits, Expeditors has shown strong underlying EPS growth rates.
- Expeditors is a sound well run business with a strong balance sheet, including a large cash balance and no debt.
- A decline in EPS as supply chains return to more normal conditions could result in share price volatility, leading to opportunities to buy the stock well below the present share price level.
Investment Thesis
Back on February 8, 2022, with the share price at $109.58, I published the article, "Expeditors International of Washington: Handling The Pandemic Well", covering Expeditors ( EXPD ) with a Hold rating. Since then the share price has declined by $1.83 (1.67%) to $107.75, per Figure 1 below.
Figure 1
Seeking Alpha Premium
Figure 1 shows while Expeditor's share price has fallen by 1.67% it has done much better than the S&P 500 ( SP500 ) which fell by 11.18% over the same period. Also, the dividend has kept the total return loss to less than 1%.
It's worth repeating some of what I said in that previous article, because it is as true today as it was then (I have just updated figures where applicable).
I have to ask myself what's there not to like about Expeditors International of Washington? The company grew EPS by an average 12.8% for the three years ended December 2019. Based on SA analysts' consensus estimates, EPS is projected to grow by 9.6% on average per year from 2019 to 2025. The company has no debt and a cash balance of $2,155 million at the end of Q3 2022. Shareholders investing in the company over the last six years have mostly achieved double-digit returns. Notwithstanding this, my detailed projections show the past rapid growth in share price that has driven these returns is likely to limit future share price growth and thus shareholder returns. Another concern is the company's approach to distributions to shareholders. While many companies categorize share repurchases as a form of distribution to shareholders, this is not necessarily the case.
In the case of Expeditors around half of share repurchases over the last 6 years have merely offset shares issued to staff as stock compensation. The value of shares issued to staff during the last 5.75 years is an estimated $1,602 million compared to $958 million in dividends paid to shareholders. Dividend yield is currently 1.24% so further share price growth is required to provide meaningful returns.
I went on to say,
I find I have to remain neutral on Expeditors at the current share price. However, there may be an opportunity to buy at a lower price in the months ahead. I believe there will likely be opportunities in the fourth quarter for lower stock prices across the board, including Expeditors, as I believe a market correction is overdue.
The market correction certainly came and Expeditors share price reached a low of $86.12 during the fourth quarter 2022, at which price it represented a good buying opportunity.
Current view:
Expeditors earnings have benefitted greatly over the last two years from supply chain disruption and that is coming to an end. Even though long term underlying EPS earnings growth, excluding the abnormal EPS over the last two years, is close to 10%, a decline in EPS in quarterly earnings reports over the period ahead might have an excessive adverse effect on share price. On balance, I would regard Expeditors as definitely a Hold, and quite possibly a Buy, should the share price decline significantly from the current level. My usual detailed structured financial analysis follows below.
Looking for Market Mispricing of Stocks
What I'm primarily looking for here are instances of market mispricing of stocks due to distortions to many of the usual statistics used for screening stocks for buy/hold/sell decisions. The usual metrics do not work when the "E" in P/E is distorted by the impact of COVID-19. And if the P/E ratio is suspect, so too, then, is the PEG ratio similarly affected. I believe the answer is to start with data at the end of 2019, early 2020, pre-COVID-19 and compare to projections out to the end of 2023 or later, when hopefully the impacts of COVID-19 will have largely dissipated. Summarized in Tables 1 and 2 below are the results of compiling and analyzing the data on this basis.
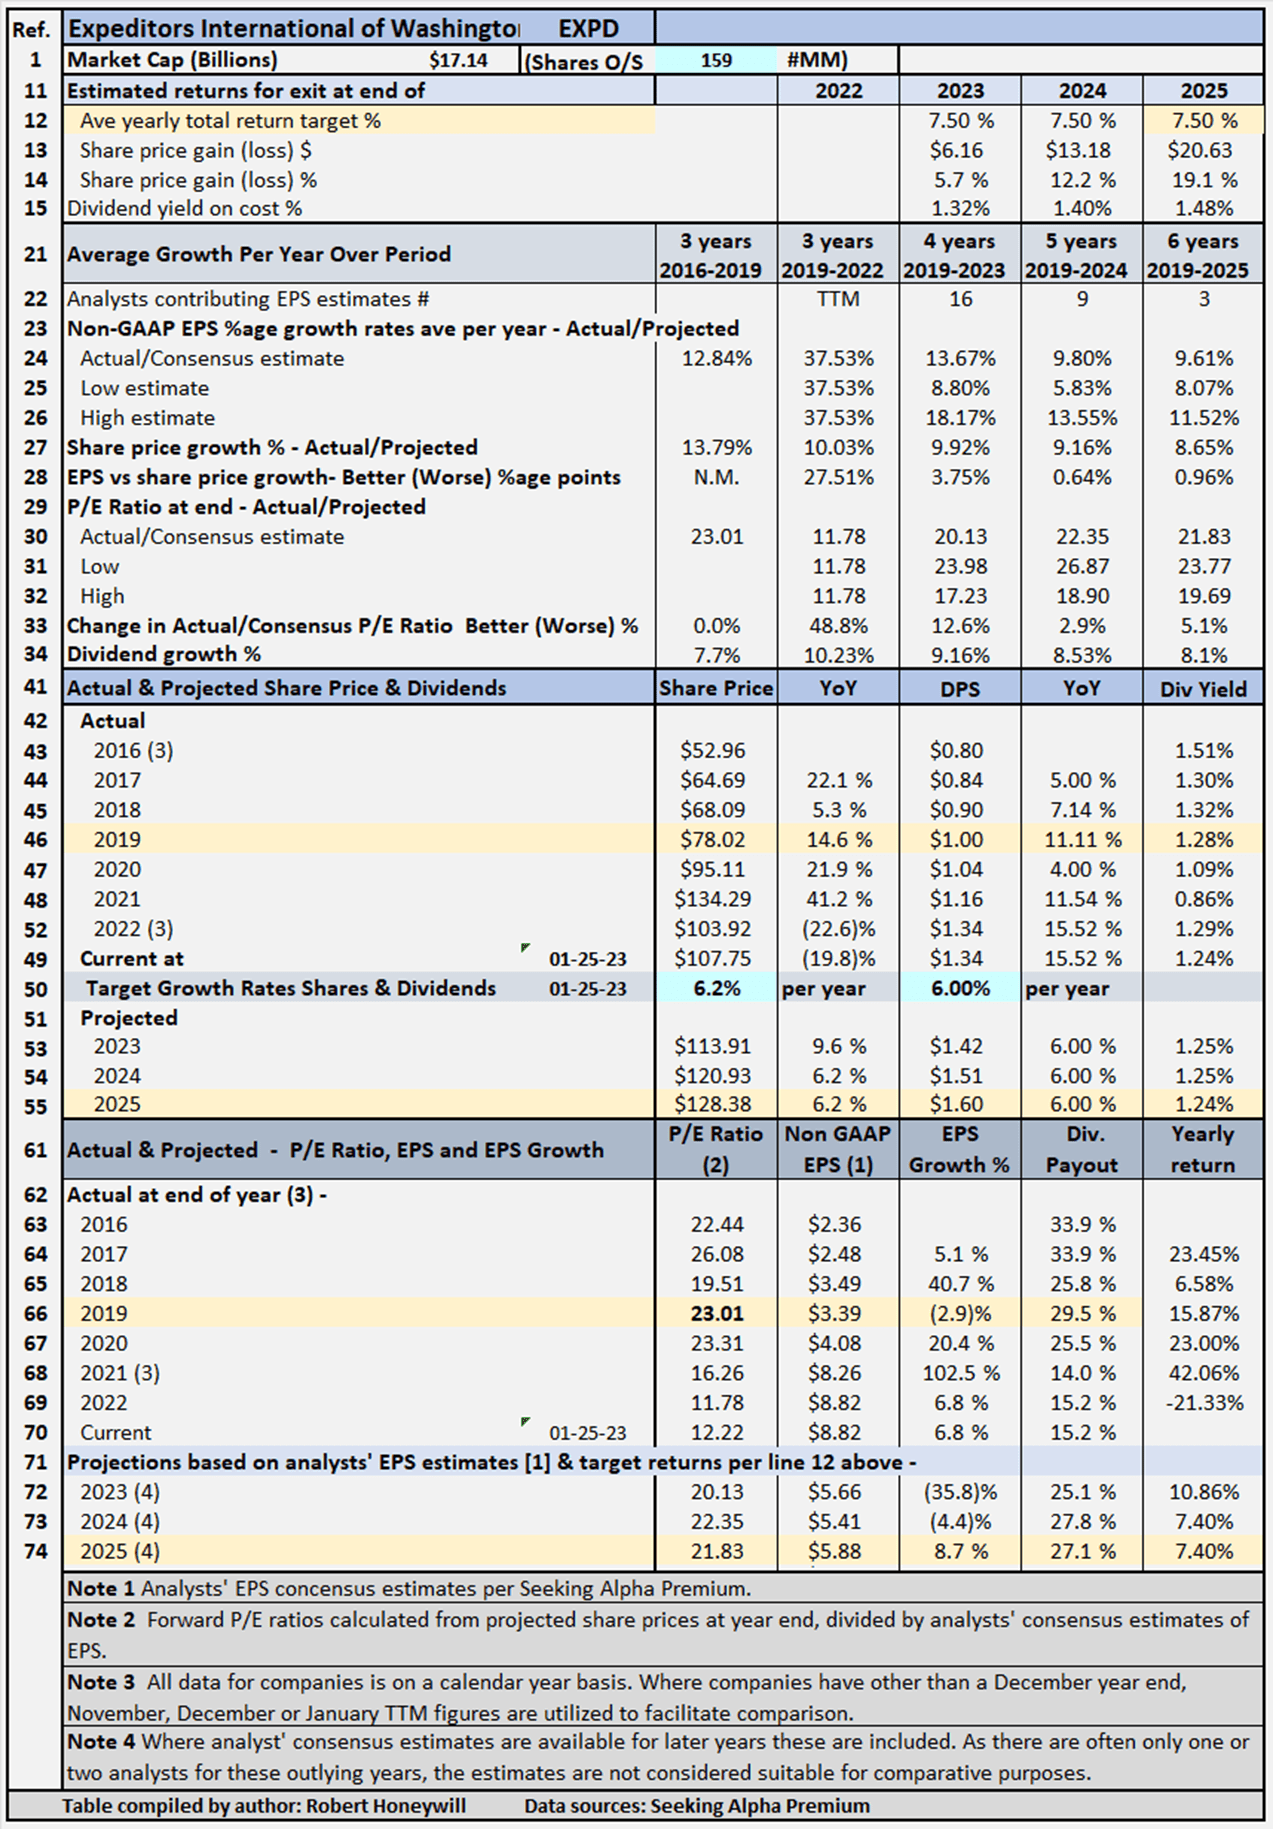
Table 1 - Detailed Financial History And Projections
Table 1 documents historical data from 2016 to 2019, including share prices, P/E ratios, EPS and DPS, and EPS and DPS growth rates. The table also includes estimates out to 2025 for share prices, P/E ratios, EPS and DPS, and EPS and DPS growth rates (note - while estimates are shown for analysts' EPS estimates out to 2023, 2024 and 2025 where available, estimates do tend to become less reliable, the further out the estimates go. These estimates are only considered sufficiently reliable if there are at least three analysts contributing estimates for the year in question). Table 1 allows modeling for target total rates of return. In the case shown above, the target set for total rate of return is 7.5% per year through the end of 2025 (see line 12), based on buying at the Jan. 25, 2023, closing share price level. As noted above, estimates become less reliable in the later years. However, as Expeditor's might best be viewed as a long term investment opportunity, I have decided to input a target return based on 2025, which has EPS estimates from three analysts. The table shows to achieve the 7.5% return, the required average yearly share price growth rate from Jan. 25, 2023, through Dec. 31, 2025, is 6.2.% (line 50). Dividends account for the balance of the target 7.5% total return.
Expeditors' Projected Returns Based on Selected Historical P/E Ratios Through the End of 2023
Table 2 below provides additional scenarios projecting potential returns based on select historical P/E ratios and analysts' consensus, low, and high EPS estimates per Seeking Alpha Premium through the end of 2025.
Table 2 - Summary of relevant projections Expeditors
Table 2 provides comparative data for buying at closing share prices on Jan. 25, 2023, and holding through the end of years 2022 to 2025 (where estimates are available). There's a total of nine valuation scenarios for each year, comprised of three EPS estimates (SA Premium analysts' consensus, low and high) across three different P/E ratio estimates, based on historical data. Expeditors' P/E ratio is presently 12.22, far below the historical average. This appears to be due to present elevated EPS rather than any negative sentiment towards the company. The company has benefited from supply chain disruption as customers look to it for solutions, and based on analysts' current estimates the present elevated EPS is not sustainable if and when supply chain disruption that has benefitted Expeditors comes to an end. Table 2 shows potential returns from an investment in shares of the company at a range of historical level P/E ratios. This analysis, from hereon, assumes an investor buying Expeditors shares today would be prepared to hold through the end of 2025, if necessary, to achieve their return objectives. Comments on contents of Table 3, for the period to 2025 column follow.
Consensus, low and high EPS estimates
All EPS estimates are based on analysts' consensus, low and high estimates per SA Premium. This is designed to provide a range of valuation estimates ranging from low to most likely, to high based on analysts' assessments. I could generate my own estimates, but these would likely fall within the same range and would not add to the value of the exercise. This is particularly so in respect of well-established businesses such as Expeditors. I believe the "low" estimates should be considered important. It's prudent to manage risk by knowing the potential worst-case scenarios from whatever cause.
Alternative P/E ratios utilized in scenarios
- The actual P/E ratios at the buy date based on actual non-GAAP EPS for TTM Sep 30, 2022.
- A modified average P/E ratio based on 26 quarter-end P/E ratios from Q4 2016 to Q4 2022 plus current P/E ratio in Q1 2023. The average of these P/E ratios has been modified to exclude the five highest and five lowest P/E ratios to remove outliers that might otherwise distort the result.
- A median P/E ratio calculated using the same data set used for calculating the modified average P/E ratio. Of course, the median is the same whether or not the three highest and lowest P/E ratios are excluded. In the case of Expeditors, I have chosen to use an assumed P/E ratio of 12.22, based on the current multiple, in place of Expeditor's historical median of 21.66. I have done this to provide an idea of the impact on returns if the multiple remained at current level through the end of 2025.
- The actual P/E ratio at Feb. 21, 2020, share price, based on 2019 non-GAAP EPS. The logic here is the market peaked around February 21, 2020, before any significant impact from COVID-19 became apparent. This makes the P/E ratios at Feb. 21, 2020, reflective of most recent data before distortion of P/E ratios by the impact of the coronavirus pandemic.
Reliability of EPS estimates (line 17)
Line 17 shows the range between high and low EPS estimates. The wider the range, the greater disagreement there is between the most optimistic and the most pessimistic analysts, which tends to suggest greater uncertainty in the estimates. There are three analysts covering Expeditors through the end of 2023. In my experience, a range of 3.4 percentage points difference in EPS growth estimates among analysts is a little high, suggesting some degree of uncertainty, and thus decreased reliability.
Projected Returns (lines 18 to 39)
Lines 25, 32 and 39 show estimated returns, at a range of historical P/E ratio levels applied to SA analysts' consensus, high and low EPS estimates. Table 2 shows if the P/E ratio were to remain at present level of 12.22 through end of 2025 returns would be negative in all cases. This is because even the high EPS estimate for 2025 of $5.88 is below current Q3 2022 TTM EPS of $8.82. The P/E ratio will need to increase above the current level and/or EPS will need to increase above current elevated level to achieve positive returns buying at the current share price and holding through end of 2025. I do not believe we will see a decline in share price to that extent. The more likely scenario is the P/E ratio will move back towards the historical average. Table 2 shows if the P/E ratio increased to the historical average of 21.45, based on analysts' EPS estimates, returns between negative (3.8)% and positive 14.4% average per year through the end of 2025 would be possible. The negative (3.8)% return is based on analysts' low EPS estimates and the 10.6% on their high EPS estimates, with a 6.9% return based on consensus estimates. The difference between best and worst cases is an indication of the degree of uncertainty in analysts' estimates.
Checking Expeditors' "Equity Bucket"
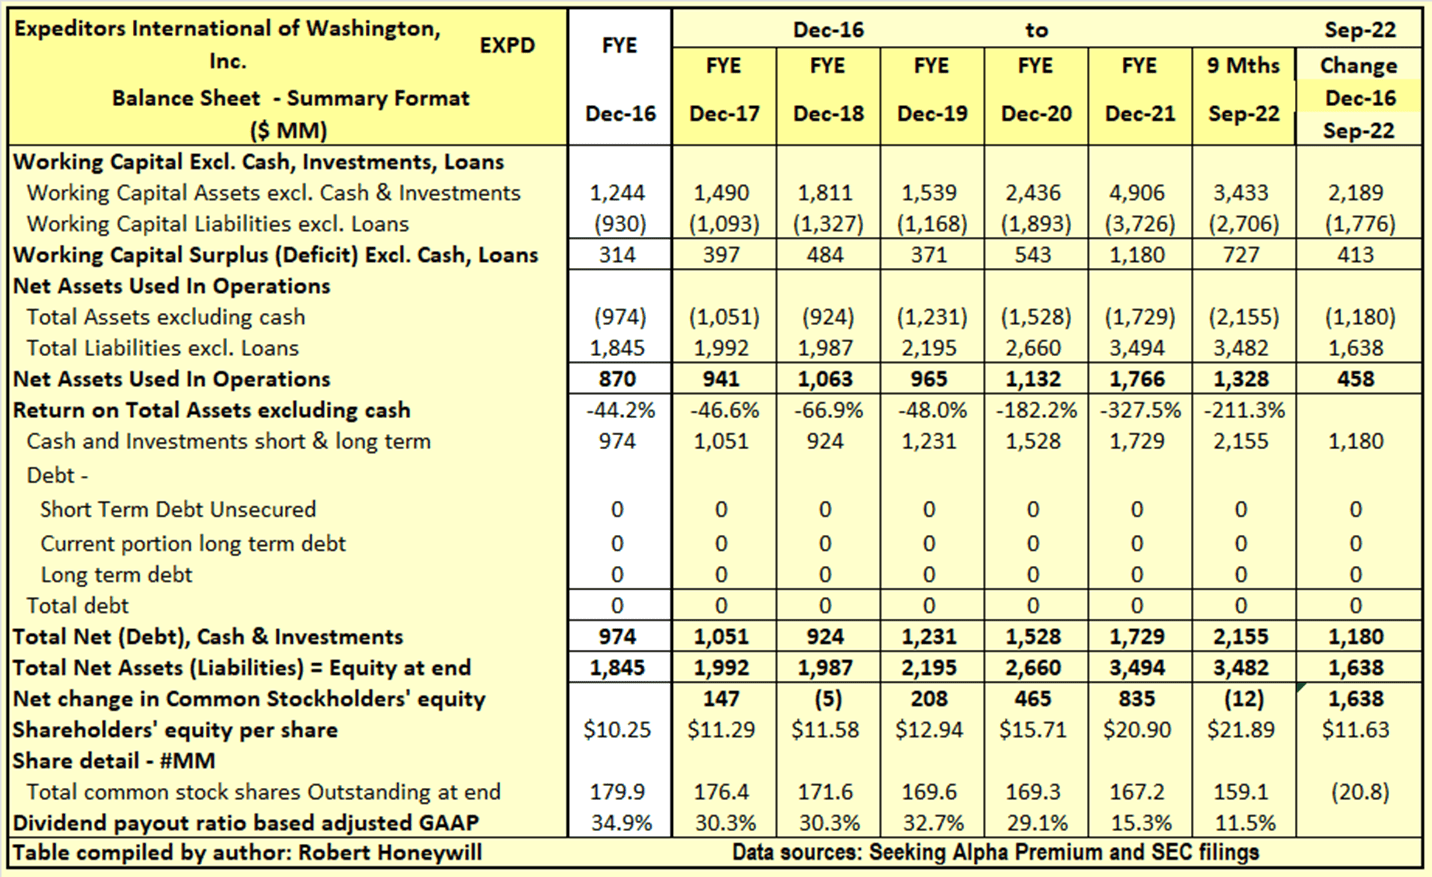
Table 3.1 Expeditors Balance Sheet - Summary Format
Seeking Alpha Premium and SEC filings
Over the 5.75 years end of 2016 to Q3 2022, Expeditors has increased net assets used in operations by $458 million and cash net of debt by $1,180 million. These increases were funded by an increase in shareholders' equity of $1,638 million. Outstanding shares decreased by 20.8 million from 179.9 million to 159.1 million, over the period, due to share repurchases partially offset by shares issued for stock compensation. The $1,638 million increase in shareholders' equity over the last 5.75 years is analyzed in Table 3.2 below.
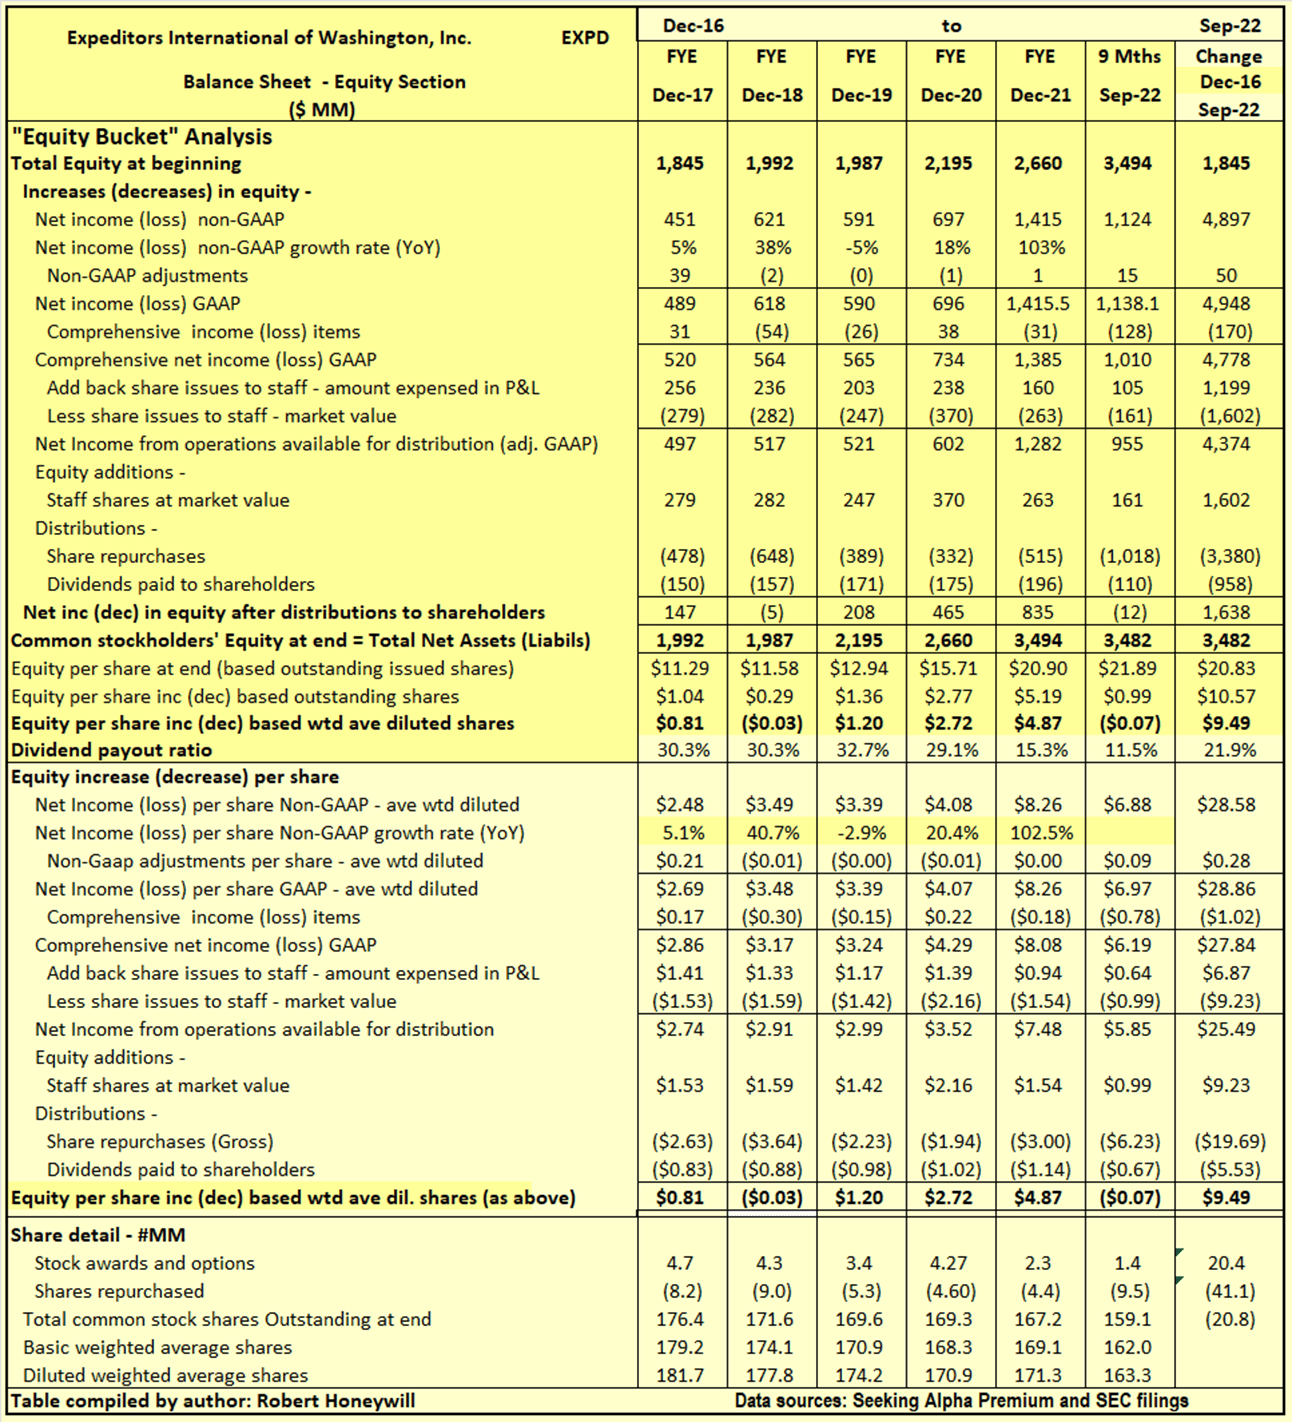
Table 3.2 Expeditors Balance Sheet - Equity Section
Seeking Alpha Premium and SEC filings
I often find companies report earnings that should flow into and increase shareholders' equity. But often the increase in shareholders' equity does not materialize. Also, there can be distributions out of equity that do not benefit shareholders. Hence, the term "leaky equity bucket." This is happening to some extent with Expeditors.
Explanatory comments on Table 3.2 for the period end FY-2016 to end Q3 2022
-
Reported net income (non-GAAP) over the 5.75-year period totals to $4,897 million, equivalent to diluted net income per share of $28.58.
- Over the 5.75-year period, the non-GAAP net income is reduced below GAAP net income by an amount of $50 million (EPS effect $0.28) for items regarded as unusual or of a non-recurring nature in order to better show the underlying profitability of Expeditors.
- Other comprehensive income includes such things as foreign exchange translation adjustments in respect to buildings, plants, and other facilities located overseas and changes in valuation of assets in the pension fund - these are not passed through net income as they fluctuate without affecting operations and can easily reverse in a following period. Nevertheless, they do impact on the value of shareholders' equity at any point in time. For Expeditors, these items totaled $170 million negative (EPS effect $1.02).
- Amount taken up in equity in relation to shares issued to staff over the 5.75-years is $1,199 million. This compares to an estimated market value of $1,602 million for these shares, resulting in an overstatement of net income by $403 million. This is a material overstatement in the context of total earnings of $4,897 million.
- By the time we take the above-mentioned items into account, we find, over the 5.75-year period, the reported non-GAAP EPS of $28.58 ($4,897 million) has decreased to $25.49 ($4,374 million), added to funds from operations available for distribution to shareholders.
- Dividends of $958 million, and share repurchases of $3,380 million totaled to $4,338 million were distributed out of the $4,374 million, leaving a surplus balance net income from operations after distributions of $36 million.
- The surplus of $36 million from operations plus the $1,602 million increase in equity due to issues of shares to staff resulted in the increase of $1,638 million in shareholders' funds per Table 5.1 above.
Summary and Conclusions
SA Premium analysts' EPS estimates indicate Expeditors EPS will likely return to lower, more normal levels as opportunistic gains arising from supply chain disruption are no longer available. Even with EPS declining from the higher levels over the last couple of years, Table 1 (line 24) shows the underlying EPS growth estimate for the six years from 2019 to 2025 is close to an average of 10% per year. That rate of EPS growth is likely highly supportive of the adjusted historical average P/E ratio of 21.45 in the longer term. Based on SA Premium analysts' consensus EPS estimates a 21.45 P/E multiple at end of 2025 could provide total return of around 7% per year, buying Expeditors stock at the current share price and holding through end of 2025. At the same time, if analysts' low EPS estimate for 2025 eventuated, negative total return would be possible. Another factor to consider is the possibility the share price might be adversely affected in the short term as quarterly EPS declines are reported as EPS returns to more normal levels. Taking all this into account a Hold rating is maintained. This could change if the share price does fall from present levels in the period ahead, making the stock more attractive.
For further details see:
Expeditors: Potential Share Price Volatility Might Provide Buying Opportunities