TTE - Exxon Mobil: Perhaps Time To Take Some Profits While It Is Red Hot
- Exxon Mobil posted adjusted quarterly earnings of $2.07 per diluted share and total revenues of $90,500 million. Earnings missed analyst expectations.
- Combining oil and gas production, Exxon Mobil produced 3,675K Boep/d in 1Q22, down 3% yearly and down 3.7% sequentially.
- I recommend taking some profits off the table between $91.1 and $95. The risk of recession is increasing.
Introduction
Exxon Mobil Corporation ( XOM ) announced its earnings for the first quarter of 2022 on April 29, 2022. The second quarter of 2022 results are coming soon, and it is time to look back at the balance sheet to better prepare for your next move.
Note: This article is an update of my article published on February 11, 2022. I have followed XOM quarterly on Seeking Alpha since January 2017.
1 - 1Q22 results snapshot
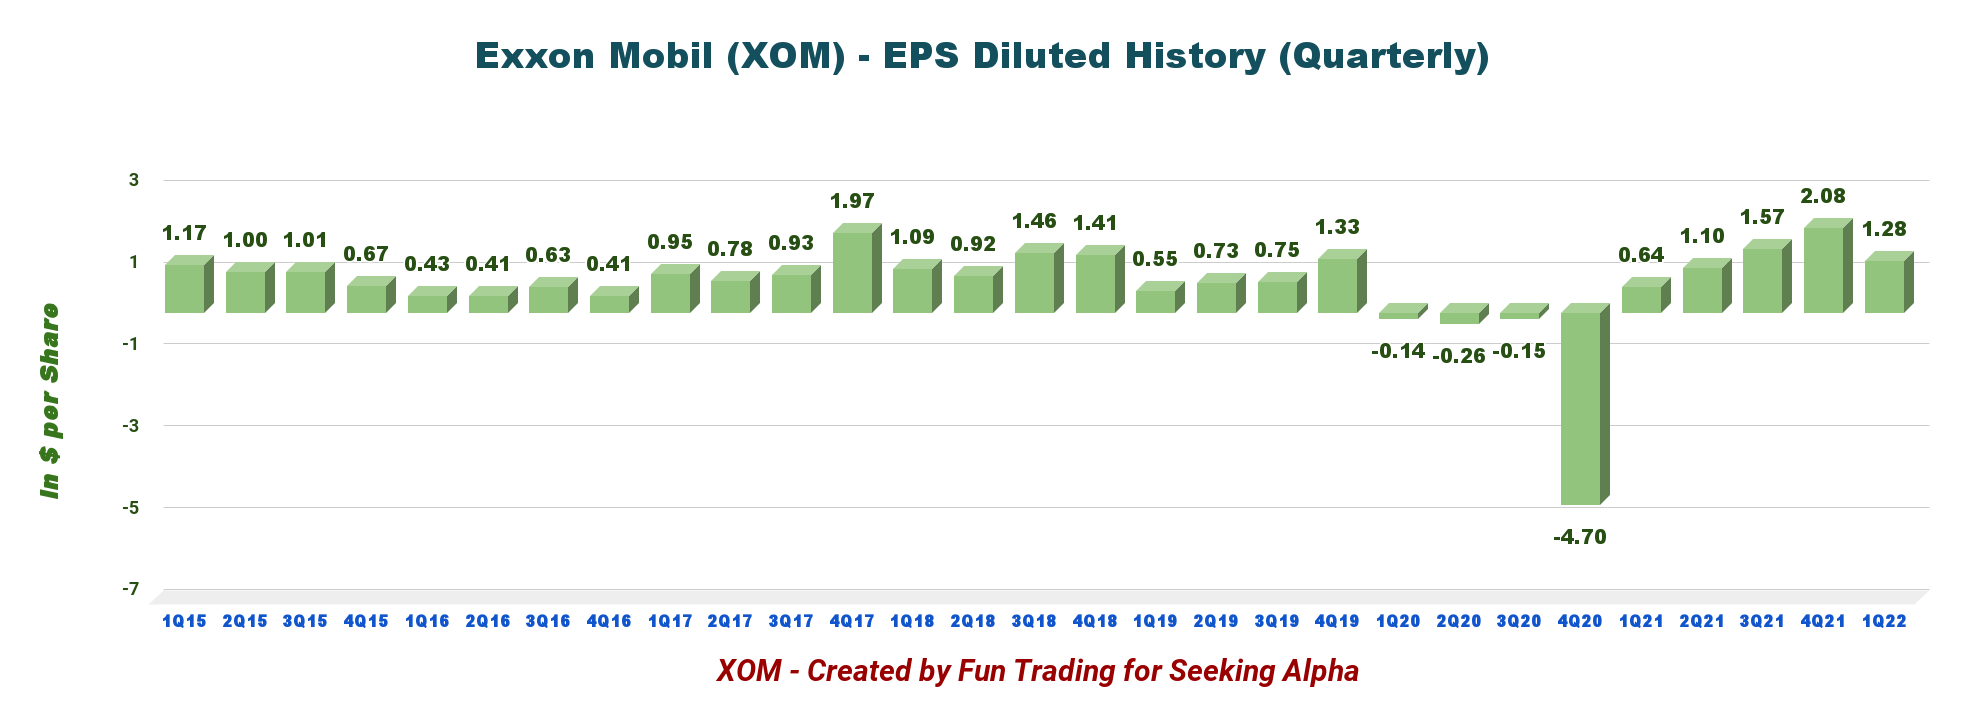
Exxon Mobil posted adjusted quarterly earnings of $2.07 per diluted share, missing analysts' expectations. The net diluted earnings per share were $1.28, up from $0.64 a year ago.
Total revenues of $90,500 million beating expectations. They were up significantly from the year-earlier figure of $59,147 million.
The lower-than-expected earnings were due to a decline in oil equivalent production of 3,675K Boep/d compared to 3,787K Boep/d in 1Q21.
It was partially offset by record commodity prices and improved refining margins. Lower production was due to planned maintenance and unscheduled downtime weather related.
1Q22 Highlights:
XOM 1Q22 highlights Presentation (Exxon Mobil)
Note: Exxon Mobil increased its share repurchases from $10 billion to $30 billion executed over the next 24 months.
Below is shown the EPS since 1Q18.
XOM Quarterly diluted earnings history (Fun Trading)
2 - Investment Thesis
Exxon Mobil is one of my favored oil companies, and I owned the stock long-term with a significantly reduced position after the stock reached my final target. The near future is difficult to predict because Exxon Mobil is highly dependent on oil prices, subject to wide fluctuations. However, I believe we are close to a strong resistance now.
The FED's successive hikes are affecting the U.S. economy, and we may enter a painful recession that will erode the overall demand for hydrocarbons. If it is the case, XOM may retrace significantly in 4Q22.
Oil prices have already corrected from their recent high above $140 per barrel to below $100 per barrel and may fall further depending on the recession's severity.
The overall strategy that I usually promote in my marketplace, "The Gold and Oil Corner," is to keep a medium core long-term position and use about 50%-60% to trade LIFO while waiting for a higher final price target to sell your core position.
The task is made easier with XOM because of the generous dividend payout. I believe it is the most efficient strategy with such cyclical stocks.
3 - Stock performance
XOM is up 58% on a one-year basis.
4 - Dividend comparison
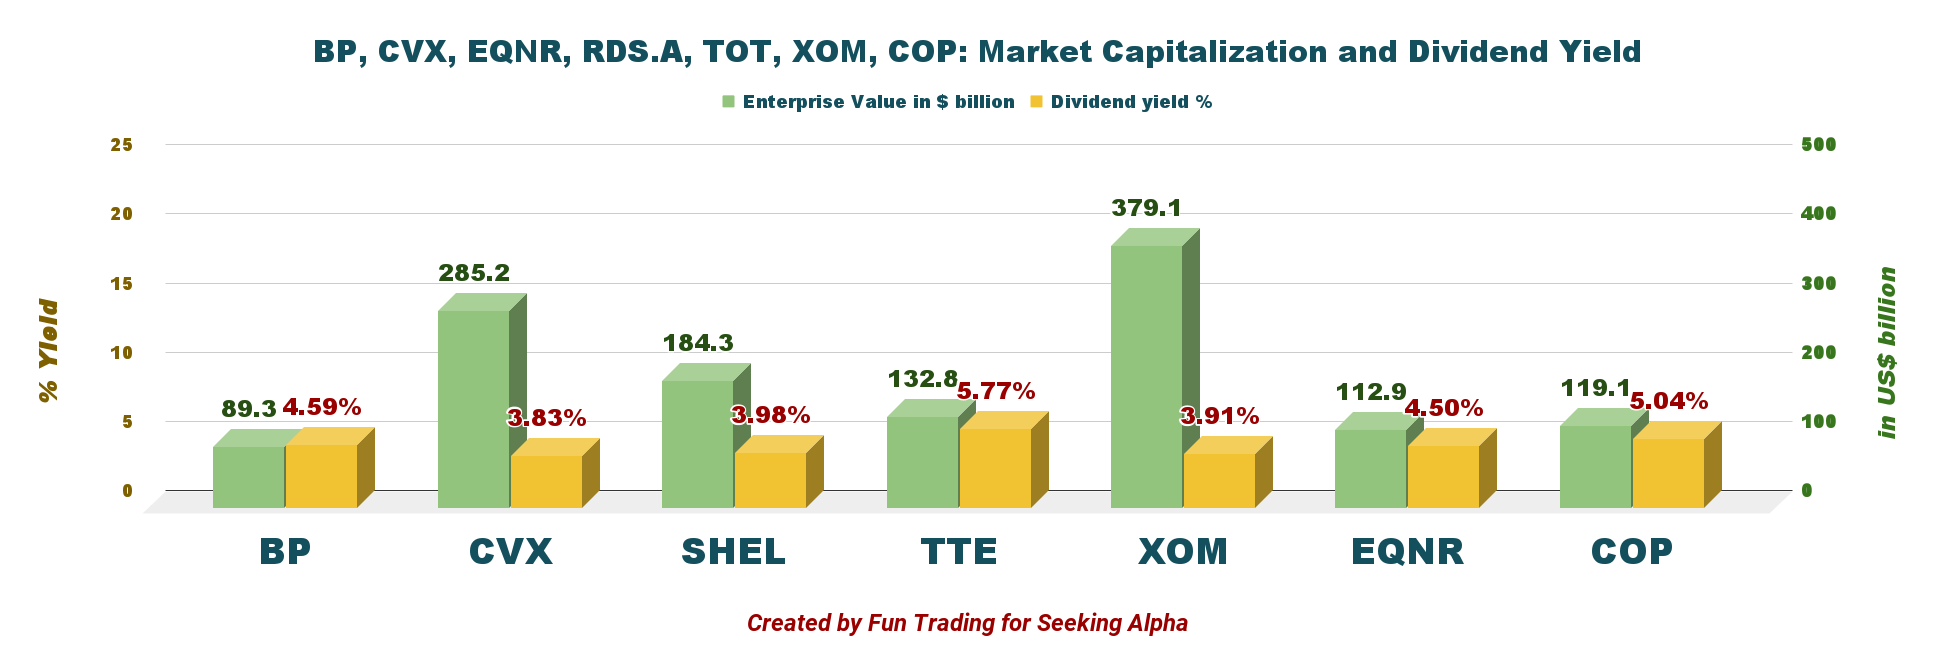
XOM dividend yield is now ~3.9%, which aligns with CVX.
XOM Dividend comparisons (Fun Trading)
5 - Upstream production
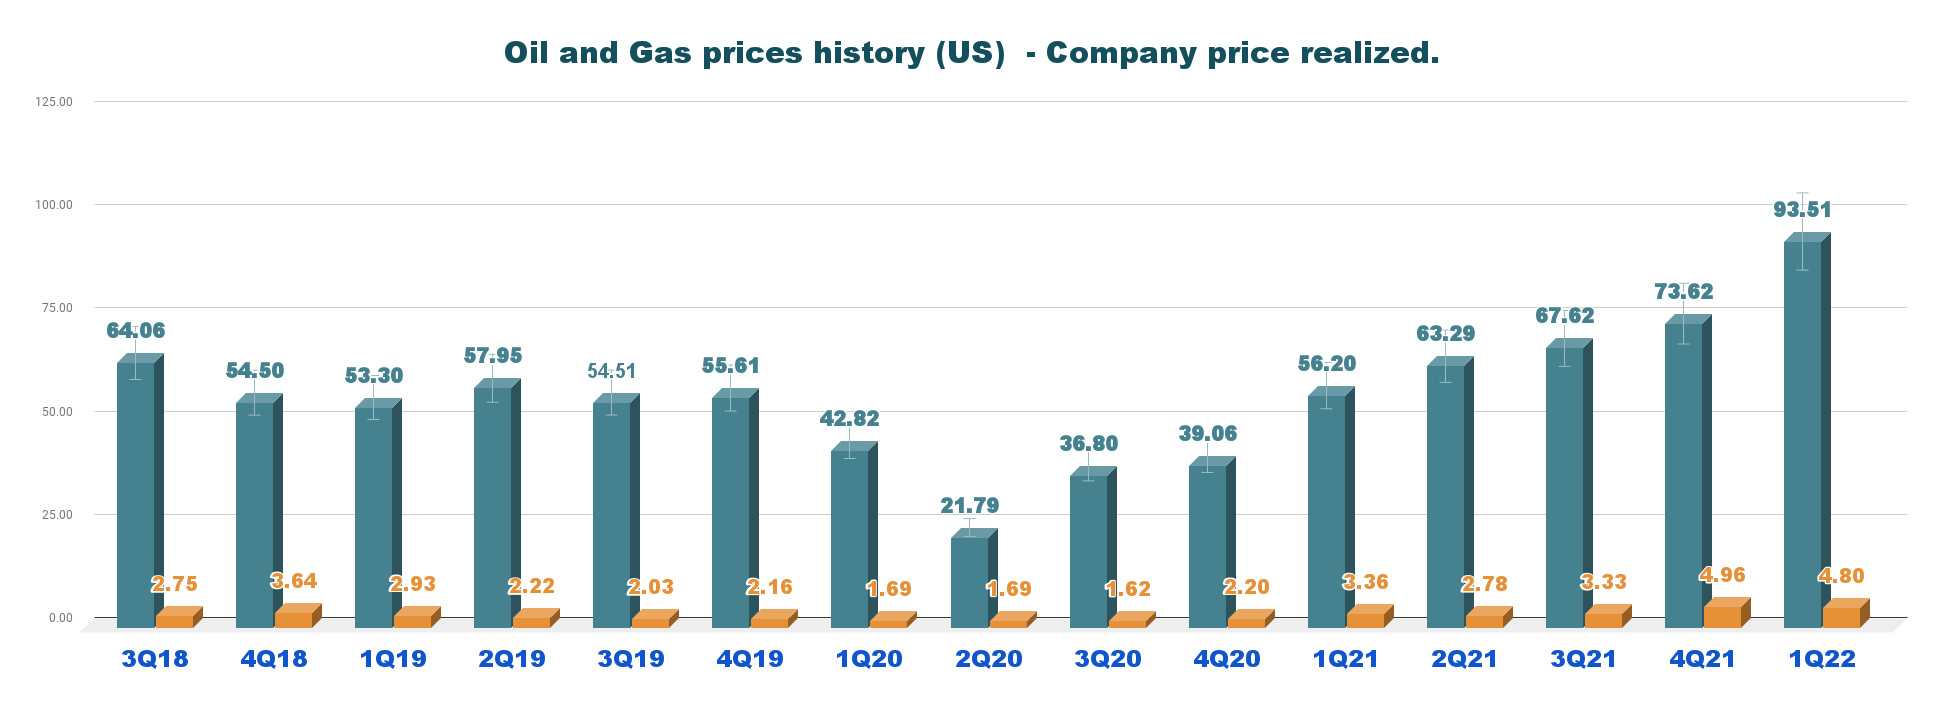
Oil and gas production in the first quarter was 3,675K Boep/d. The good news was the U.S. oil price composite jumped again to a record of $93.51 this quarter.
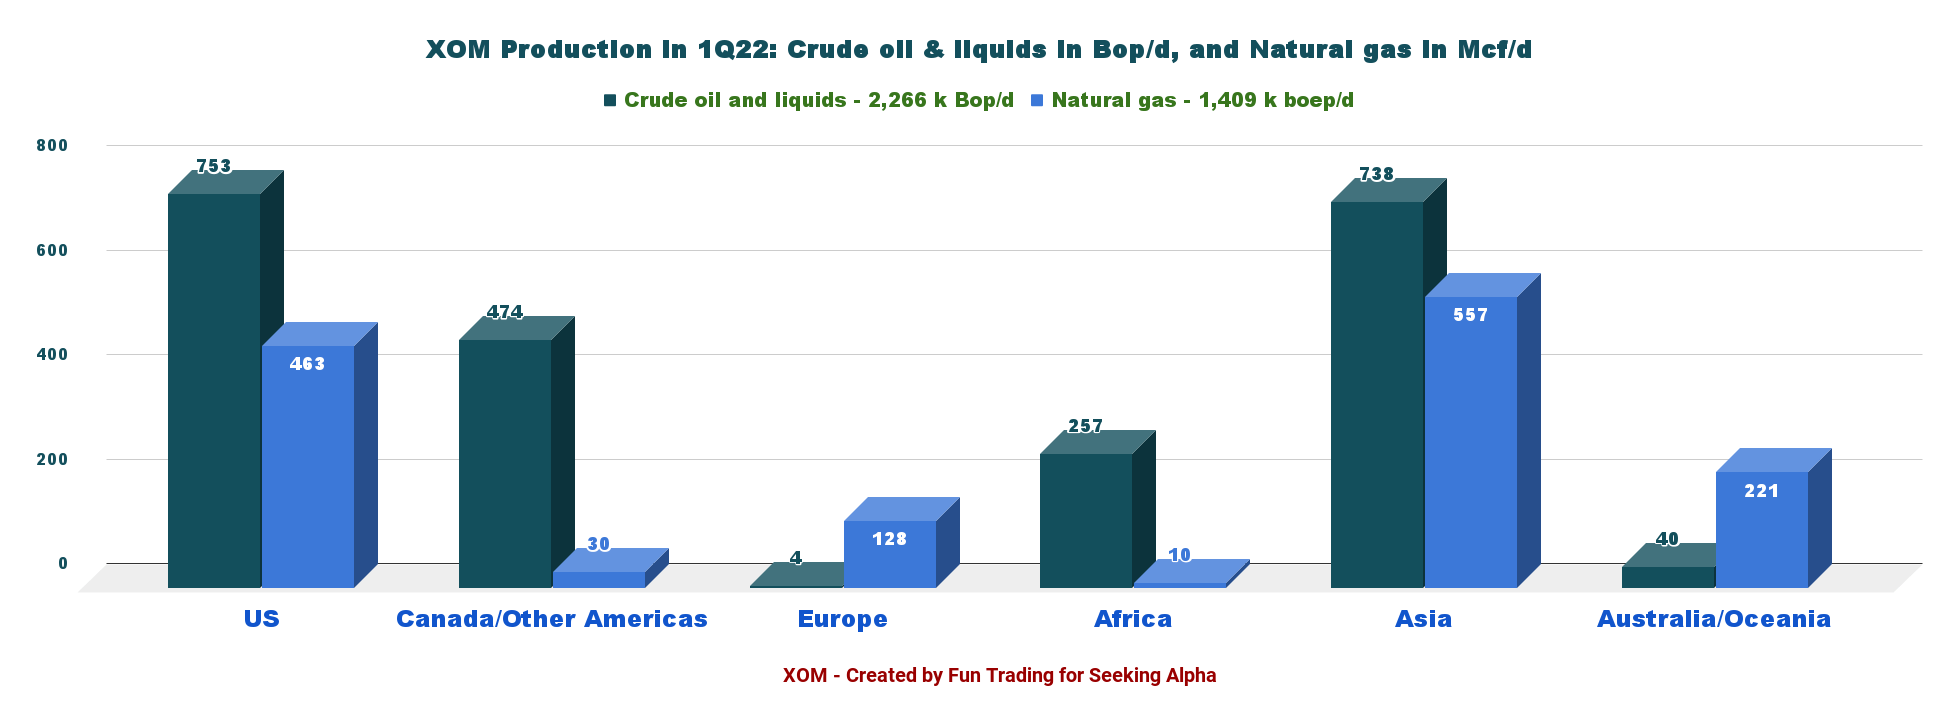
Below is the company's production per region between liquids (including NGL) and natural gas in 1Q22. The U.S. segment represents 33.1% of the total input.
XOM Oil and NG production per region in 1Q22 (Fun Trading) Exxon Mobil - 1Q22 Financial Table and Upstream Production: The Raw Numbers
| Exxon Mobil |
| 1Q21 |
| 2Q21 |
| 3Q21 |
| 4Q21 |
| 1Q22 |
| Total Revenues and other Income in $ Billion |
| 59.15 |
| 67.74 |
| 73.79 |
| 84.97 |
| 90.50 |
| Net Income in $ Billion |
| 2.73 |
| 4.69 |
| 6.75 |
| 8.87 |
| 5.48 |
| EBITDA $ Billion |
| 8.85 |
| 11.51 |
| 14.81 |
| 17.61 |
| 17.63 |
| EPS diluted in $/share |
| 0.64 |
| 1.10 |
| 1.57 |
| 2.08 |
| 1.28 |
| Cash from operating activities in $ Billion |
| 9.26 |
| 9.65 |
| 12.09 |
| 17.12 |
| 14.79 |
| Capital Expenditures in $ Billion |
| 2.40 |
| 2.75 |
| 2.84 |
| 4.09 |
| 3.91 |
| Free Cash Flow in $ Billion |
| 6.86 |
| 6.90 |
| 9.25 |
| 13.04 |
| 10.88 |
| Total Cash $ Billion |
| 3.52 |
| 3.47 |
| 4.77 |
| 6.80 |
| 11.07 |
| Total Debt in $ Billion |
| 63.2 |
| 60.6 |
| 56.6 |
| 47.7 |
| 47.5 |
| Dividend per share in $ |
| 0.87 |
| 0.87 |
| 0.88 |
| 0.88 |
| 0.88 |
| Shares outstanding (diluted) in Billion |
| 4.272 |
| 4.276 |
| 4.276 |
| 4.275 |
| 4.266 |
| Oil Production |
| 1Q21 |
| 2Q21 |
| 3Q21 |
| 4Q21 |
| 1Q22 |
| Oil Eq Income Production in K Boepd |
| 3,787 |
| 3,582 |
| 3,665 |
| 3,816 |
| 3,675 |
| US Production in K Boepd |
| 1,126 |
| 1,154 |
| 1,208 |
| 1,222 |
| 1,216 |
| Permian Production in K Boepd |
| 412 |
| 400 |
| 500 |
| 460 |
| 640 |
| US Quarterly average Brent Eq. ($/b) |
| 56.20 |
| 63.29 |
| 67.62 |
| 73.62 |
| 93.51 |
| US Quarterly average NG ($/Kcf) |
| 3.36 |
| 2.78 |
| 3.33 |
| 4.96 |
| 4.80 |
Sources: Company filing 10Q and Fun Trading analysis.
Analysis: Revenues, Earnings Details, Free Cash Flow, and Upstream Cash Flow
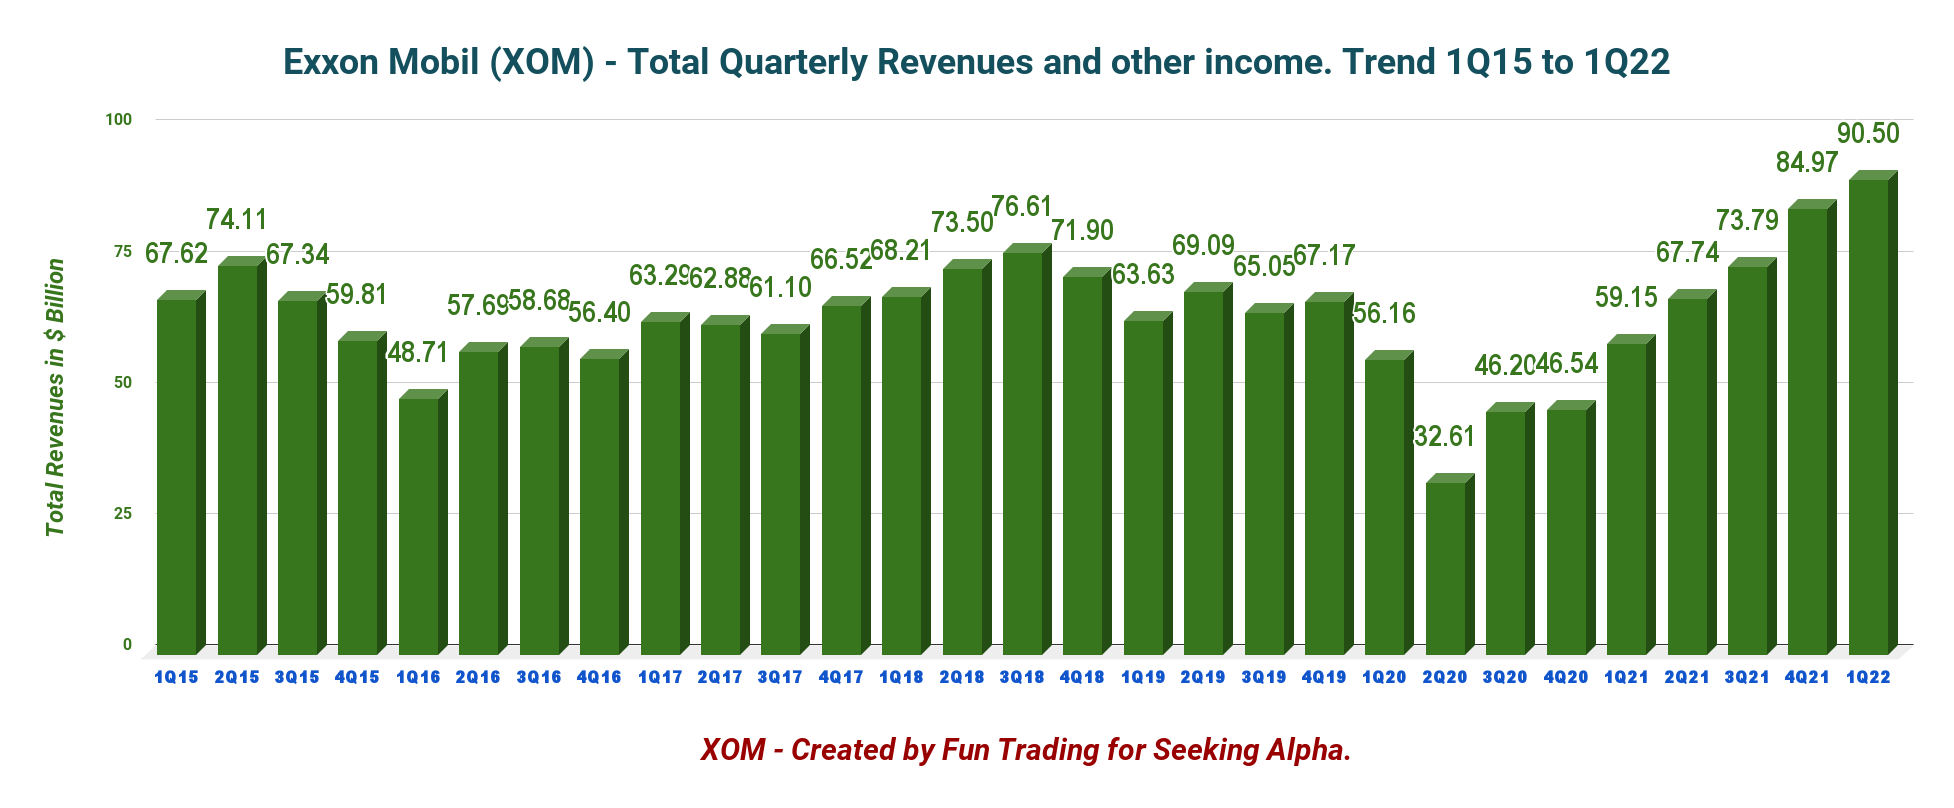
1 - Quarterly revenues and other income were $90.50 billion in 1Q22
XOM Quarterly Revenues history (Fun Trading)
Revenues and other incomes came in at $90.50 billion in the first quarter of 2022, with $5.48 billion in net income. This quarter, revenues significantly improved due to higher chemical margins and improved realized commodity prices. However, it was below analysts' expectations.
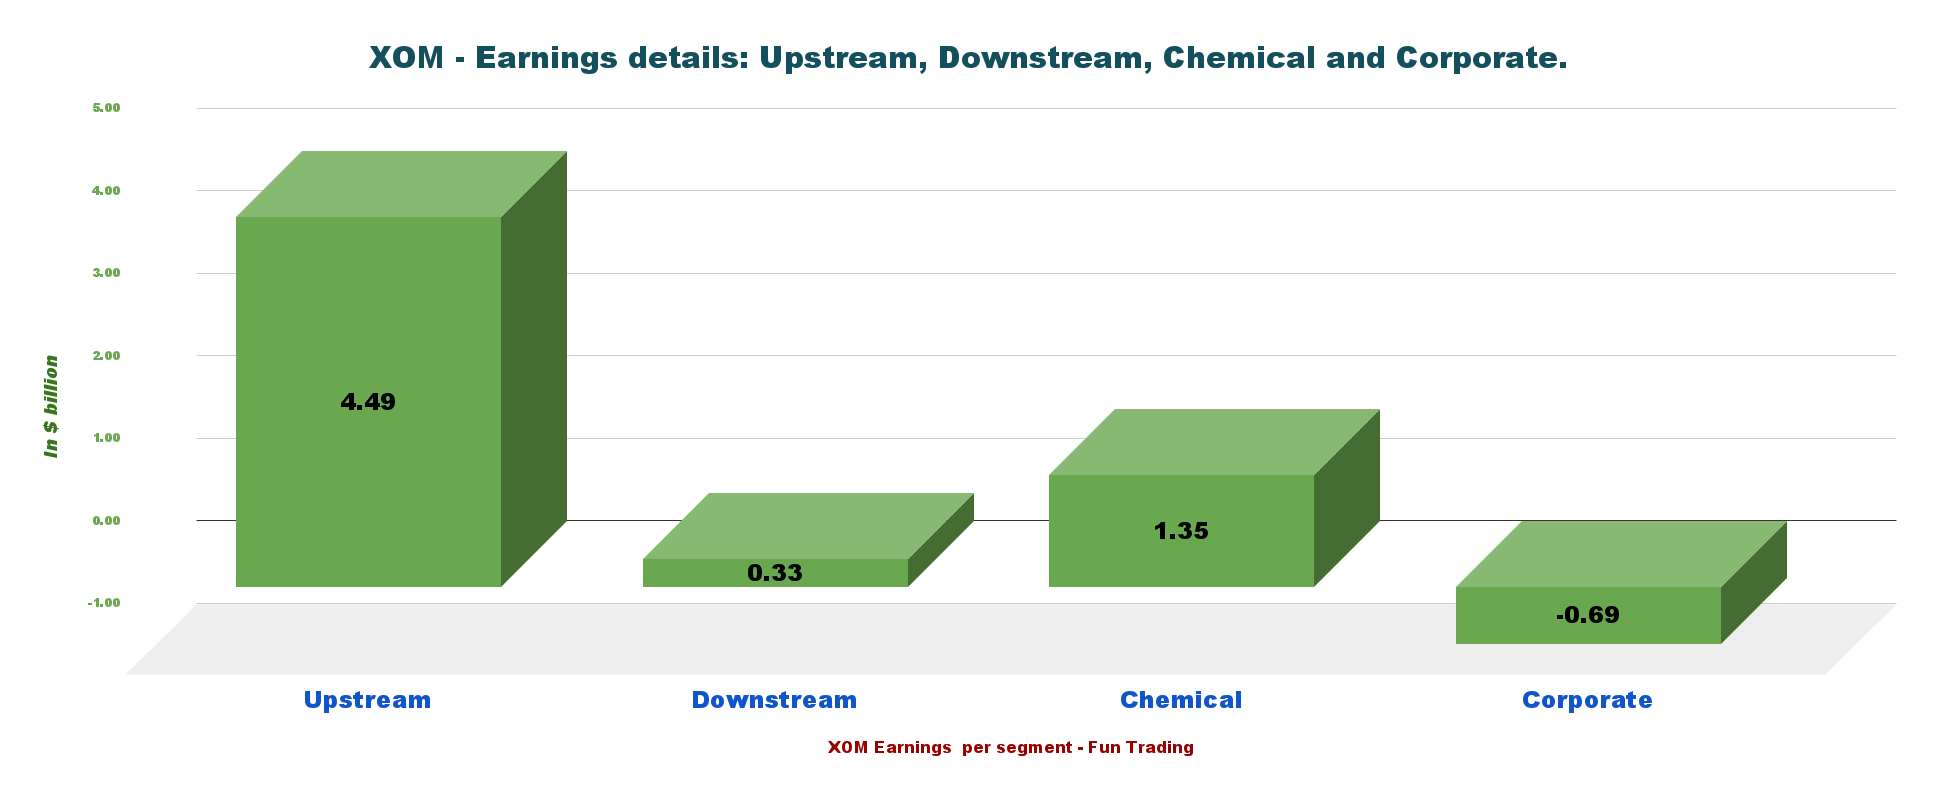
1.1 - Earnings details in 1Q22
XOM Earnings detail 1Q22 (Fun Trading)
The first quarter was strong, even if it did not meet expectations. Oil and gas prices were back to a historical high.
1.2 - XOM oil and gas prices history :
XOM Quarterly oil and gas price history (Fun Trading)
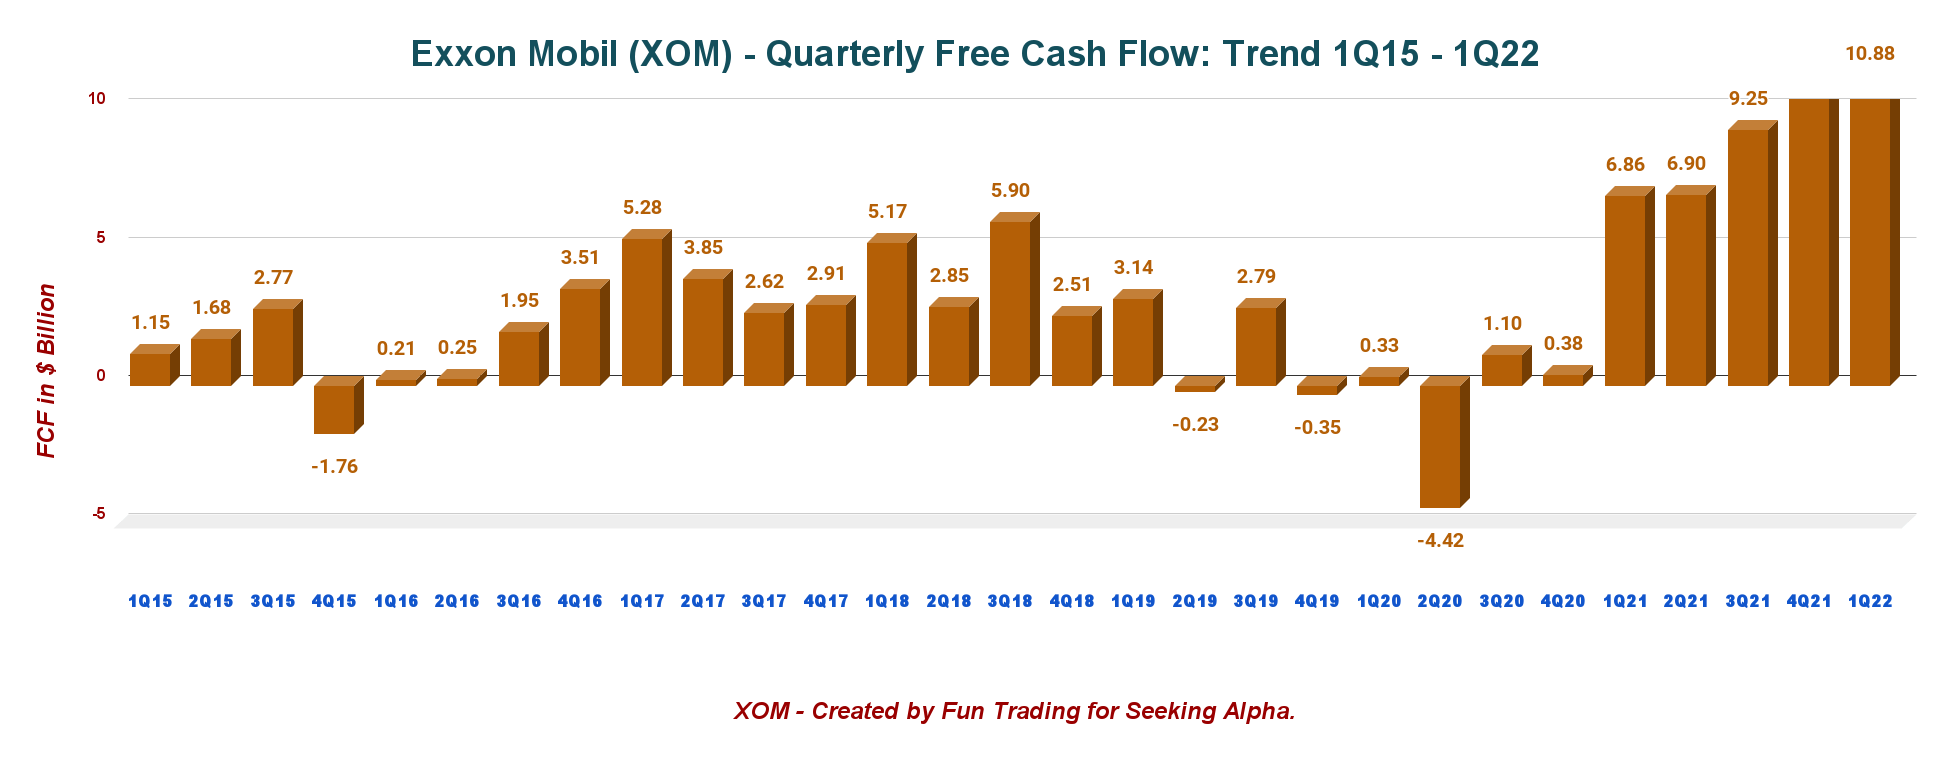
2 - Free Cash Flow (not including divestitures). The company posted a multi-year record of $10.88 billion in 1Q22.
XOM Quarterly Free cash flow history (Fun Trading) Note: Generic free cash flow is cash from operating activities minus CapEx.
The CapEx was high again in 1Q22, reaching $3.91 billion, and cash from operating activities jumped to $14.79 billion, down from $17.12 billion in 4Q21. CapEx increased by 63% from the same quarter a year ago.
The first quarter was $10.88 billion. The trailing 12-month FCF is $40.07 billion (not including divestitures). This high Free cash flow level explains why XOM increased the buyback program from $10 billion to $30 billion.
However, the dividend remains unchanged at $3.52 per share annually or a yield of 3.91%, based on 4.266 billion shares outstanding diluted, at the cost of ~$15 billion per year.
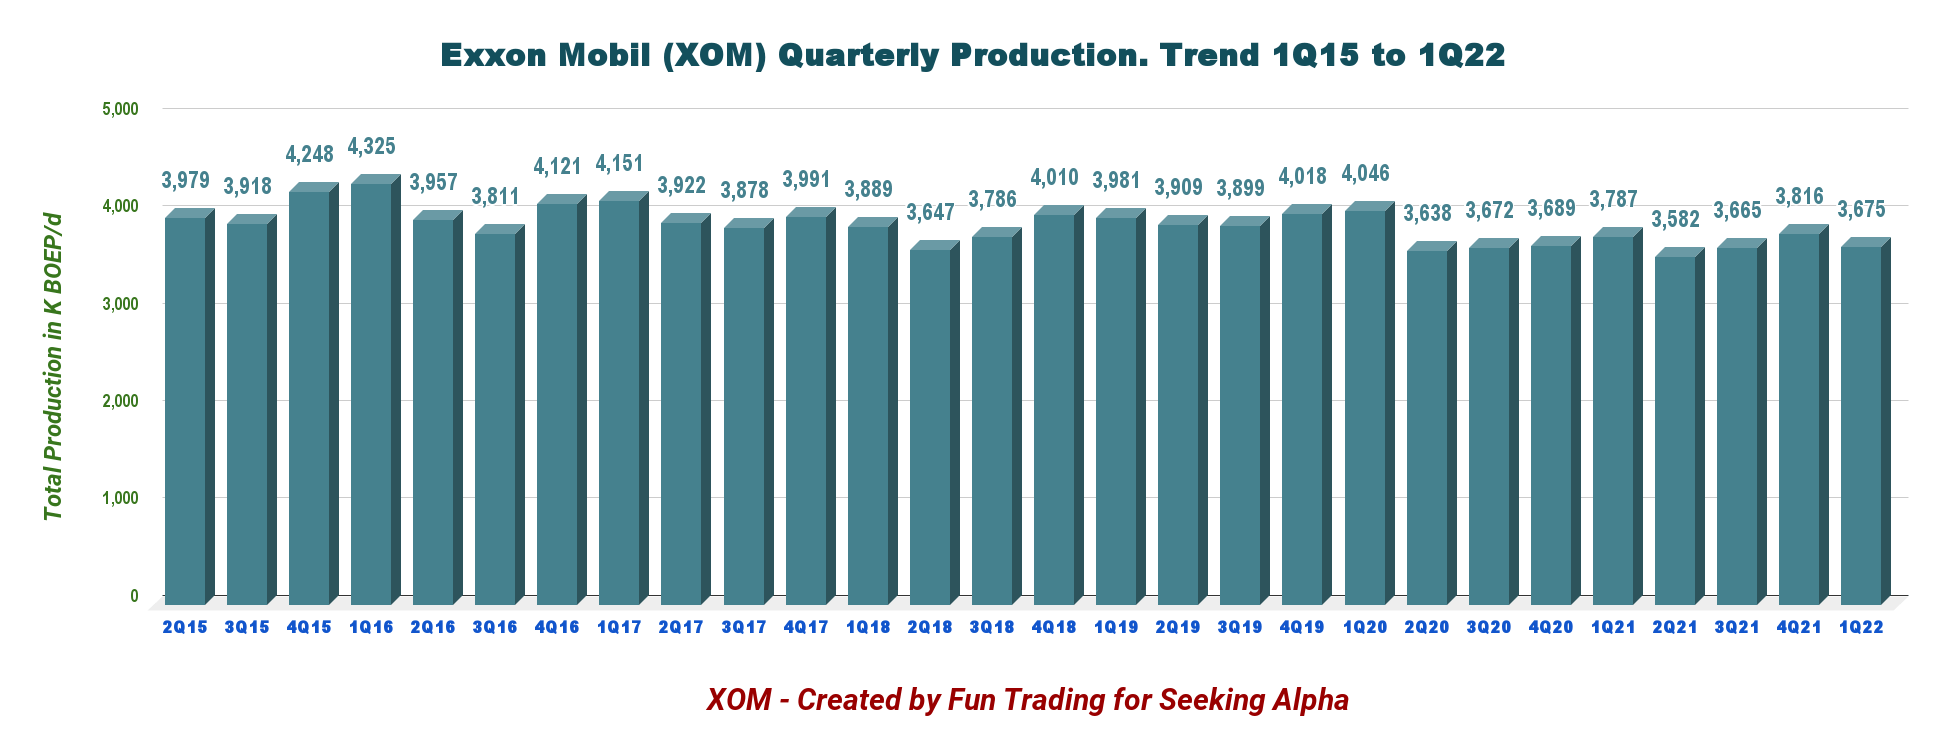
3 - Oil production in K Boep/d
3.1 - Upstream segment
XOM Quarterly oil equivalent production history (Fun Trading)
Combining oil and gas production, Exxon Mobil produced 3,675K Boep/d in 1Q22, down 3% yearly and down 3.7% sequentially (please see graph history above). The low production volume was due to planned maintenance and weather-related unscheduled downtime.
Liquids represented 2,266K Boep/d or 61.7% of the total output. Total U.S. production represented 33.1% of the total output in 1Q22.
XOM Quarterly US production history (Fun Trading)
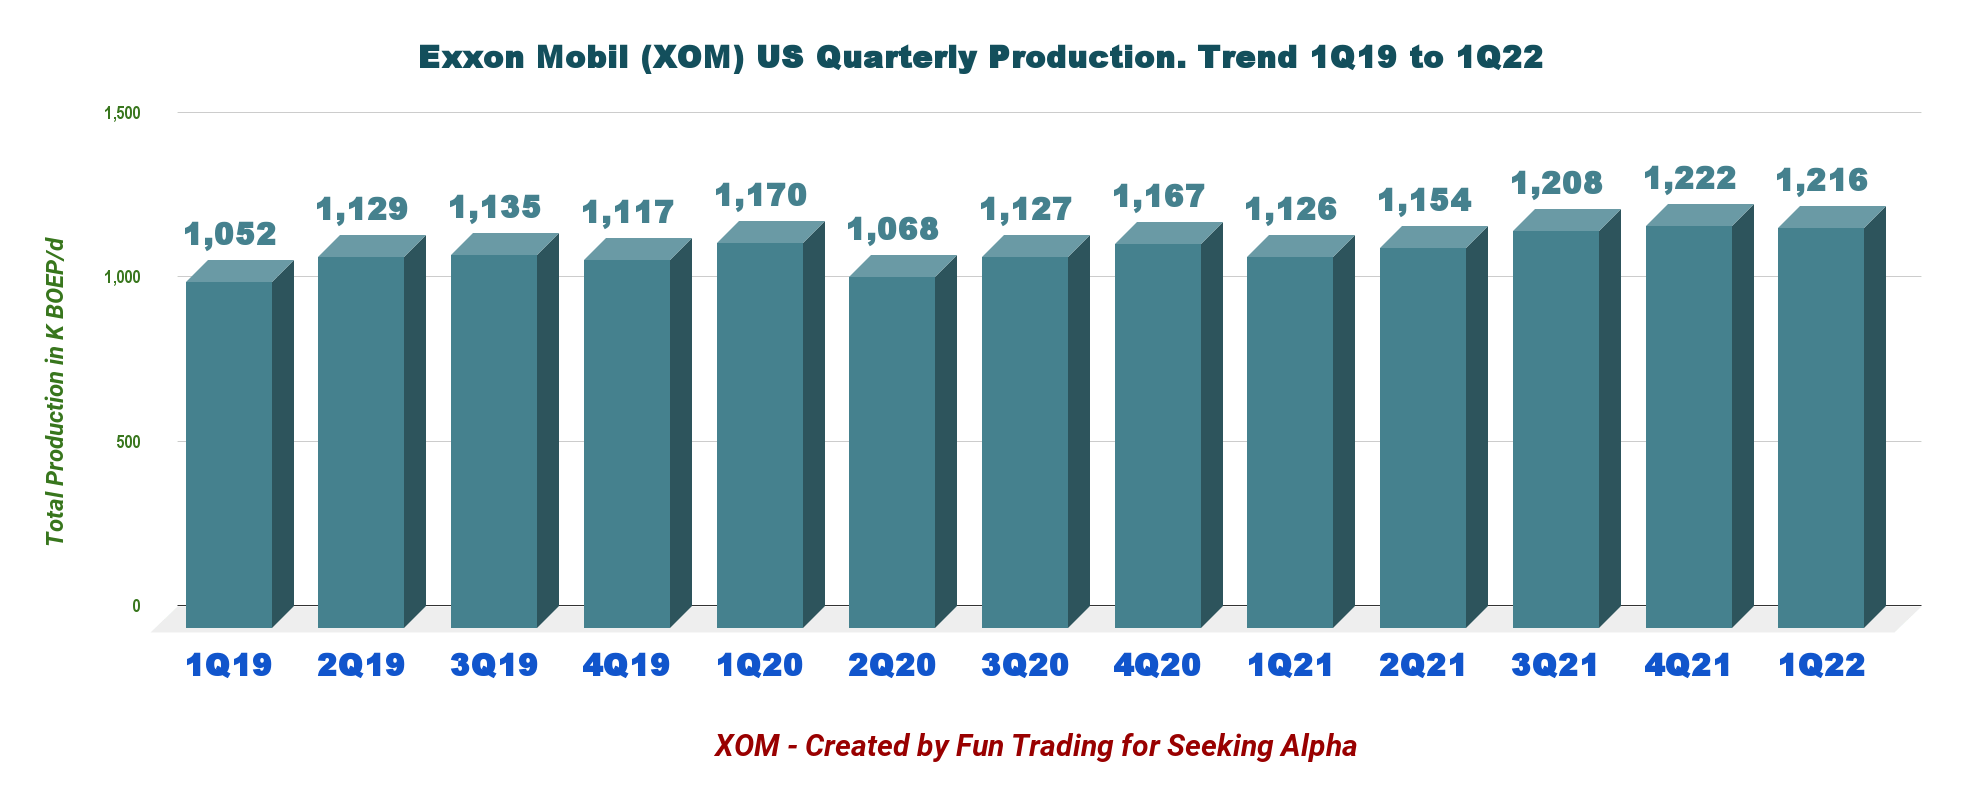
3.2 - Details US production:
XOM Quarterly Detail production history (Fun Trading)
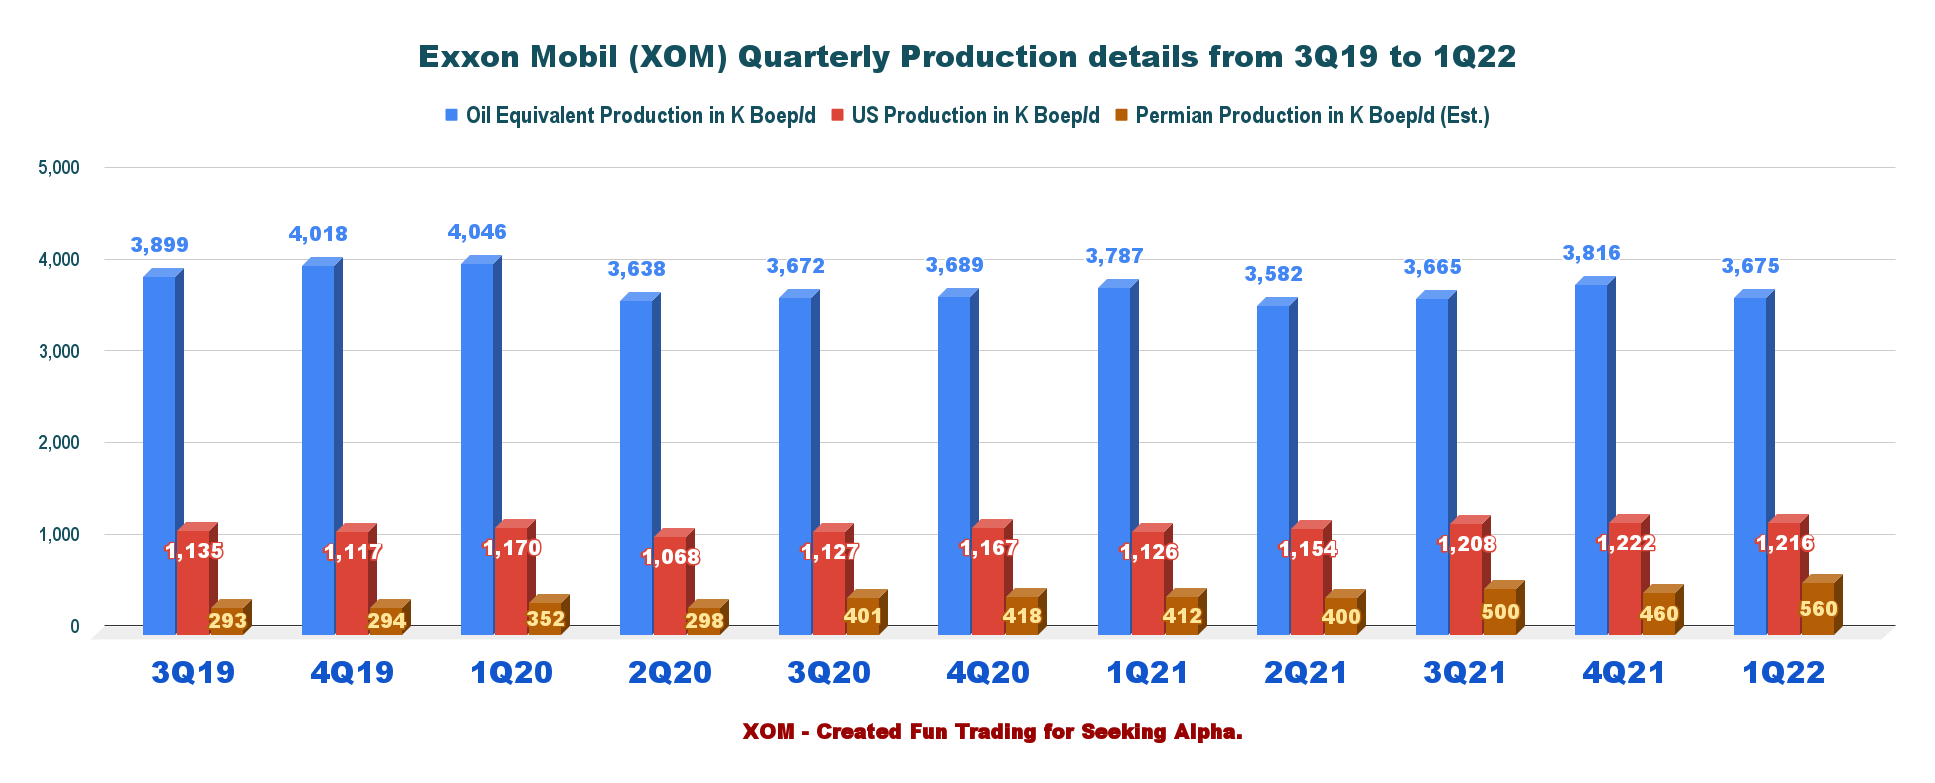
Production in the Permian Basin increased to 560K Boep/d, up 35.9% compared to the same quarter a year ago and up 21.7% sequentially.
3.4 - The downstream and chemical segment
The downstream earnings came at a profit of $1,467 this quarter, up from a loss of $1,211 million last year.
Exxon Mobil's refinery throughput averaged 3,983 MBbls/d, up from 3,751 MBbls/d. Petroleum product sales increased to 5,158 MBbls/d from 4,881 MBbls/d a year ago.
For the Chemical segment, the earnings in 1Q22 were $1,354 million compared to $1,415 million in 1Q21. Product sales increased to 6,737 thousand metric tons from 6,446 kt a year ago.
CEO Darren Woods said in the conference call:
At the end of the first quarter, we implemented a series of organizational changes to further leverage the scale and integration of the corporation, improve the effectiveness of our operations and better serve our customers. We combined our Downstream and Chemical operations into a single Product Solutions Business. This new integrated business will be focused on developing high-value products, improving portfolio value and leading in sustainability.
Outlook for 2Q22 for Downstream and Chemicals:
XOM Outlook 2Q22 Downstream and Chemical (Exxon Mobil Presentation)
4 - Net Debt significantly down to $36.5 billion in 1Q22
XOM Quarterly Cash versus Debt history (Fun Trading)
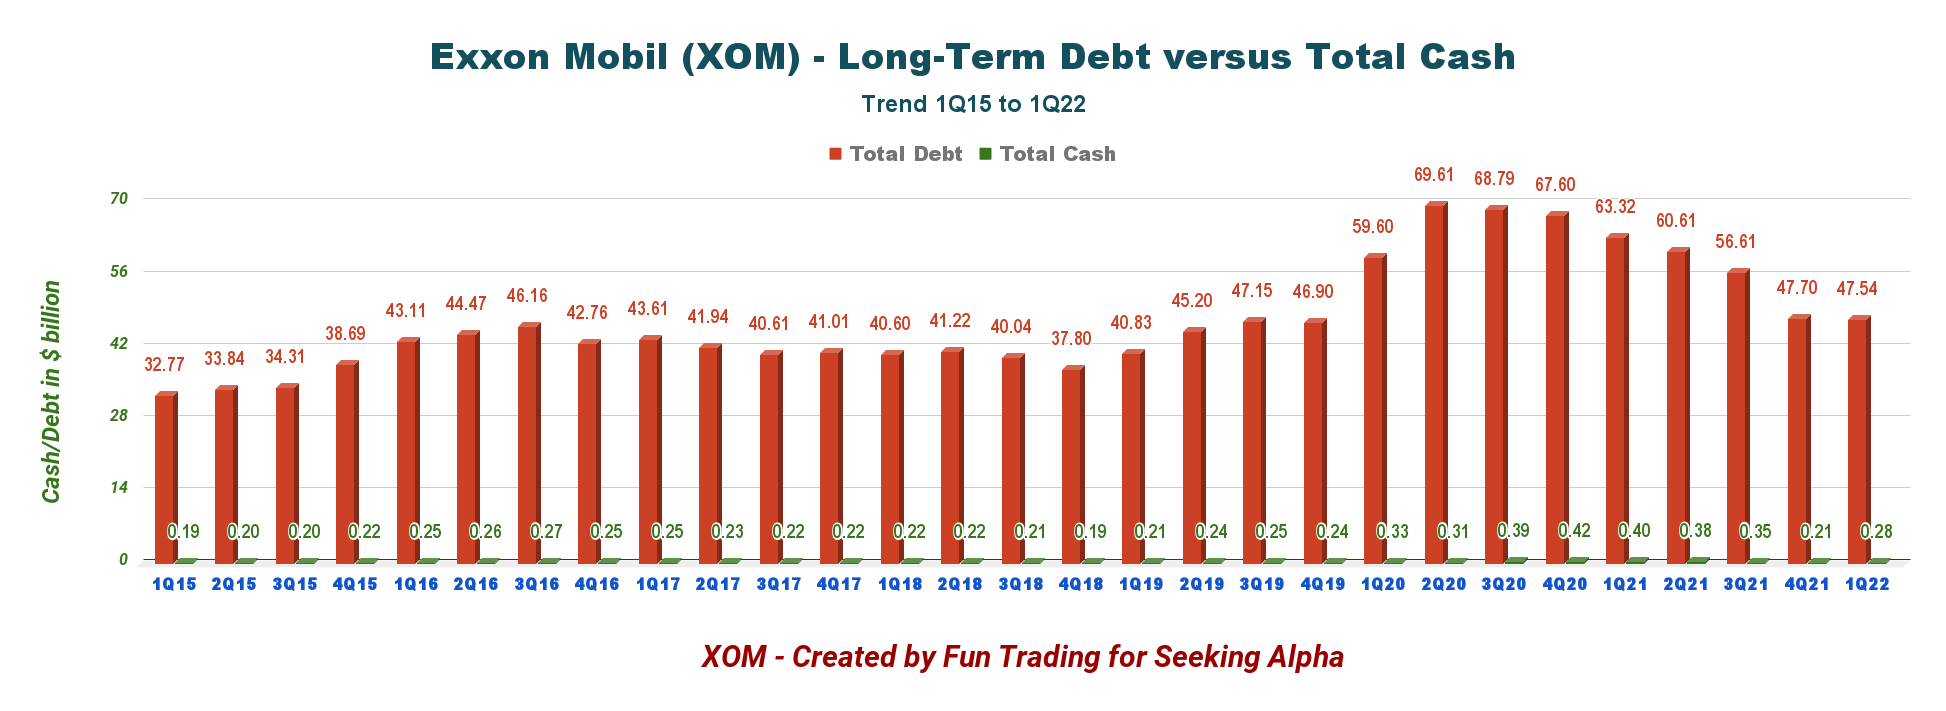
Exxon Mobil's net debt is now $36.5 billion, with a Debt to EBITDA ratio of 0.6x. (Source: Fun Trading)
XOM Quarterly Debt to EBITDA ratio history (Fun Trading )
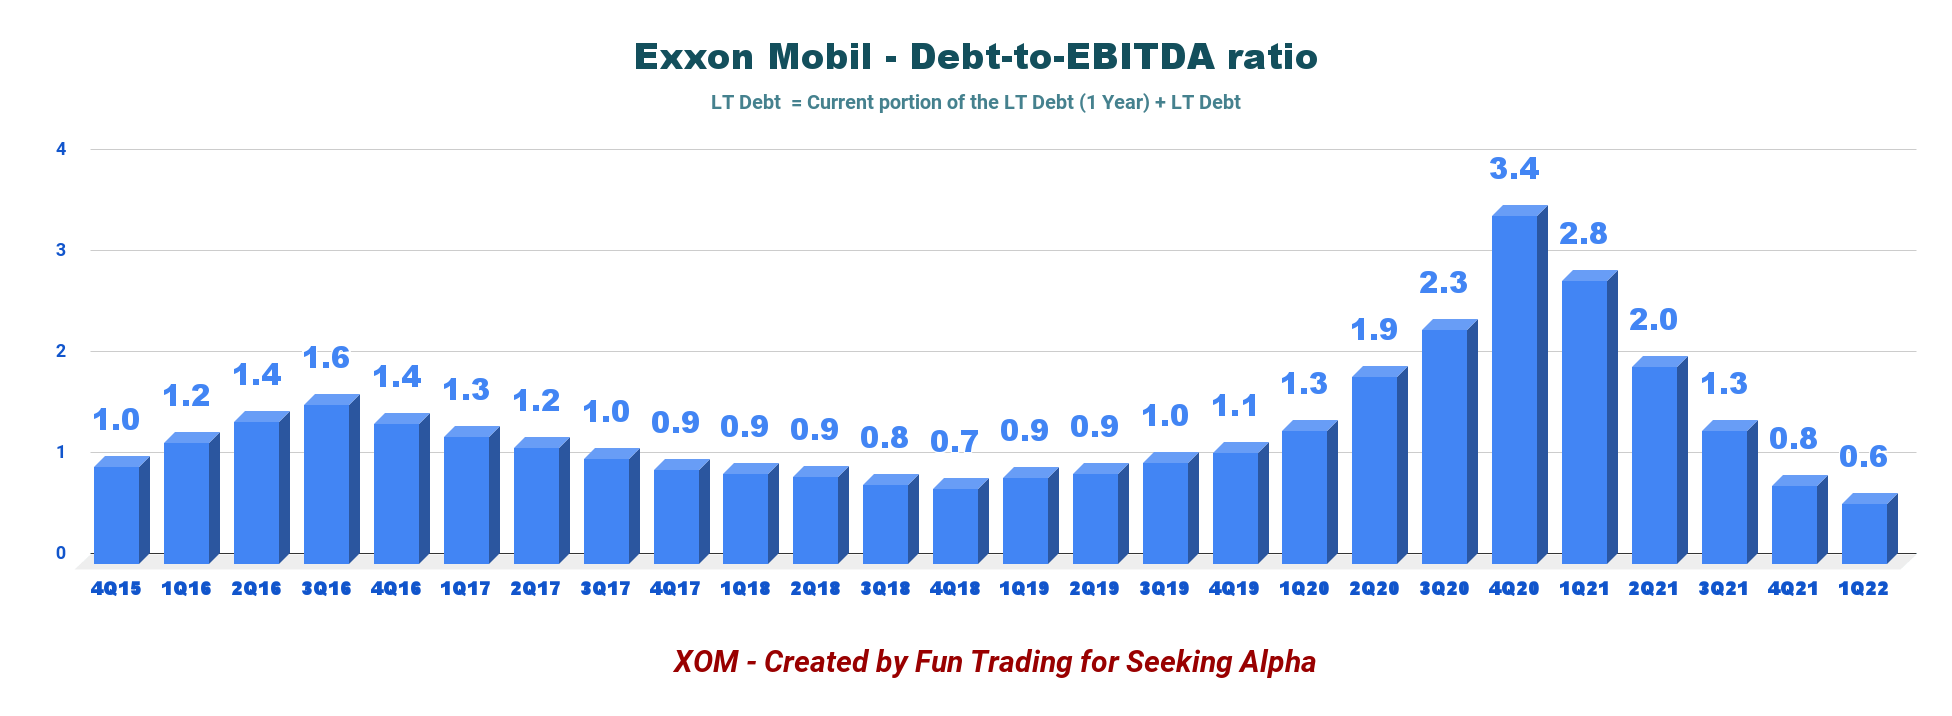
Exxon Mobil's debt situation is getting better. The company indicates the debt-to-Capital ratio at 21%.
5 - Company's outlook for the 2Q22
The upstream is expected to deliver a better production overall, driven by Permian and Guyana Growth. However, the company expects higher schedule maintenance in 2Q22.
Inflationary pressure is expected to affect the overall business.
XOM 2Q22 outlook (Exxon Mobil)
This quarter saw the successful start of the Liza Phase 2. Production is ramping up ahead of schedule and is expected to reach capacity of 220,000 barrels of oil per day by the third quarter of this year. Combined with Liza Phase 1, we will bring our total production capacity in Guyana to more than 340,000 barrels per day. Our third project Payara is running ahead of schedule with start-up now likely by year-end 2023. Yellowtail, the fourth and largest project to date on the Stabroek Block, received government approval of our development plan, is on schedule to start up in 2025.
Technical Analysis and Commentary
XOM TA Chart short term (Fun Trading) Note: The chart is adjusted for dividends.
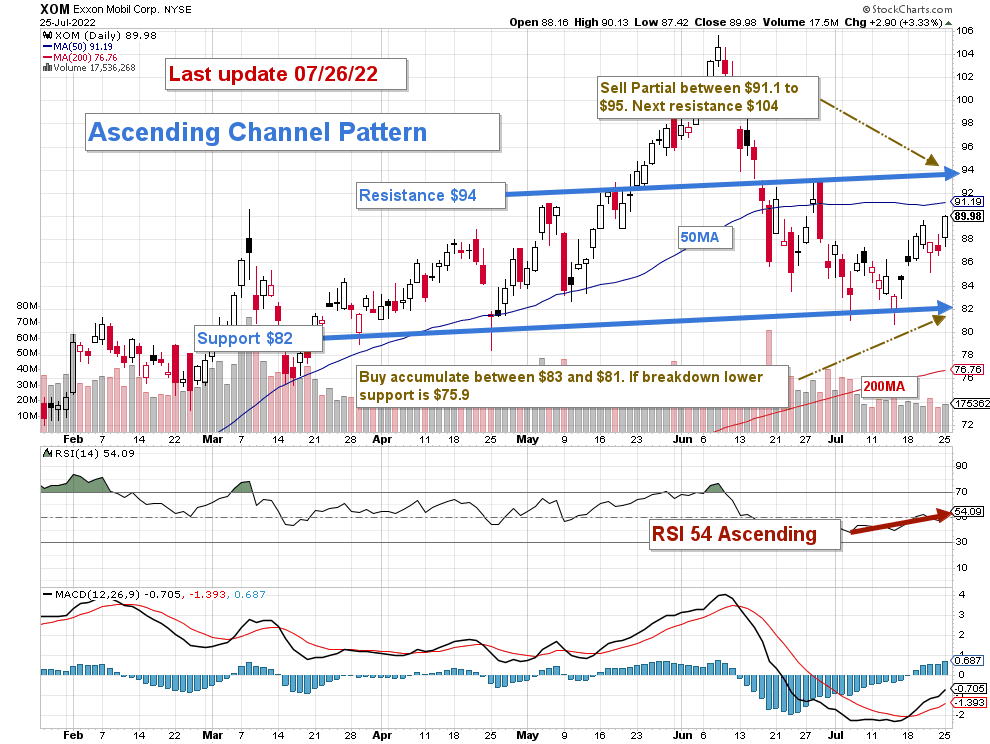
XOM forms an ascending channel pattern with resistance at $94 and support at $82
Oil is rising now, but I believe it is temporary and will probably retrace in Q4. It is perhaps wise to use the recent rally to take some profits. I think selling 30% (Trading LIFO) between $91.1 (50MA) and $95 and waiting for $83 and $81 to consider adding again is wise.
The FED is expected to hike the interest rate by 75-point this week, which may tip the economy into recession. In this case, oil demand will be reduced and may hurt oil stocks. If it happens, XOM could fall back to $82 with potential low support at $76.8.
Warning: The TA chart must be updated frequently to be relevant. It is what I am doing in my stock tracker. The chart above has a possible validity of about a week. Remember, the TA chart is a tool only to help you adopt the right strategy. It is not a way to foresee the future. No one and nothing can.
Author's note: If you find value in this article and would like to encourage such continued efforts, please click the "Like" button below as a vote of support. Thanks!
For further details see:
Exxon Mobil: Perhaps Time To Take Some Profits While It Is Red Hot