OPRA - Fairlight Alpha Fund Q2 2023 Letter
2023-07-29 08:05:00 ET
Summary
- Fairlight Capital LLC is a Value-focused alternative asset manager based in Greenwich, CT.
- Fairlight Alpha Fund's second quarter 2023 returns were 7.3% net of fees, compared to 8.7% for the S&P 500 Total Return index.
- The fund has returned 487.0% net of fees since inception and 50.4% on an annualized basis.
- The fund has performed well in 2023, benefiting from the strong performance of technology companies, particularly those involved in artificial intelligence.
Dear Partners,
Fairlight Alpha Fund’s second quarter 2023 returns were 7.3% net of fees. This compares to 8.7% for the S&P 500 Total Return index. Overall, since inception the fund has returned 487.0% net of fees and 50.4% on an annualized basis.
Performance vs. the S&P 500
We track the net asset value of Fairlight Alpha Fund (the “Fund”) over time as calculated by our fund administrator based on our portfolio positions and prices over time on a dollar basis. The fund financials are also audited each year by an independent auditor with the assistance of the Fairlight management company and the fund administrator.
The tables below show the S&P 500 total return and partnership net returns, after fees, for each year 2019-2023, followed by the compounded returns over the same period, as well as the annualized gains.
| Annual Returns | |||
|---|---|---|---|
| Year | Fairlight Alpha Fund | Difference | |
| 2019 [1] | |||
| 38.1% | |||
| 17.9% | |||
| 20.1% | |||
| 2020 | |||
| 26.3% | |||
| 18.4% | |||
| 7.9% | |||
| 2021 | |||
| 146.5% | |||
| 28.7% | |||
| 117.8% | |||
| 2022 | |||
| 15.8% | |||
| -18.1% | |||
| 33.9% | |||
| 2023 (YTD) | |||
| 17.9% | |||
| 16.9% | |||
| 1.0% | |||
| Compounded Returns | |||
| Year | Fairlight Alpha Fund | S&P 500 (Total Return) | Difference |
| 2019 1 | |||
| 38.1% | |||
| 17.9% | |||
| 20.1% | |||
| 2020 | |||
| 74.4% | |||
| 39.6% | |||
| 34.7% | |||
| 2021 | |||
| 329.9% | |||
| 79.7% | |||
| 250.2% | |||
| 2022 | |||
| 397.9% | |||
| 47.2% | |||
| 350.7% | |||
| 2023 (YTD) | |||
| 487.0% | |||
| 72.0% | |||
| 415.0% | |||
| Annualized Gain | |||
| 50.4% | |||
| 13.3% | |||
| 37.1% |
|
The fund has performed well in 2023, against a backdrop of a strong S&P 500 performance. It’s interesting to note that the character of the S&P 500 index returns this year has featured a strong component of technology businesses, partly driven by the AI wave. The difference between the equal weight and standard weighted index performance is the largest seen, highlighting this concentrated performance. Technology companies riding the Artificial Intelligence wave include Nvidia ( NVDA ), Microsoft ( MSFT ), Alphabet ( GOOG , GOOGL ) , Apple ( AAPL ), Amazon ( AMZN ), and META that have added over $3 trillion in market cap so far this year.
Market and Portfolio Performance
The portfolio has also benefited from some of the Artificial Intelligence tailwinds seen this year. We have had a recent bias towards technology stocks in different sub-sectors and this has been of some benefit this year. It’s key to note that businesses that have been historically labelled technology are encompassing wider and wider areas, and it is becoming easier to label more and more businesses as “technology”.
We own businesses that span IT services, electronic equipment, instruments and components, and software. All of these are categorized as technology, and there are elements of many of our other businesses that have significant technological aspects to their products and services. In particular this year, our position in Opera Ltd. ( OPRA ) has benefitted from the surge of interest in AI. We originally purchased Opera because of their overlooked move towards higher ARPU users in the browser market, cash and investee balances, unique product offerings and ability to quickly develop, enhance and release new software. They demonstrated this by releasing new functionality within their browsers called Aria [2] to allow users to access OpenAI’s GPT LLMs [3] . These allow the user to obtain summaries of web pages, ask questions on any topic, get assistance with writing in a variety of forms and obtain recommendations across a range of products and services.
The interest in AI has helped drive additional gains in our Opera position. We reduced our holding somewhat but have kept a meaningful position because we believe that there is still a lot of business runway ahead for Opera and a large TAM. Their current share of the browser market is still only estimated to be 3.2% [4] . This share is growing, and there is still a lot of potential market share left and Opera’s unique business model comprising specific types of browsers such as Opera GX is giving them a lot of browser user hours. The value of the real estate of young gamers and other users being in front of the Opera browsers for many hours each day is likely undervalued by the market.
Remaining on the theme of technology, we have held a position in Pax Global ( PXGYF ) for some time, which remains good value. The Point of Sale ((POS)) technologies that Pax has developed in both hardware and software are market leading, combining their Android SmartPOS terminals with the MAXSTORE platform and apps. They have progressed the POS from a standalone solution to a technology that enables a host of retail solutions, tailored to use cases spanning payment acceptance, stock control, ticket sales, restaurant bookings, loyalty programs, gift cards and employee management.
Part of the reason for the cheapness may still be because of past security concerns over the company. This has been shown to be a false concern recently, because the company has been elected to the Board of Advisors for the PCI (Payment Card Industry) Security Standards Council. They now sit alongside other western POS industry leaders such as Ingenico and Verifone.
We expect there will be continued growth in Pax’s business driven by their market-leading technology. Revenue growth over the last five years to 2022 has been 124.5% and eps growth has been 278.0%. Anecdotally we are seeing more of their best-selling A920 POS machines in different retail settings. For any readers out there, feel free to let us know if you see them on your travels this summer! Given the continued cheapness in this name we will maintain a meaningful weighting in the portfolio that will benefit from the continued business progress and growth.
Levels of market cheapness across the world will be discussed more in the next section. But we are seeing some interesting ideas and opportunities across not just East Asia and North America, but also in Europe, with some in South America as well. An interesting idea we have come across in discussions with other investors is in Sweden (trading on the Nasdaq Nordic exchange within the Nasdaq First North Growth Market). Intellego Technologies is closer to the beginning of its business life cycle but has an exceptionally interesting product based on photochromic dyes that change color with exposure to ultra-violet light.
The company manufactures these dyes into cards and tabs that can be used in a variety of retail and industrial settings. Other manufacturers have also signed contracts with them to use the dyes in custom made applications. The technology has a number of use cases from protection against skin cancer, UV-C disinfection, food processing and semi-conductor manufacture. The business is trading at cheap levels even based on contracts signed to date but has LOIs that could increase future revenues by a significant margin and is signing new contracts every month.
We are looking at a number of other ideas and have built positions in some we have not yet discussed. In particular there is a business that is benefitting from the recovery in supply chains for specific types of products, with the input costs having reverted to pre-lockdown levels and demand for their products increasing. We are still building some of these positions and so we will give a little more detail in future letters.
Global Markets in H1 2023
We focus on bottom-up analysis of stocks, but in doing so macro themes become apparent and patterns appear across geographies and sectors. Some countries are clearly cheaper than others on a wide variety of metrics that one might care to choose, and so it’s interesting to compare this to topdown measures of cheapness. See the table below for the CAPE measure [5] across several major countries:
Table 1: CAPE ratio by country.
| Country | CAPE [6] |
|---|---|
| United States | |
| 30.9x | |
| Canada | |
| 21.5x | |
| Brazil | |
| 12.9x | |
| Mexico | |
| 19.4x | |
| Australia | |
| 20.4x |
| UK |
| 15.8x |
| France |
| 25.7x |
| Germany |
| 19.9x |
| Italy |
| 20.1x |
| Sweden |
| 19.9x |
| Spain |
| 15.6x |
| Poland |
| 9.3x |
| Netherlands |
| 33.2x |
| Hong Kong |
| 15.2x |
| China |
| 11.5x |
| Singapore |
| 13.7x |
| Korea |
| 13.7x |
| Japan |
| 22.7x |
This measure isn’t perfect and has its drawbacks but does mirror what we have seen from our bottom-up analysis. The CAPE measure takes a 10-year measure of earnings and so is subject to lag, different jurisdiction accounting standards, and inflation adjustment assumptions. It has been shown to have some indicative power of future returns, but with a wide range of outcomes, so is merely a useful tool to indicate where it might be most fruitful to search for ideas. Also, bearing in mind that levels of cheapness often persist for extended periods of time. The US will likely remain more expensive than Poland for example, and countries like the Netherlands could have a skew from individual stocks like ASML Holdings N.V. that are global leaders in their field.
Our bottom-up view of the global markets has highlighted that there are a number of opportunities and no shortage of ideas. This also appears to be backed up by top-level figures 7 that show there is an above average level of dispersion of returns in the markets. The valuation dispersion is also high at the moment and from what we see is even more pronounced in the small-cap and micro-cap segment of the market. We believe that this points to the near future as being a potentially good one from a stock picker’s perspective.
As mentioned earlier the large-cap technology names drove a lot of S&P 500 performance so far this year. This effect was seen across the other indexes as well, with the Russell 1000 Value returning 4.1% in Q2 and the Russell Growth Index, 12.8% with YTD returns of 5.1% for Value and 29.0% for growth respectively for these two indexes. Performance in GARP names is closer to that of Value with the S&P 500 GARP index returning 10.8% YTD.
Stellar Evolution vs. Business Snapshots
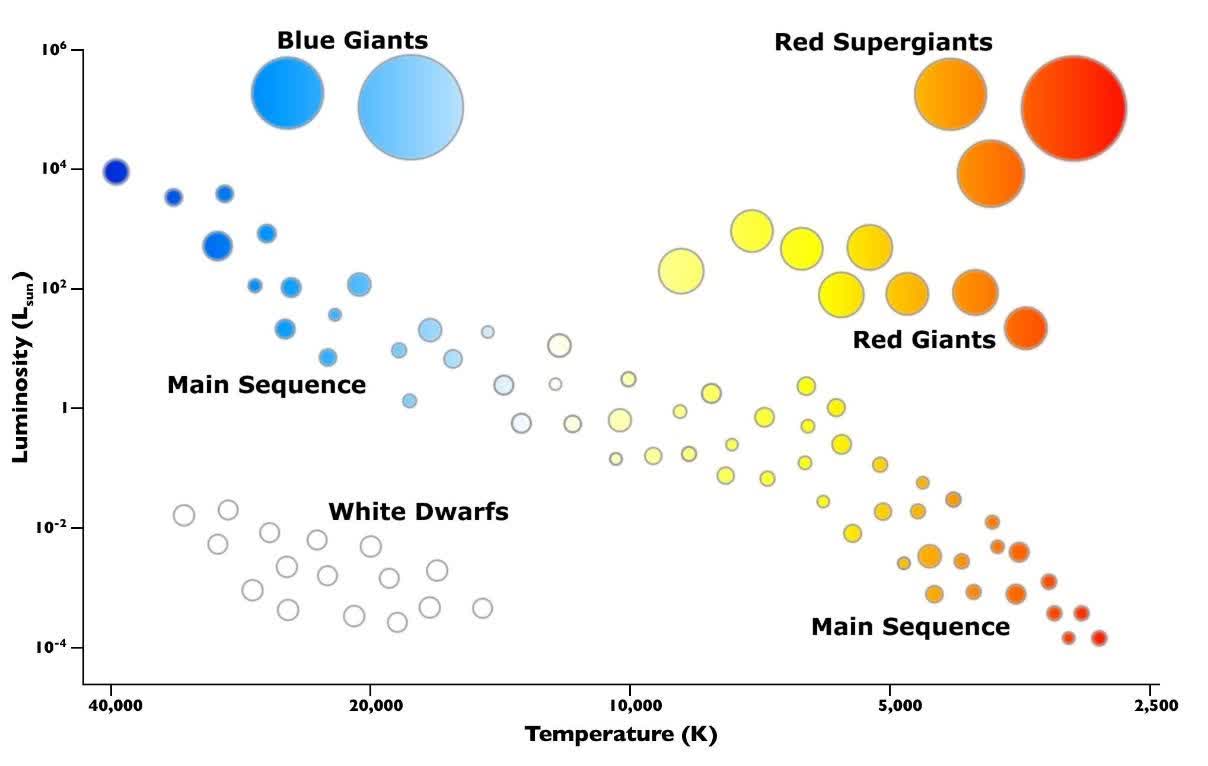
The Hertzsprung-Russell diagram, often abbreviated as the H-R diagram, is a fundamental tool in astrophysics that plots the luminosity of stars against their spectral type or color, often interpreted as surface temperature. This scatter plot, first developed independently by Ejnar Hertzsprung and Henry Norris Russell in the early 20th century, allows astronomers to identify various groupings and evolutionary stages of stars (see Figure 1). The main sequence, which is a diagonal band running from the top-left to the bottom-right of the diagram, contains stars that are in the phase of fusing hydrogen into helium in their cores. This includes our Sun and represents the majority of stars. Above the main sequence are the (blue and red) giants and supergiants, which are stars in later stages of their evolution and are characterized by larger radii and higher luminosity. Below the main sequence are the white dwarfs, which are remnants of stars that have exhausted the fuel in their cores. The H-R diagram is invaluable for understanding stellar evolution as it visually illustrates how stars change in luminosity and temperature over time.
Figure 1: The Hertzsprung-Russell (H-R) diagram of the stellar main sequence.
Drawing parallels with business evolution, we can think of the birth of a company as analogous to a star forming and beginning its life on the main sequence of the H-R diagram. When a business is new and finding its place in the market, it's akin to a star that's igniting its core and starting nuclear fusion. As the company grows and establishes itself, it climbs up the main sequence, its metaphorical luminosity being its market share and influence. Depending on its business “mass” how powerful its product, services or business niche is, this determines how much market share, influence it obtains and how “brightly” it shines. For example, think of Apple on the left-hand portion of the chart, it has a high temperature, or innovation level and obtains an exceptional level of business luminosity and ultimately becomes a blue giant.
Eventually, a mature business may pass its peak, like a star evolving into a giant or supergiant. This stage is characterized by expanded operations and perhaps diversification into new markets. However, if a business fails to innovate or adapt to market changes, it may start to decline, which is comparable to a star depleting its nuclear fuel and becoming a white dwarf. In the business world, this could be seen as downsizing, selling off assets, or ultimately facing bankruptcy. The H-R diagram’s illustration of stellar life cycles reminds us of the phases that businesses undergo, highlighting the changes and innovation that occur in their lifespans.
When we search for businesses, but searching through thousands of stocks and 10Ks, we see each one at a single point in time of its life cycle. The perfect investment would be to find a protostar that will ultimately become a brightly shining star, but more likely we will find businesses at some randomly selected point in their journey. A key part of the assessment is then, not just where they are in their journey, but what their evolution will be. Do they have a unique product, or service, opportunity or business moat that means that they will evolve into a brightly shining star?
Outlook for the Remainder of 2023
The banking crisis of March-April was a timely reminder that markets can be volatile, but at the same time they then present us with great opportunities. We remain fully invested and remain optimistic about the future. As Peter Lynch said, “there’s always something to worry about”, and there always will be, but looking at specific businesses you can’t help but feel there are lots of bright days ahead.
We thank our partners for their support and do not take this for granted. We manage others’ money like our own, and fully understand the value of each dollar invested with us to our partners.
Yours,
Andrew Martin, Chief Executive Officer
Michael Saunders, Head of Marketing and Investor Relations
Footnotes1 The Fairlight Alpha Fund was launched on 01-Mar-2019 and so the 2019 performance and returns are presented for a 10-month period. 2 The company said even the name Aria had been created by the AI algorithms. 3 GPT: Generative Pre-trained Transformers; LLM: Large Language Models. a class of AI language models, like GPT, which are trained on massive datasets and have the capability to understand, generate, and process human language in various applications. 4 See statcounter GlobalStats for browser market share worldwide: Browser Market Share Worldwide | Statcounter Global Stats 5 CAPE: Cycle-adjusted price-to-earnings ratio or Shiller ratio. Measures the current market valuation levels to the last 10-years of earnings. This is meant to average across economic cycles. 6 Calculated as of June 30, 2023. Calculated by Barclays research based on MSCI data. ( Barclays indices) 7 See S&P Global’s dispersion, volatility and correlation dashboard: https://www.spglobal.com/spdji/en/documents/performance-reports/dashboard-dispersion-volatilitycorrelation.pdf |
| THIS IS NOT AN OFFERING OR THE SOLICITATION OF AN OFFER TO PURCHASE AN INTEREST IN FAIRLIGHT ALPHA FUND LP (THE “FUND”). ANY SUCH OFFER OR SOLICITATION WILL ONLY BE MADE TO QUALIFIED INVESTORS BY MEANS OF A CONFIDENTIAL OFFERING MEMORANDUM AND ONLY IN THOSE JURISDICTIONS WHERE PERMITTED BY LAW. AN INVESTMENT IN THE FUNDS IS SPECULATIVE AND INVOLVES A HIGH DEGREE OF RISK. OPPORTUNITIES FOR WITHDRAWAL, REDEMPTION AND TRANSFERABILITY OF INTERESTS ARE RESTRICTED, SO INVESTORS MAY NOT HAVE ACCESS TO CAPITAL WHEN IT IS NEEDED. THERE IS NO SECONDARY MARKET FOR THE INTERESTS AND NONE IS EXPECTED TO DEVELOP. THE FEES AND EXPENSES CHARGED IN CONNECTION WITH THIS INVESTMENT MAY BE HIGHER THAN THE FEES AND EXPENSES OF OTHER INVESTMENT ALTERNATIVES AND MAY OFFSET PROFITS. NO ASSURANCE CAN BE GIVEN THAT THE INVESTMENT OBJECTIVE WILL BE ACHIEVED OR THAT AN INVESTOR WILL RECEIVE A RETURN OF ALL OR PART OF HIS OR HER INVESTMENT. INVESTMENT RESULTS MAY VARY SUBSTANTIALLY OVER ANY GIVEN TIME PERIOD. THE PERFORMANCE DATA SHOWN HEREIN REPRESENTS THE PERFORMANCE OF THE FUND. THE RESULTS REFLECT THE DEDUCTION OF: (I) AN ANNUAL ASSET MANAGEMENT FEE OF 2%, CHARGED QUARTERLY; (II) A PERFORMANCE ALLOCATION OF 20%, TAKEN QUARTERLY, SUBJECT TO A “HIGH WATER MARK;” AND (III) TRANSACTION FEES AND OTHER EXPENSES ACTUALLY INCURRED BY THE FUND. THE RESULTS REFLECT THE IMPLEMENTATION OF THE INVESTMENT STRATEGY DESCRIBED IN THE FUNDS’ OFFERING DOCUMENTS AND APPLIED IN THE FUNDS’ TRADING ACCOUNTS. ALL INVESTMENTS INVOLVE RISK, INCLUDING THE LOSS OF PRINCIPAL. RESULTS ARE COMPARED TO THE PERFORMANCE OF THE S&P 500 TOTAL RETURN INDEX (THE “COMPARATIVE INDEX”) FOR INFORMATIONAL PURPOSES ONLY. THE FUND’S INVESTMENT PROGRAM DOES NOT MIRROR THE COMPARATIVE INDEX AND THE VOLATILITY OF THE FUND’S INVESTMENT PROGRAM MAY BE MATERIALLY DIFFERENT FROM THAT OF THE COMPARATIVE INDEX. THE SECURITIES OR OTHER INSTRUMENTS INCLUDED IN THE COMPARATIVE INDEX ARE NOT NECESSARILY INCLUDED IN THE FUND’S INVESTMENT PROGRAM AND CRITERIA FOR INCLUSION IN THE COMPARATIVE INDEX ARE DIFFERENT THAN THOSE FOR INVESTMENT BY THE FUND. THE PERFORMANCE OF THE COMPARATIVE INDEX WAS OBTAINED FROM PUBLISHED SOURCES BELIEVED TO BE RELIABLE, BUT WHICH ARE NOT WARRANTED AS TO ACCURACY OR COMPLETENESS. UNLESS NOTED OTHERWISE, THE RETURNS OF THE COMPARATIVE INDEX PRESENTED HEREIN DO NOT REFLECT FEES OR TRANSACTION COSTS, BUT THOSE RETURNS DO REFLECT NET DIVIDENDS, IF ANY. PAST PERFORMANCE IS NOT NECESSARILY INDICATIVE OF FUTURE RESULTS. |
Editor's Note: The summary bullets for this article were chosen by Seeking Alpha editors.
For further details see:
Fairlight Alpha Fund Q2 2023 Letter