ANGL - FALN: Fallen Angels The Best Of High-Yield Bonds
2023-08-28 07:41:42 ET
Summary
- iShares Fallen Angels USD Bond ETF invests in high-yield bonds whose issuers previously had an investment grade rating.
- Since FALN's inception in 2016, it has outperformed all kinds of bond ETFs.
- An exception in the bond bear market, it is still above its 200-day moving average.
- Its competitor ANGL has a better track record.
FALN strategy and portfolio
iShares Fallen Angels USD Bond ETF ( FALN ) has been tracking the Bloomberg Barclays US High Yield Fallen Angel 3% Capped Index since 06/14/2016. It has 210 holdings, an expense ratio of 0.25% and a 12-month distribution yield of 5.47%. Distributions are paid monthly.
As described in the prospectus by iShares , the fund invests in U.S. Dollar corporate bonds that have lost their investment grade in average rating by Fitch, Moody's and Standard & Poor's. Each constituent must have at least $150 million of outstanding face value, a fixed-rate coupon and at least one year to maturity. Issuers must be incorporated in developed countries as defined by the index provider. An issuer may have several bonds held in FALN, with an aggregate weight capped to 3% at each reconstitution of the underlying index.
The idea behind this strategy is that among all high-yield bonds, those issued by companies previously rated at investment grade have a lower probability of default. Therefore, a fallen angels bond ETF is expected to outperform a broader junk bond ETF.
FALN holds 210 corporate bonds with an average yield to maturity of 8.02% and an effective duration of 4.74 years. The heaviest country in the portfolio is the U.S., with over 80% of asset value.
The top three sectors are consumer cyclicals (23.6%), energy (14.4%) and communication services (12.8%). Other sectors are below 10%. The sector breakdown may change over time, mostly depending on economic cycles. In general, industries beaten down in the last few years have a higher weight. This is the case in energy after the 2014-2020 oil bear market, and for some subsectors in consumer cyclicals after pandemic-related lockdowns and travel bans.
FALN Industry breakdown (Chart: author; data: iShares)
The next table lists the top 10 issuers, representing 28.2% of asset value.
| Name |
| Sector |
| Location |
| Weight (%) |
| TELECOM ITALIA |
| Communications |
| Italy |
| 3.09 |
| NEWELL BRANDS INC |
| Consumer Non-Cyclical |
| US |
| 2.99 |
| PERRIGO CO |
| Consumer Non-Cyclical |
| US |
| 2.93 |
| FIRSTENERGY CORPORATION |
| Electric |
| US |
| 2.92 |
| FORD MOTOR CO |
| Consumer Cyclical |
| US |
| 2.87 |
| HOWMET AEROSPACE INC |
| Capital Goods |
| US |
| 2.81 |
| LAS VEGAS SANDS CORP |
| Consumer Cyclical |
| US |
| 2.73 |
| SEAGATE |
| Technology |
| US |
| 2.73 |
| ENLINK MIDSTREAM PARTNERS LP |
| Energy |
| US |
| 2.58 |
| EQM MIDSTREAM PARTNERS LP |
| Energy |
| US |
| 2.52 |
Performance
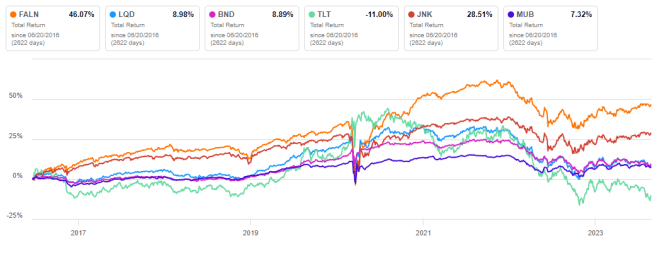
The next chart compares total returns since inception of FALN and five ETFs representing different U.S. bond categories:
- iShares iBoxx $ Investment Grade Corporate Bond ETF ( LQD ),
- Vanguard Total Bond Market Index Fund ( BND ),
- iShares 20+ Year Treasury Bond ETF ( TLT ),
- SPDR Bloomberg Barclays High Yield Bond ETF ( JNK ),
- iShares National Muni Bond ETF ( MUB ).
FALN is the best performer of the list. On this 7-year time interval, it also beats international bond ETFs not represented on this chart: Vanguard Total International Bond Index Fund ( BNDX ), iShares J.P. Morgan USD Emerging Markets Bond ETF ( EMB ) and SPDR FTSE International Government Inflation-Protected Bond ETF ( WIP ). This comparison excludes convertibles bond ETFs like CWB and ICVT . These are hybrid assets whose behavior is closer to equities.
ETFs of various bond categories, total returns since FALN inception (Seeking Alpha)
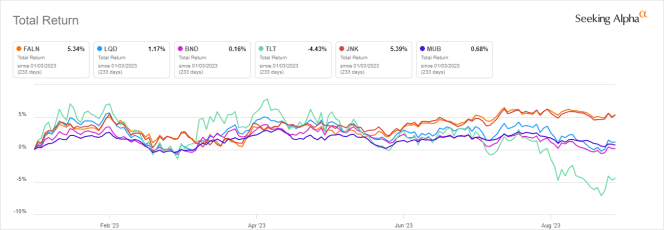
In 2023 to date, FALN is also leading the pack, along with the broader high-yield fund JNK.
ETFs of various bond categories, year-to-date (Seeking Alpha)
The total US bond market, plotted on the next chart as BND, is below the 200-day simple moving average, which is often considered the threshold to declare a bear market.
BND price with 200-day simple moving average (TradingView on Seeking Alpha)
An exception among bond ETFs, FALN is slightly above this threshold (by a short margin, though).
FALN price with 200-day simple moving average (TradingView on Seeking Alpha)
The next chart compares FALN since inception with another fund implementing a similar strategy: VanEck Vectors Fallen Angel High Yield Bond ETF ( ANGL ). The latter is a clear winner.
Fallen angels tactical rotation
Tactical allocation strategies consist of over-weighting assets with the highest probability of future gains. This probability is often arbitrarily measured by past performance. Countless variants are possible depending on the performance metric, weight calculation, look-back period, decision frequency, asset list, number of positions. The next table tracks a strategy with only two ETFs: ANGL and the iShares 7-10 Year Treasury Bond ETF ( IEF ). ANGL is preferred to FALN for this simulation because of a longer price history (inception in April 2012). Every week, it goes long 100% in the ETF with the highest 3-month return, or in cash if both have their prices below the 200-day simple moving average. This rotational model is compared to the total bond market ETF ( BND ). It shows not only a better return, but also a lower risk, measured in maximum drawdown and volatility (standard deviation of monthly returns).
| since June 2016 |
| Total Return |
| Annual Return |
| Drawdown |
| Volatility |
| FALN-IEF Rotation |
| 8.07% |
| 1.09% |
| -5.46% |
| 3.19% |
| BND |
| 2.12% |
| 0.29% |
| -18.58% |
| 5.00% |
Calculations with Portfolio123. Past performance, real or simulated, is not a guarantee of future returns.
The correlation to stocks may boost the performance of fallen angels bond ETFs in a bull market. In any market conditions, FALN may be combined with other bond ETFs in a tactical allocation strategy. The rotation presented here is a simplistic example. QRV Bond Rotation is based on the same idea.
Takeaway
iShares Fallen Angels USD Bond ETF invests in a subset of high-yield bonds whose issuers previously had an investment grade rating. Since inception in 2016, it has outperformed all kinds of bond ETFs (excluding hybrid securities). It is also an exception in the current bond bear market: as of writing, FALN is still above its 200-day moving average. However, ANGL, another fallen angels ETF, has a better track record. Fallen angels ETFs may be used as a long term investment for their high yield, or in a tactical allocation strategy switching between various bond categories.
For further details see:
FALN: Fallen Angels, The Best Of High-Yield Bonds