FPI - Farmland Partners' ~$18.60 Value Is Obscured By Accounting Intricacies
2023-08-15 17:43:40 ET
Summary
- Farmland Partners reports primarily in NAREIT defined FFO and GAAP accounting, which obscures the true value of the company.
- FPI's reported earnings have been underestimating its true earnings.
- FPI's assets, particularly farmland, have appreciated significantly, but this is not reflected in their reported earnings under current accounting standards.
If Farmland Partners ( FPI ) reported by International Financial Reporting Standards (IFRS) which are used by most of the world, its net asset value would be about $18.62 per share.
If FPI reported primarily in standard GAAP accounting you would see big earnings numbers from gains on sale.
But they don’t. They are a U.S. based REIT so they report primarily in NAREIT defined FFO and GAAP accounting is merely shown as a reconciliation of how those FFO figures were obtained.
In this article we will discuss the technical differences between these accounting standards and how they are obscuring the value of FPI.
Accounting subtleties
REIT investors are trained to look at FFO as defined by NAREIT. Those who have been around the block a few times are trained to look at AFFO as well and some will even make adjustments to AFFO such as to consider stock-based compensation a real expense. I make these adjustments frequently in analyzing REITs.
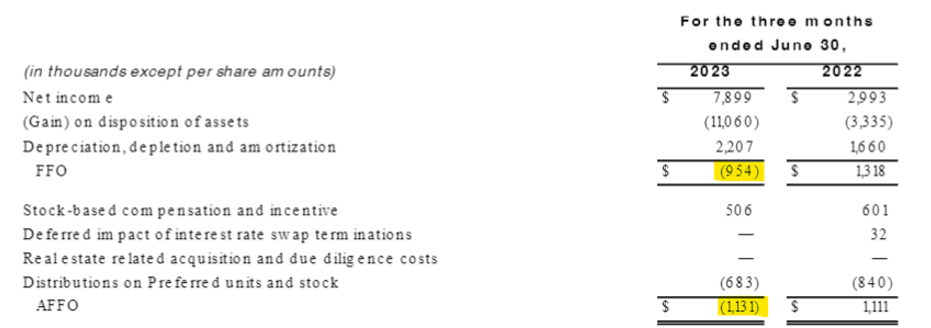
This FFO or AFFO focused approach is so engrained in REIT investors that when Farmland Partners reports second quarter earnings that look like this:
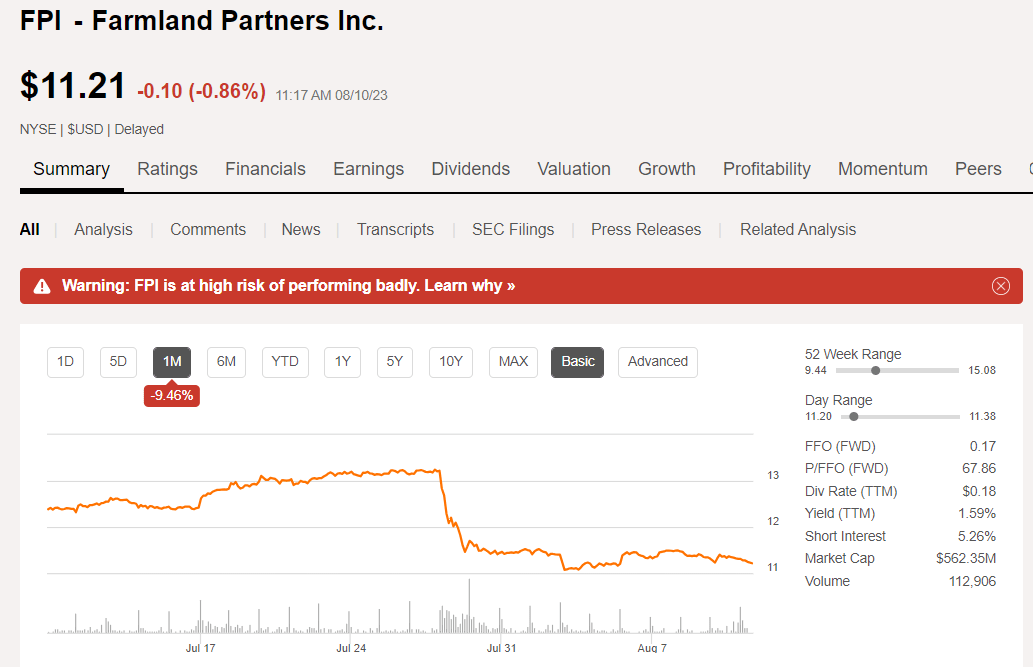
This happens:
FPI plummeted from over $13 to just over $11 in a matter of a few days.
I posit that the perceived weakness is merely an anomaly related to the accounting standards of U.S. REITs. Using just about any other broadly recognized accounting system in the world, I think it is clear that it was actually a good report.
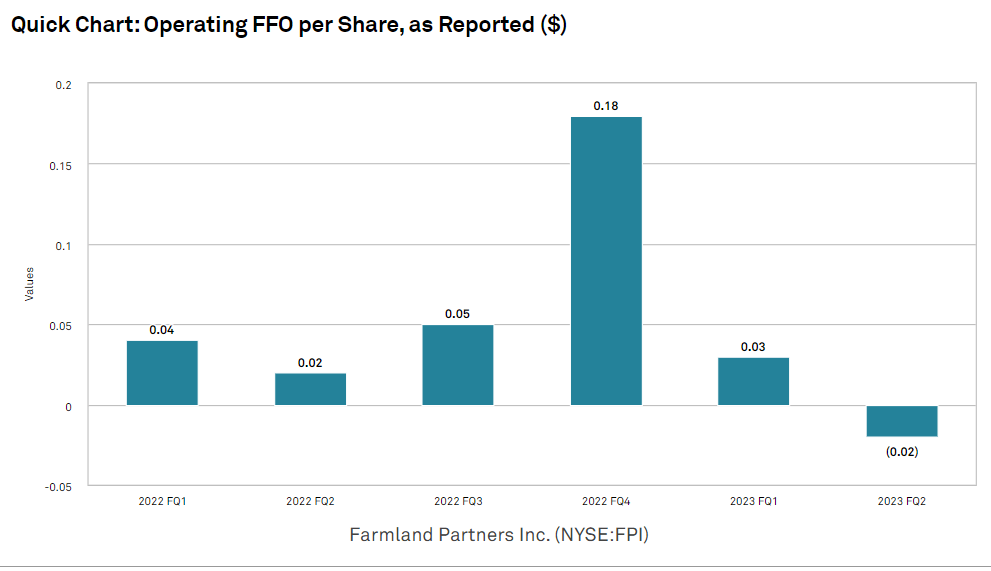
In fact, standard REIT accounting has been under-reporting FPI’s true earnings for a long time. It shows a total of $0.24 of operating FFO over the past 12 months.
True earnings over the past 12 months were closer to $1.82 per share.
That is a huge difference.
So, what are these accounting anomalies?
Under U.S. generally accepted accounting principles or GAAP, assets are recorded on the balance sheet at initial purchase price. From there, they are depreciated over a pre-defined schedule. The depreciation goes in as an expense line which detracts from a company’s net income.
This depreciation was designed for PP&E. Stuff like automobiles, equipment, computers, etcetera - items that need to be replaced. So rather than having lumpy earnings where expenses spike in periods where such things are replaced, accountants amortize these costs over the useful lives of the assets.
It generally works fairly well, but real estate is a bit different because it holds its value. So while most real estate is in GAAP accounting depreciated over a predefined period (usually 30 years), the actual value of the real estate usually holds steady or appreciates.
To account for the steadier value of real estate, NAREIT, the national association of real estate investment trusts, defined a new accounting term, funds from operations (FFO) which has become the standard of reporting for REITs.
To calculate NAREIT defined FFO, one takes GAAP earnings, adds back real estate depreciation and removes gains or losses on sale of real estate. This generally gives a cleaner picture of true earnings because the accounting-only depreciation is a non-cash expense and usually not an expense at all as the assets appreciate.
However, since the book value of the assets still goes to zero, REITs will often recognize massive gains on sale upon selling an asset. These would unfairly spike earnings up, so FFO removes gains on sale along with the depreciation. The net effect is that FFO is smooth over time and roughly approximates run rate cashflows.
It works well for most REITs although investors are still wise to make some adjustments such as maintenance capex and leasing commissions.
Farmland is an entirely different business. Unlike other forms of real estate, farmland does not depreciate in GAAP terms. Thus, the add-back of depreciation which usually helps REIT’s in terms of perceived earnings, does nothing for farmland.
On the negative side, when the land is sold at a huge gain, FFO still removes the gain on sale.
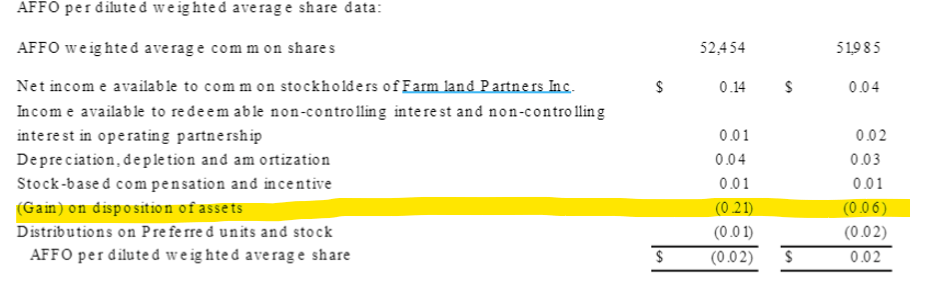
So FPI is getting no help from depreciation add-backs and is not getting credit for its rather substantial gains on sale. Note that in 2Q23 alone FPI had $0.21 per share of gains on sale in GAAP accounting that was removed for FFO and AFFO.
So while the reported figure was a loss of $0.02 per share, the gains on sale would have taken that to a positive $0.19. Rather than missing by a couple of pennies it would have been a substantial beat.
There is nothing fuzzy about these sales. It was a real cash gain above what they paid for the land initially.
I think this is a clear example of how NAREIT FFO and AFFO significantly understate FPI’s earnings, but there is an even bigger misstatement related to appreciation.
In GAAP accounting, assets don’t appreciate. If something goes wrong, the asset can be impaired and written down in value on the balance sheet. However, if an asset triples in value it will continually sit on the books at its initial value.
There are only write-downs, not write-ups.
NAREIT FFO does the same thing. It does not give any credit to appreciation.
At this point, I think it is helpful to turn to the rest of the world for reference.
International Financial Reporting Standards or IFRS records assets at current fair value rather than initial purchase price. If an asset is worth 50% less than purchase price it will be marked down to that level. If an asset doubles it will be marked up to that level.
Fair value is of course an estimate so it is not always precise, but the idea is to carry assets on the balance sheet at some approximation of fair value.
If we were to apply the IFRS treatment to FPI, its book value would be somewhere around $18 per share.
Net asset value calculations
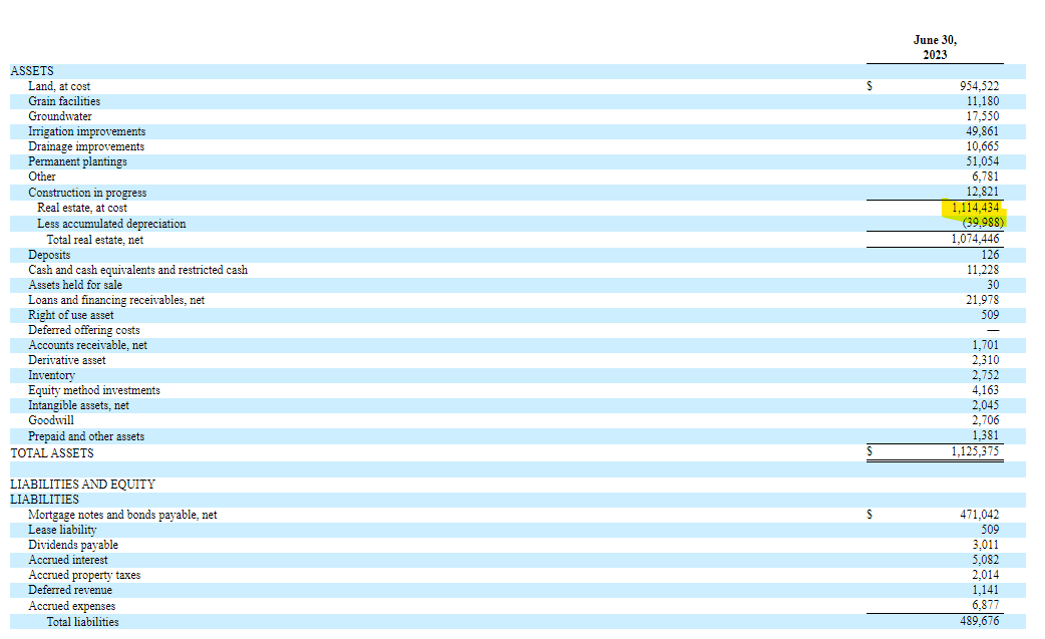
As of 2Q23, FPI has just over $1.1B of real estate at purchase price.
Not all of it appreciates. The land does. The supporting assets like grain elevators or irrigation improvements also tend to appreciate, but the permanent plantings are subject to depreciation. An orchard, for example, has a finite useful life after which it incurs capex as it needs to be re-cultivated.
Overall, FPI has roughly $1.05 billion of appreciating farmland assets.
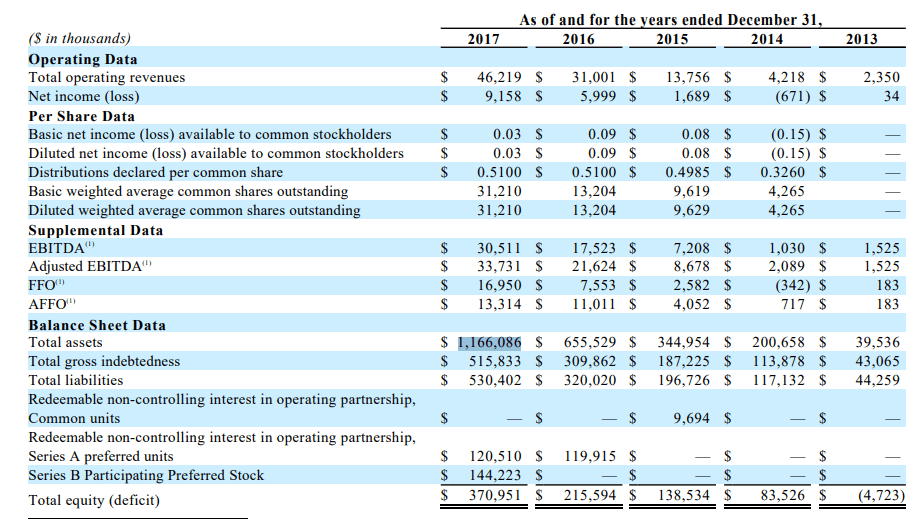
This figure has been remarkably stable for many years. Back in 2017 FPI had the same just over $1.1B in assets.
Since then, the discount in market price relative to NAV has shifted their strategy to buying back stock as the dominant use of capital rather than buying additional farms.
The reason this matters is that their farmland has been on their balance sheet for a very long time. I would estimate roughly a weighted average of six years. As we have been discussing throughout this article, farmland on the balance sheet does not get credit for appreciation.
It is still recorded at what they bought it for minus some minor amount of depreciation on the assets that are depreciable.
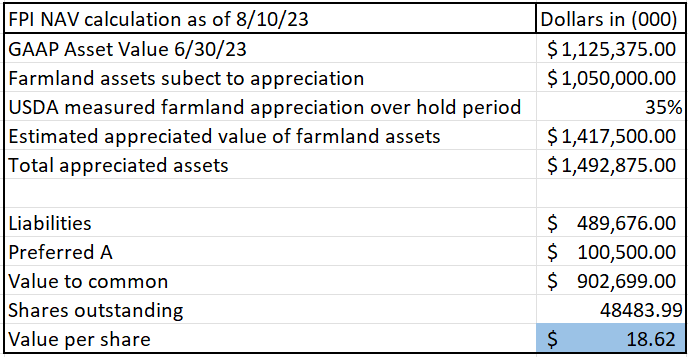
Over that time, farmland has appreciated by about 35%. Thus, the true asset value of FPI is closer to $18.62.
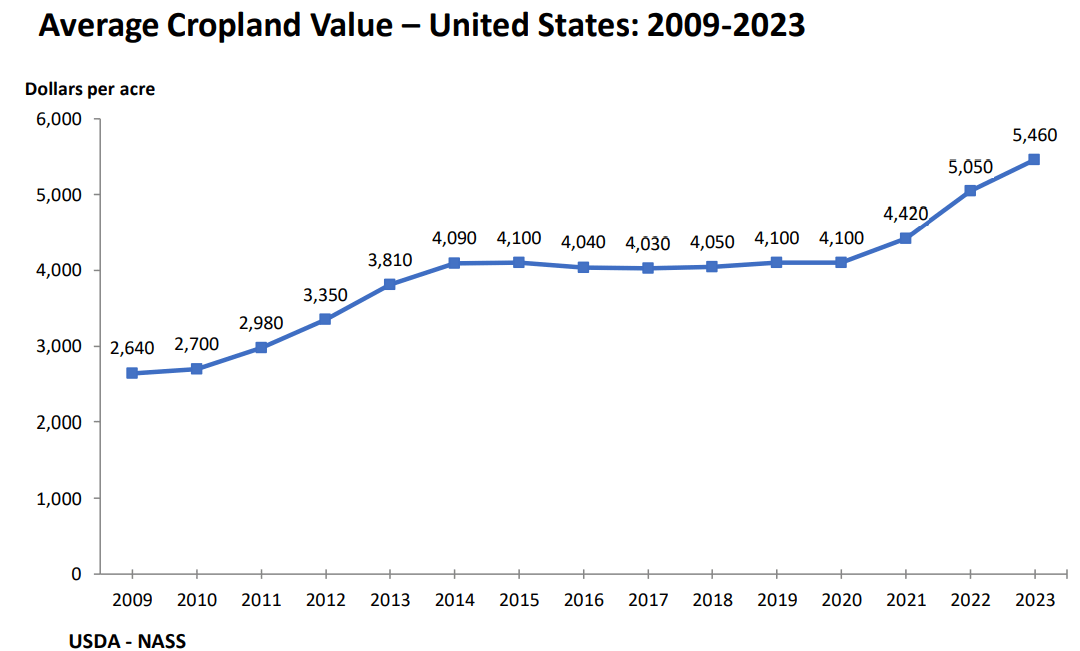
This isn’t a situation of taking management’s word for it that their properties have appreciated. It is the official USDA survey numbers. It is observable in thousands of farmland transactions that take place across the U.S.
Some of the assets were acquired much earlier than 2017, but I think that is roughly the weighted average entry point. Thus, the assets are on the books at the price of that period of time. Since then, farmland has appreciated by just over 35% (5460/4030).
With FPI trading at $11.23 today, it is trading at 60% of NAV. I find it quite clear why management is buying back shares as fast as they can.
There is nowhere else you can buy farmland at 60 cents on the dollar. Farmland transactions in the U.S. are highly efficient. Farmers know the value of the land and the assets are extremely liquid. Anything outside the range of 90%-110% of fair value is quite unusual.
Yet, the public stock market is affording us the ability to buy shares at 60% of NAV.
The earnings side of it
As discussed above, FFO does not capture asset appreciation. I would redefine earnings for FPI as AFFO plus asset appreciation, minus stock-based compensation.
So what did FPI earn in the last 12 months and what do earnings look like going forward?
As a baseline we have $0.24 per share of operating trailing 12-month FFO which should be adjusted for $0.036 per share of stock comp (2023 run rate annualized). This is roughly the cash earnings of the crops sold and the rent received minus the interest expense and overhead expenses.
Appreciation in the last 12 months was particularly high at a national average of 8.1%. One might at first think this increases the value of FPI shares by 8.1% but it is actually much more than that as there are two sources of amplification.
- Leverage- The raw asset value is appreciating while the magnitude of debt does not change.
- The 8.1% appreciation is on the asset value, not the stock value and asset value is much larger.
8.1% asset appreciation results in a gain of about $2.19 per share.
2MC
The number comes in a bit lower if we get more granular. FPI is concentrated in the regions below.
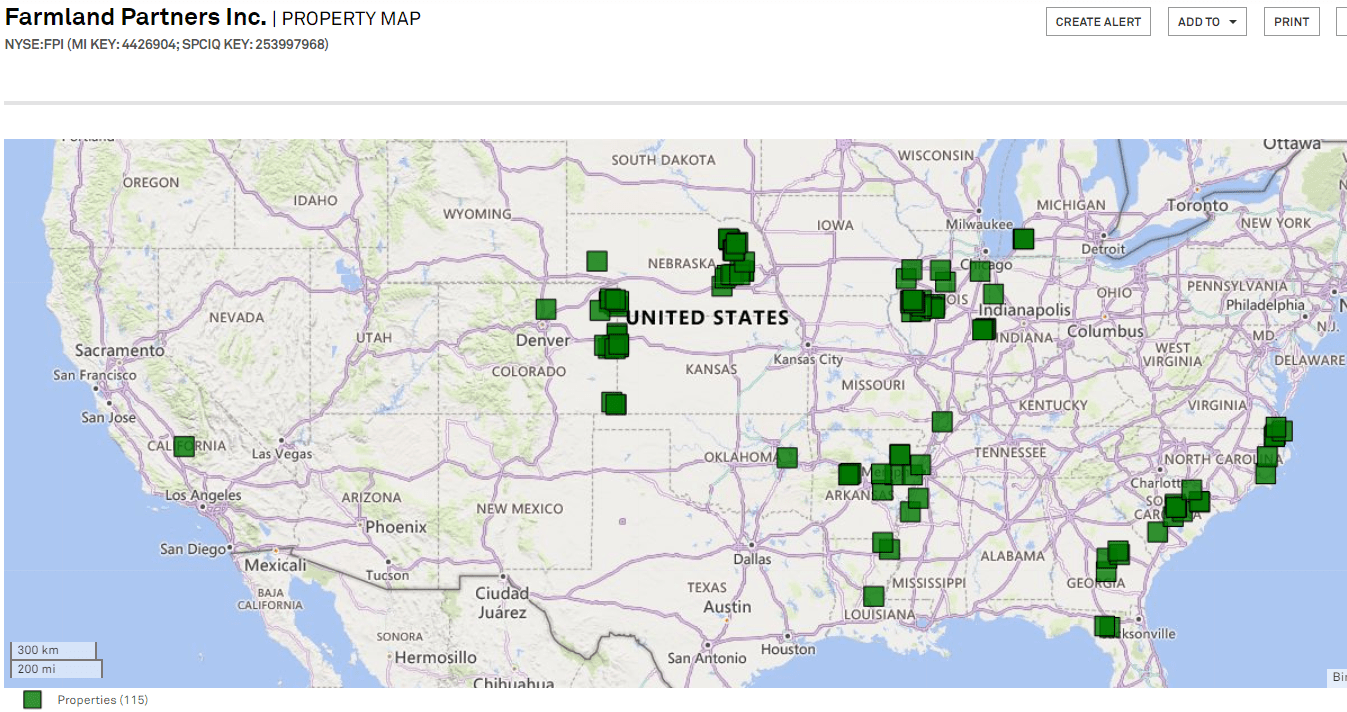
Illinois, the southeast and the delta region came in a little bit below national average on farmland appreciation in 2023.
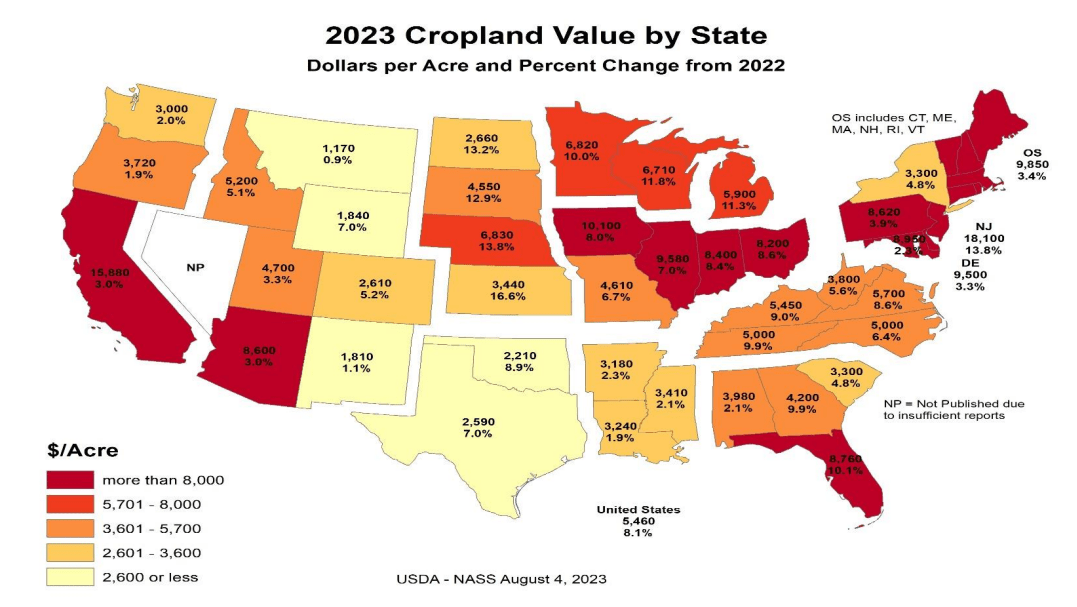
Pulling FPI up a bit is Kansas’ 16.6% appreciation, but I would still suspect just based on region that FPI came in south of that 8.1% national appreciation figure.
As a rough estimate, let’s go with 6%
2MC
That is still $1.62 appreciation per share. Adding in the FFO and subtracting the stock comp we get 12-month total earnings around $1.82.
Not bad for an $11.23 stock.
Forward earnings
I think the pace of appreciation will slow considerably in the next few years. The rapid pace of the last few years was aided by inflation and high farmer incomes.
It appears as though farmer incomes are about to turn down a bit. Commodity prices remain at a great level, particularly soybeans at $14.17 a bushel.
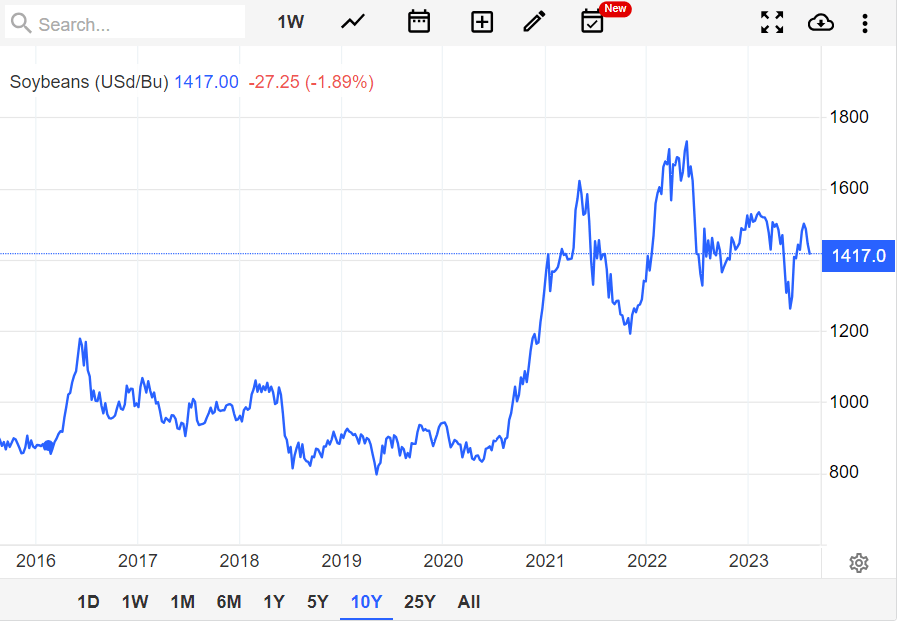
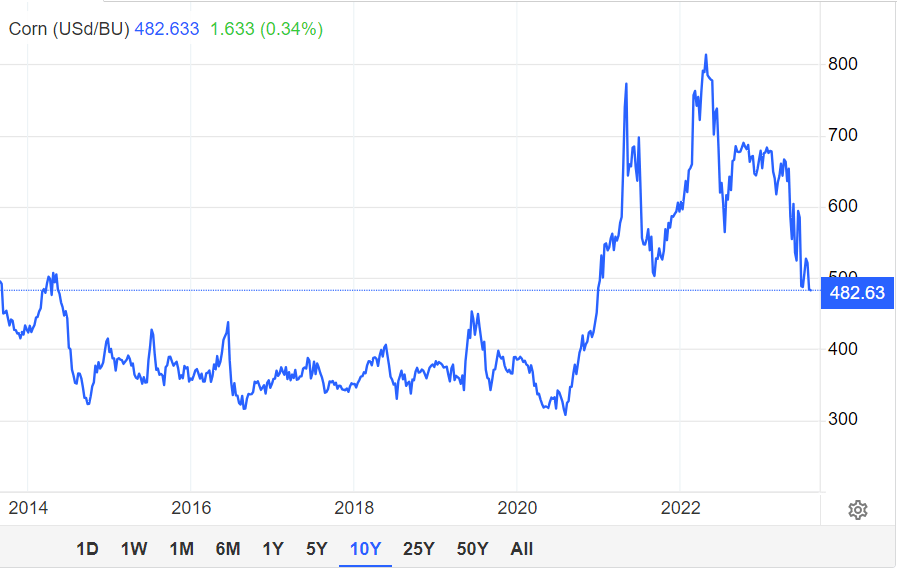
However, there is reason to believe prices will come back down a bit.
U.S. crop yields are expected to come in at record levels in 2023 this could create a surplus of inventory as described below by Food Business News:
“The carryover of US corn on Sept. 1, 2024, was projected at 2,222 million bus, up 57% from the 2023 forecast of 1,417 million bus. Soybean carryover on Sept. 1, 2024, was forecast at 335 million bus, up 56% from 215 million bus expected for this year. If realized, 2024 corn carryover would be the highest since 2017 and the ending stocks-to-use ratio the highest since 2019. Soybean carryover and stocks-to-use in 2024, if realized, would be the highest since 2020. Corn and soybean carryover projections for 2024 were well above trade expectations.”
Partially mitigating the strong yields is the continued turmoil of the Ukraine war which is disrupting production in what is historically one of the strongest grain regions of the world.
The 8.1% appreciation of 2023 was driven by inflation and farmer incomes both at above normal levels. Going forward, these forces should moderate and I would anticipate annual appreciation more in the 3%-4% range.
It is worth noting that for over a century, farmland has consistently appreciated at a pace that exceeded inflation. Thus, by historical standards my projection of 3%-4% forward annual appreciation is quite conservative. At this level, annual NAV gain per share would be $0.92-$1.23 on top of the cashflows produced by the farms.
2MC
Why appreciation is a bigger deal in farmland than other kinds of real estate
Most types of real estate appreciate, but the appreciation is rarely free.
- Hotels will renovate every 5-15 years and each time they do, the asset is worth more than before, but these renovations are really expensive and cause downtime.
- Apartments need to be meticulously maintained.
- Insurance costs are rising quickly
- Parts and labor associated with maintenance is getting more expensive
- Property taxes are increasing
Land is different. Land does not incur capex. Farmers use fertilizers and crop rotation to maximize fecundity, but this expense does not flow through to the REIT.
Land appreciates continuously and for free with no inputs. Land appreciation is a true profit.
The value of buying at a discount
There are many ways to buy farmland. You can directly purchase farms via auction. You can use investment vehicles to invest in individual farms. Each of these is probably an okay investment or at least has been historically.
However, if land is bought by the above means you are getting it at fair value via auction or about $1.10 on the dollar if through an investment vehicle.
Therefore, 4% appreciation would be a realized 4% to the investor.
Farmland Partners, however, provides amplification.
In buying FPI today at the extreme discount at which it is trading, one can get the approximately $1.492 billion of assets at a price of the $557.5 million market cap. Some of that is leverage, most of that is discount.
It gives an amplification of nearly 3X. When buying at this sort of a discount, 4% annual appreciation on the assets is greater than 10% annual appreciation as realized by the investor’s NAV. The discount converts a moderate return stable asset into a high total return stable asset.
For further details see:
Farmland Partners' ~$18.60 Value Is Obscured By Accounting Intricacies