VONG - FBCG: Is Strong Earnings Growth Enough To Sustain YTD Gains?
Summary
- FBCG is a semi-transparent actively managed large-cap growth ETF offered by Fidelity. Fees are 0.59% and the ETF has $447 million in assets under management.
- The strategy screens for the highest-growth blue-chip stocks and has a 3-5% growth edge over its benchmark, the Russell 1000 Growth Index. Valuations are not considered.
- FBCG does well when market sentiment is overly positive, like in 2020. The portfolio is up substantially in 2023, but those gains aren't supported by earnings results and earnings surprises.
- Expect a pullback as markets normalize. We're not yet in a stage where fundamentals can be ignored, so I don't recommend investors buy FBCG.
Investment Thesis
The Fidelity Blue Chip Growth ETF ( FBCG ) is a semi-transparent actively managed fund that consistently holds some of the market's highest-potential U.S. large-cap growth stocks. With a hefty 0.22% median bid-ask spread and a high 0.59% expense ratio, FBCG isn't a cheap ETF to trade or hold. However, it's ideal for ultra-bullish markets, as market participants tend to ignore valuations during these periods. The issue is that we are not in such an environment today. Q4 2022 earnings surprises continue to trend downward, and the significant gains FBCG and other growth ETFs made this year will likely reverse. Therefore, I recommend readers avoid this high-fee fund, and I look forward to explaining why in further detail below.
FBCG Overview
Strategy Discussion and Key Exposures
FBCG is semi-transparent, meaning detailed holdings posted on the fund page aren't updated, and Fidelity only discloses the tracking basket weight overlap, currently at 79.81%. This metric, calculated daily, is designed to inform investors how similar the tracking basket is to the fund's actual portfolio.
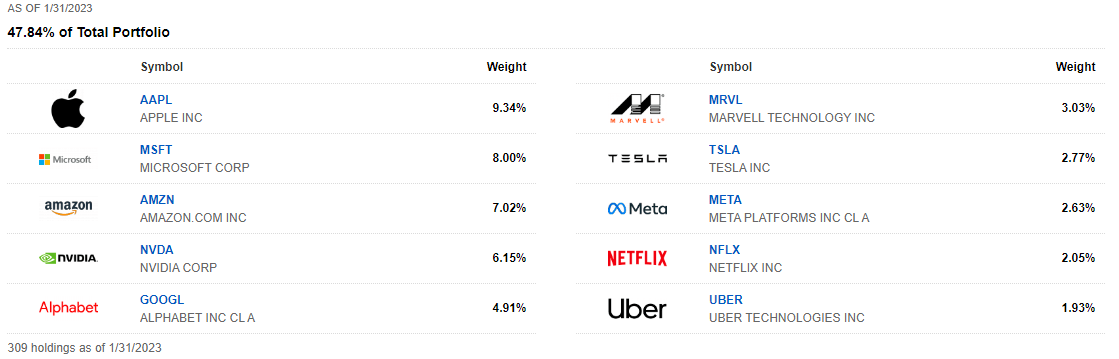
Actual holdings data is available as of December 31, 2022. However, the Fidelity Blue Chip Growth Fund ( FBGRX ) page includes holdings as of January 31, 2023. Given the similarities (name, manager, strategy, performance), FBGRX's holdings are more relevant, and I've listed the top ten below. Like the month prior, they include Apple ( AAPL ), Microsoft ( MSFT ), Amazon ( AMZN ), NVIDIA ( NVDA ), and Alphabet ( GOOGL ).
Fidelity
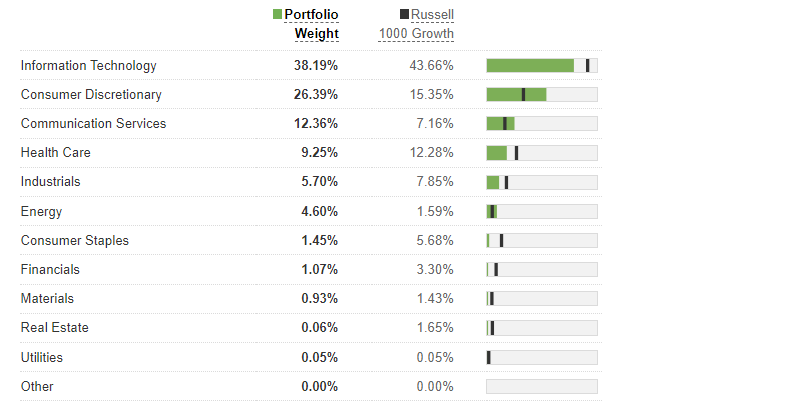
FBCG is a very tech-heavy fund. 38% is dedicated to the sector and 26% to Consumer Discretionary. Apart from 9% in Health Care, there's little defensiveness. As its name indicates, FBCG is all about large-cap growth and is best used to target this segment efficiently. As shown below, its benchmark is the Russell 1000 Growth Index. The Vanguard Russell 1000 Growth ETF ( VONG ) is the cheapest way to track the performance of this Index. There's also the iShares Russell 1000 Growth ETF ( IWF ), which has a slightly higher expense ratio (0.18% vs. 0.08%).
Fidelity
Performance Analysis
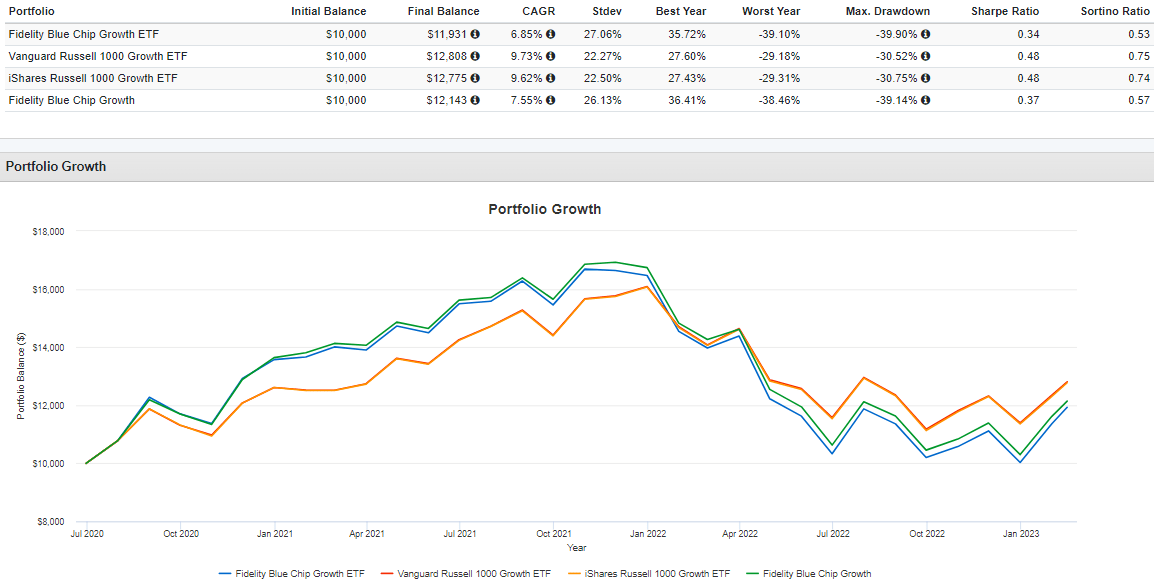
The following graph compares the performance of FBCG, FBGRX, VONV, and IWF since June 2020. FBCG was the worst performer, gaining an annualized 6.85% vs. 9.73% and 9.62% for VONV and IWF. It also underperformed FBGRX by 0.70% per year. Although not perfect, there's a clear correlation between the two. FBCG and FBGRX initially outperformed their benchmarks as market sentiment was overly optimistic in 2020-2021. The gains reversed in 2022 as market sentiment turned negative, and market participants valued fundamentals. In 2023, FBCG outperformed VONG by 6.5% as markets significantly rose. That's the pattern you can expect. FBCG's success depends on market sentiment, and that's the focus of my analysis.
Portfolio Visualizer
FBCG Analysis
Snapshot By Company
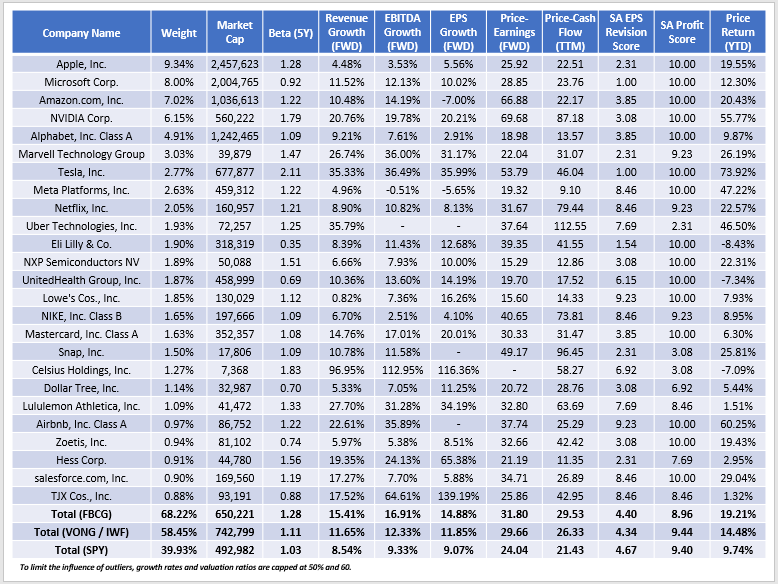
I've compiled the following fundamental metrics for FBGRX's top 25 constituents. Again, these aren't perfect since I can't access current holdings data. However, based on my tracking of the fund over the last year, this is a reasonable representation of FBCG.
The Sunday Investor
1. FBCG's slightly more concentrated than the Russell 1000 Growth ETFs, with 68.22% of assets in its top 25 holdings. These holdings are generally more volatile, as indicated by the portfolio's 1.28 weighted-average five-year beta. In bullish markets, this feature is favorable. This group, as currently weighted, has gained 19.21% YTD compared to 14.48% for VONG and IWF.
2. FBCG's estimated sales, EBITDA, and EPS growth rates are 3-5% higher, though it trades at an expensive 31.80x forward earnings and 29.53x trailing cash flow. Still, these valuations might be acceptable, given how difficult it is to find stocks with 20-30%+ earnings growth rates. The Russell 1000 Growth ETFs are 11.85%, and the SPDR S&P 500 ETF ( SPY ) is at just 9.07%.
3. Earnings momentum, measured by the SA EPS Revision Scores, is poor. This score, derived from individual Seeking Alpha Factor Grades, suggests analysts are downgrading earnings expectations faster than the broader market. It does not inspire confidence, leading me to believe that the year-to-date gains for growth stocks are unsustainable.
Earnings Season Update
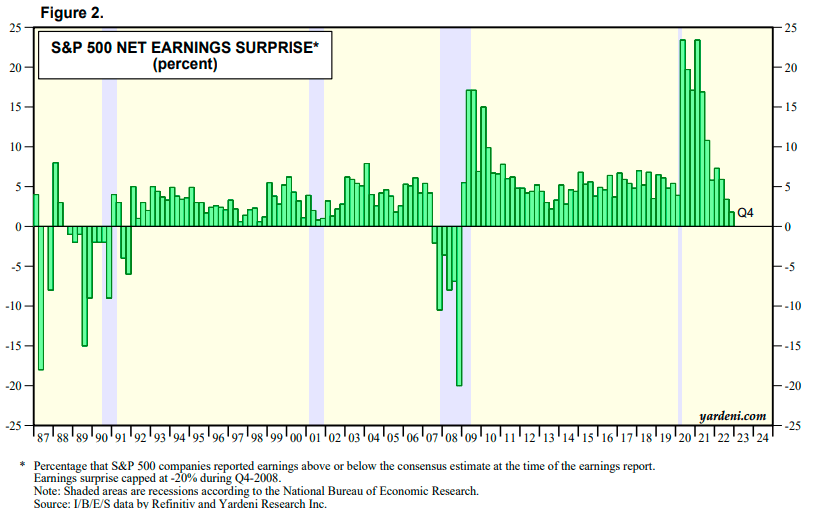
In 2020, a bullish market sentiment made sense because aggregate S&P 500 quarterly earnings surprises were enormous. According to Yardeni Research, they peaked at 23.4% in Q2 2020 and Q4 2020 before sliding down to 5.8% one year later in Q4 2021. With 70% of companies reporting for Q4 2022, the aggregate surprise is just 1.8%, the lowest since 2008. Perhaps confidence in the Fed achieving a rare "soft landing" has improved. However, Yardeni Research also reports how actual year-over-year earnings growth this quarter was -1.0%. Technology, FBCG's largest exposure area, is down 10.9%.
Yardeni Research
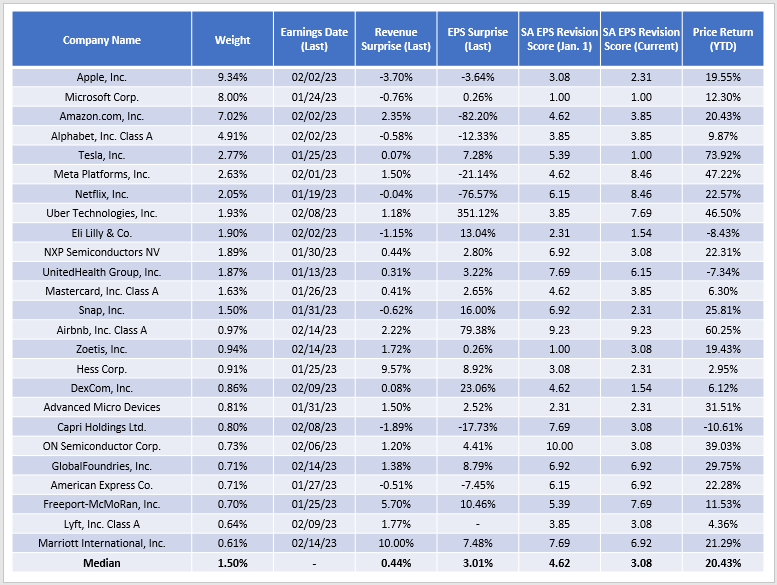
Also, consider the last quarter's results of 25 of FBCG's top holdings. These companies reported sales aligned with analyst expectations and about a 3% earnings surprise. Furthermore, the median EPS Revision Grade declined from 5.62/10 to 3.08/10, yet the median price increase this year was 20.43%.
The Sunday Investor
In some cases, the gains make sense. For example, take Uber Technologies ( UBER ). According to Chief Executive Officer Dara Khosrowshahi, the company had its " strongest quarter ever " amid bookings growth due to the lifting of COVID-19 restrictions. Analysts praised the " year of efficiency " goals Mark Zuckerberg set for Meta Platforms ( META ) earlier this month. As shown above, Meta's EPS Revision Score increased from 4.62/10 to 8.42/10 since January 1, 2023. These are tangible reasons for stock price increases. However, they are the exception, not the rule. Most companies, including the top ones like Apple and Microsoft , continue to disappoint.
Investment Recommendation
Expect growth stocks to give back some of their enormous year-to-date gains shortly because they aren't supported by solid earnings growth or surprises. FBCG is at an elevated risk level now because it's among the most richly valued growth ETFs, currently trading at 31.80x forward earnings. Furthermore, it's only semi-transparent, making it challenging to know what's in the portfolio at any given time. Also, its 0.59% expense ratio will likely be a primary source of underperformance over the long run. Therefore, I recommend investors avoid FBCG, especially in the short term, and I look forward to answering any questions in the comments section below.
For further details see:
FBCG: Is Strong Earnings Growth Enough To Sustain YTD Gains?