VTV - FBCV: A Value ETF Lacking Of Transparency
2023-05-25 15:33:33 ET
Summary
- Fidelity Blue Chip Value ETF is an actively managed value ETF.
- It lacks the transparency of usual ETFs regarding rules and holdings.
- It has beaten its benchmark since inception, but it is on par with several competitors.
This article series aims at evaluating exchange-traded funds (ETFs) regarding the relative past performance of their strategies and metrics of their current portfolios. As holdings change over time, updated reviews are posted from time to time.
FBCV strategy and portfolio
Fidelity Blue Chip Value ETF (FBCV) is an actively managed ETF launched on 06/02/2020. It has a 12-month distribution yield of 1.39%, a total expense ratio of 0.59% and net assets of $135M. Distributions are paid quarterly. As described in the prospectus by Fidelity, the fund is different from traditional ETFs:
It is not required to publicly disclose its complete portfolio holdings each business day. Instead, the fund publishes each business day on its website a "Tracking Basket," which is designed to closely track the daily performance of the fund but is not the fund's actual portfolio.
FBCV invests in companies that are undervalued " in relation to factors such as assets, sales, earnings, growth potential, or cash flow, or in relation to securities of other companies in the same industr y. "
The current tracking basket, which is visible on this link , has a weight overlap of 80% with the real portfolio. The portfolio turnover rate was 54% during the most recent fiscal year.
FBCV benchmark is the Russell 1000 Value Index. In this article, it will be compared to the iShares Russell 1000 Value ETF (IWD), and also to the SPDR S&P 500 ETF Trust ( SPY ). The usual valuation ratios are reported in the next table.
| FBCV |
| IWD |
| SPY |
| Price / Earnings TTM |
| 15.26 |
| 15.93 |
| 21.21 |
| Price / Book |
| 2.1 |
| 2.22 |
| 3.77 |
| Price / Sales |
| 1.43 |
| 1.66 |
| 2.4 |
| Price / Cash Flow |
| 10.25 |
| 11.41 |
| 15.29 |
Source: Fidelity
FBCV is significantly cheaper than SPY regarding the four ratios, and marginally cheaper than IWD.
Performance
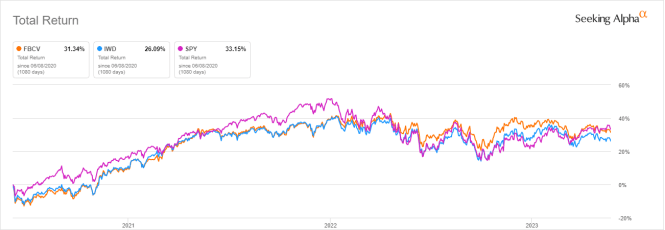
Since inception in June 2020, FBCV has outperformed IWD by 5.2% in total return, and it is shortly behind SPY.
FBCV vs. benchmarks since June 2020 (Seeking Alpha)
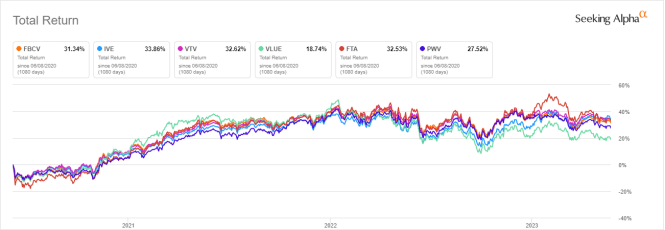
The next chart compares FBCV with five other large- and mid-cap value ETFs tracking different indexes:
- iShares S&P 500 Value ETF ( IVE )
- Vanguard Value Index Fund ( VTV )
- iShares MSCI USA Value Factor ETF ( VLUE )
- First Trust Large Cap Value AlphaDEX Fund ( FTA )
- Invesco Dynamic Large Cap Value ETF ( PWV )
FBCV vs. competitors since June 2020 (Seeking Alpha)
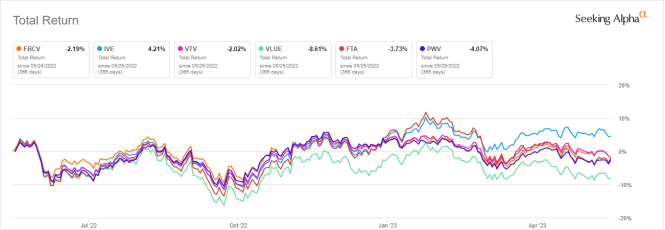
FBCV beats VLUE and, to a lesser extent, PWV. It is very close to IVE, VTV and FTA. However, IVE has been outperforming in the last 12 months:
FBCV vs. competitors, last 12 months (Seeking Alpha)
Shortcomings of value funds
Value funds usually rank all stocks on the same criteria. It means the valuation ratios are considered comparable across sectors and industries. Obviously, they are not: my monthly dashboard here shows how valuation and quality metrics may vary across sectors. A consequence is to privilege sectors where valuation ratios are naturally cheaper, especially financials. FBCV prospectus doesn't tell much about the strategy, but it discloses that companies are compared to their peers in the same industry. The bias across all sectors and industries is likely reduced.
The second weakness of value funds comes from the price/book ratio (P/B), which adds some risk in the strategy. Historical data show that a large group of companies with low P/B has a higher probability to hold value traps than a same-size group with low price/earnings, price/sales or price/free cash flow. Statistically, such a group will also have a higher volatility and deeper drawdowns in price. The next table shows the return and risk metrics of the cheapest quarter of the S&P 500 (i.e. 125 stocks) measured in price/book, price/earnings, price/sales and price/free cash flow. The sets are reconstituted annually between 1/1/2000 and 1/1/2023 with elements in equal weight.
| Annual Return |
| Drawdown |
| Sharpe ratio |
| Volatility |
| Cheapest quarter in P/B |
| 8.54% |
| -81.55% |
| 0.35 |
| 37.06% |
| Cheapest quarter in P/E |
| 10.71% |
| -73.62% |
| 0.48 |
| 25.01% |
| Cheapest quarter in P/S |
| 12.82% |
| -76.16% |
| 0.47 |
| 34.83% |
| Cheapest quarter in P/FCF |
| 15.32% |
| -74.77% |
| 0.61 |
| 27.03% |
Data calculated with Portfolio123
This explains why I use P/FCF and not P/B in the Dashboard List model.
FBCV is likely to use similar ratios, including one closely related to P/B. However, it also uses a "growth potential" criterion. It may be the PEG ratio or another metric using EPS growth or sales growth estimates. Anyway, it makes FBCV better than the usual value index ETFs by lowering the risk of picking value traps.
Takeaway
Fidelity Blue Chip Value ETF is an actively managed ETF holding large- and mid-cap stocks with value characteristics. It lacks the transparency of usual ETFs: the strategy and holdings are not disclosed by Fidelity. Moreover, its total assets and average trading volume are quite low. Price history is short: it has beaten its benchmark (represented by IWD), but performance is similar to several competitors. Unlike most value ETFs, it takes into account industry and growth in the stock-picking process.
For further details see:
FBCV: A Value ETF Lacking Of Transparency