XOP - FCG: Highest E&P Exposure
Summary
- The FCG ETF provides exposure to companies that derive a substantial portion of revenues from production of natural gas.
- FCG has 85% weight to Exploration and Production companies, vs. 30% and 70% for XLE and XOP ETF respectively.
- Due to its higher E&P weight, FCG has significantly outperformed peer ETFs since the COVID-19 lows.
Readers may recall that I am very bullish on liquified natural gas, especially as we look towards the upcoming winter season and weigh the recent shenanigans from the Russians. While researching North American natural gas producers, I came across the First Trust Natural Gas ETF ( FCG ).
While the FCG does not give as high a weighting to pure-play natural gas producers as I would have liked, it does have the highest E&P producer weighting out of the peer funds that I have looked at. For investors looking for an ETF that has the most E&P producer exposure, the FCG ETF may be worth a consideration.
Fund Overview
The First Trust Natural Gas ETF aims to provide exposure to companies that derive a substantial portfolio of their revenues from the exploration and production of natural gas. FCG has $760 million in assets.
Strategy
The FCG ETF aims to provide exposure to natural gas producing companies through the ISE-Revere Natural Gas Index ("Index").
The index is designed to track the performance of mid and large cap companies that derive a substantial portion of their revenues from midstream activities and/or the exploration and production of natural gas.
For exploration and production companies to be eligible for inclusion in the Index, their natural gas reserves must be 30% or greater of its total proved reserves. In addition, the stock must have at least $250 million in market cap, 3 month average daily volume greater than $1 million, and at least 20% free float. The securities are then separated into MLP and non-MLPs buckets, with all non-MLPs included for consideration in the index and the ten largest MLPs included.
15% of the Index is allocated to MLPs and 85% to non-MLPs. The maximum weight of each security is 4.5%, and excess weight is redistributed to remaining constituents. The Index is reconstituted and rebalanced quarterly.
Portfolio Holdings
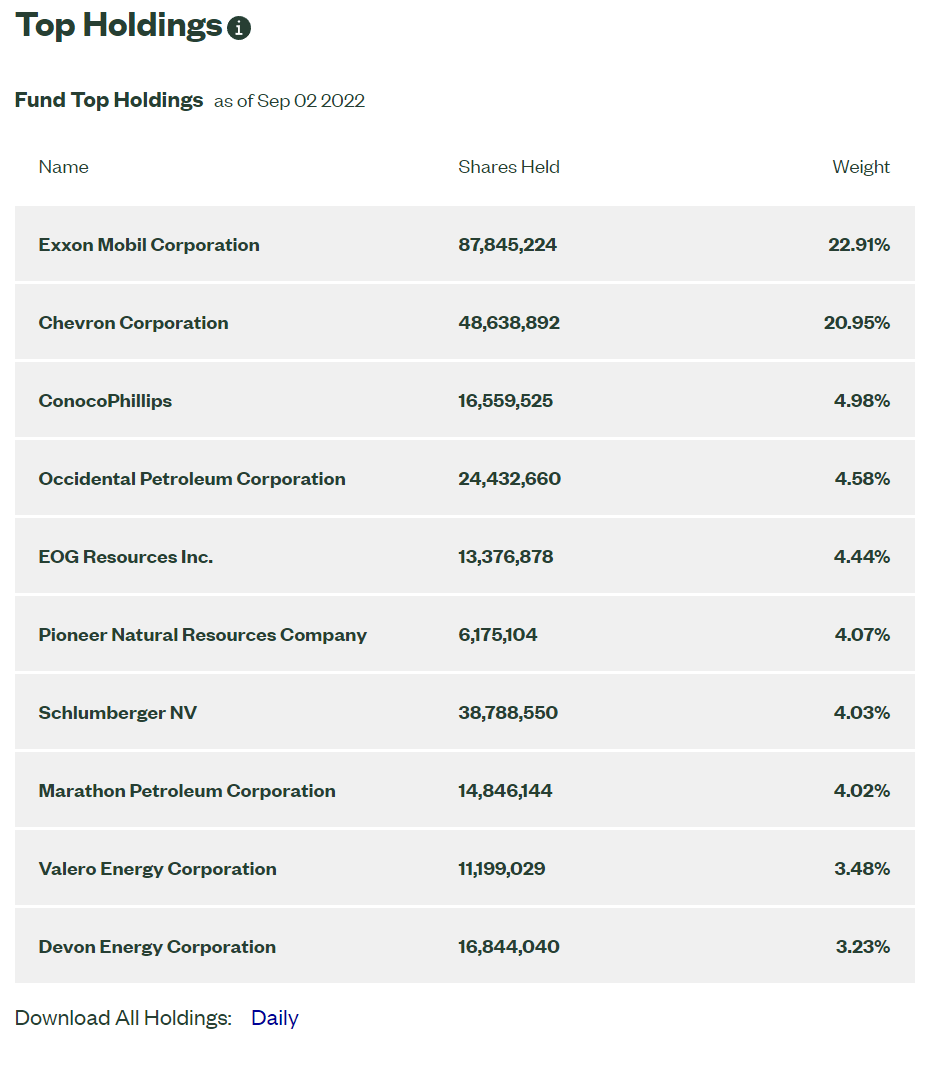
As of September 2nd, the fund held 49 positions, with the top 10 holdings combining for 38% of the fund (Figure 1). As per the index construction methodology, approximately 15% of the fund is invested in midstream companies and 85% is invested in E&P producers.
Figure 1 - FCG top 10 holdings (ftportfolios.com)
Interestingly, FCG's largest E&P weight is ConocoPhillips ( COP ), an E&P producer which is predominantly oil weighted (Figure 2).
Figure 2 - COP 2021 production summary (COP investor presentation)
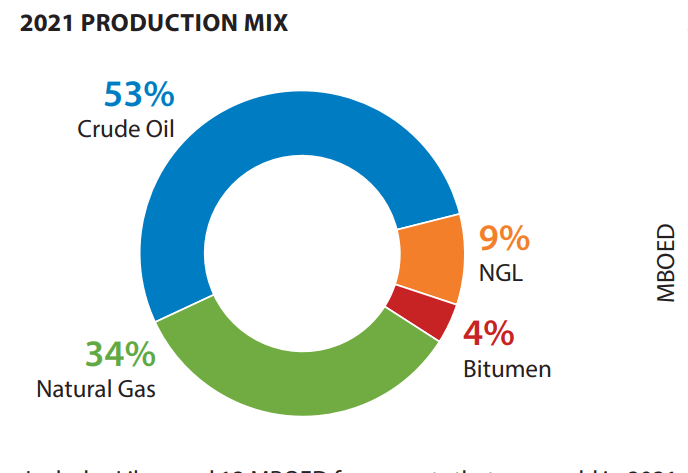
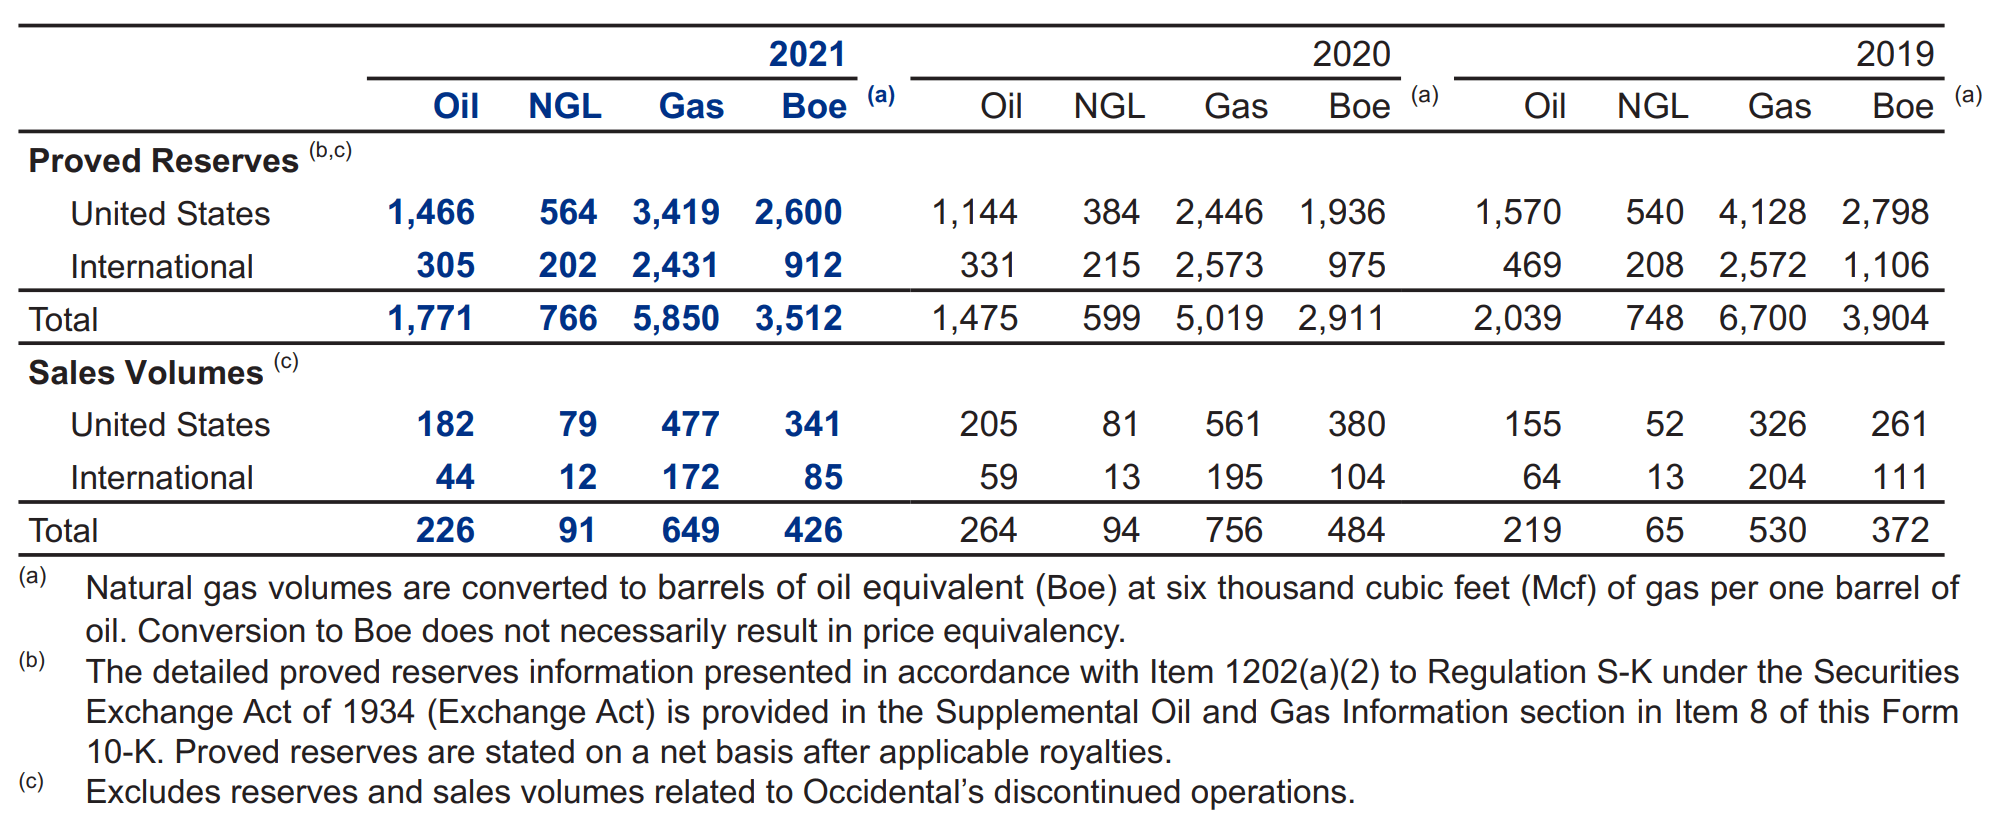
Similarly, Occidental ( OXY ) is a predominantly oil weighted producer, with natural gas comprising only 26% of 2021 production (Figure 3).
Figure 3 - OXY 2021 production summary (OXY 2021 10K report)
Pure-play natural gas producers like EQT Corporation ( EQT ) and Antero Resources ( AR ) are actually not in the top 10 holdings, but as a group, comprise ~20% of assets.
Returns
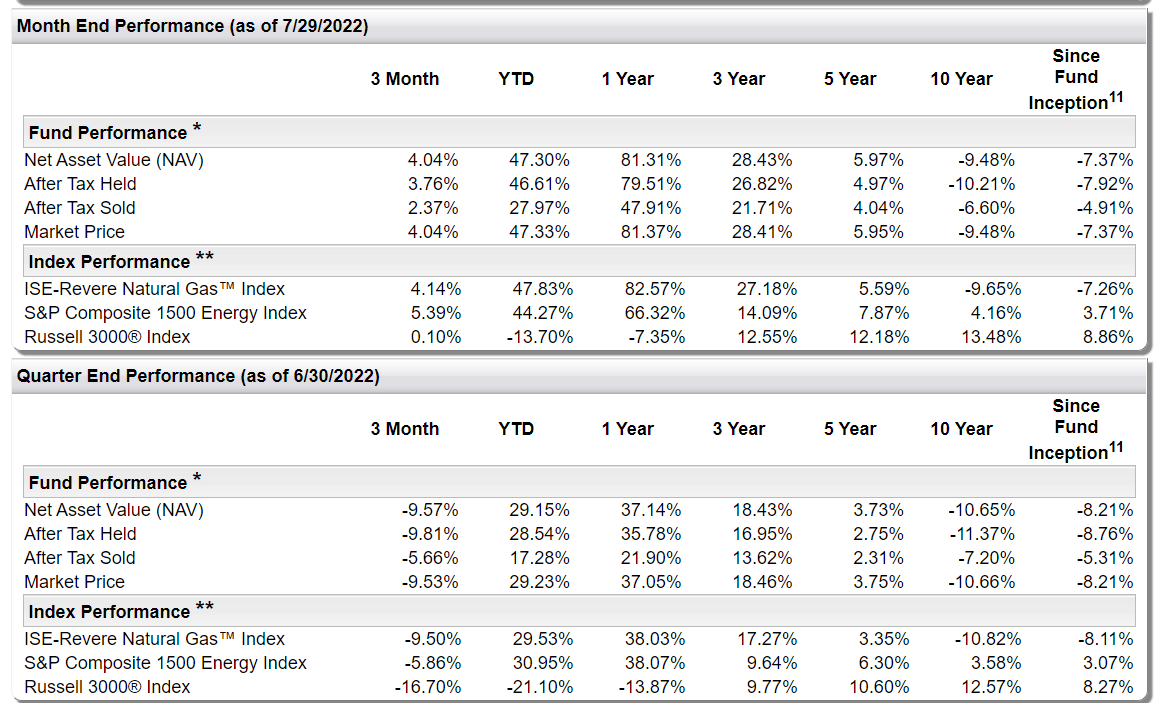
FCG has had stellar short-term performance, delivering YTD returns of 47% on NAV, and 81.3% 1 Year and 28.4% annualized 3 Year returns (Figure 4). On a longer-term basis, performance has been very poor, with 10-Year annual returns of -9.5%.
Distribution & Yield
FCG pays a moderate distribution yield of 1.95%, as of the end of July. The fund has a 30-Day SEC yield of 2.18%. FCG's distribution is variable and paid quarterly. It's latest distribution is $0.1461 per share, paid on June 30th.
Figure 5 - FCG distribution (ftportfolios.com)
Fees
FCG charges a net expense ratio of 0.60%, which is considerably more than other energy sector ETFs such as the Energy Select Sector SPDR Fund ( XLE ) at 0.10%, and the SPDR S&P Oil & Gas Exploration & Production ETF ( XOP ) at 0.35%.
Comparison vs. XLE and XOP
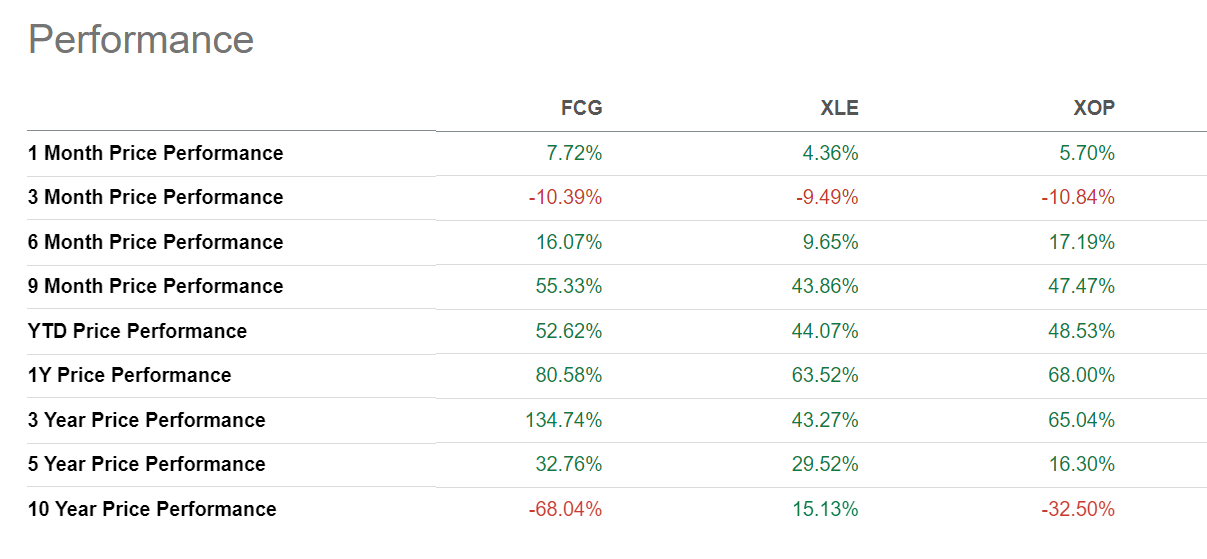
Comparing between FCG, XLE, and XOP, we can see that on a 1/3/5 Year basis, FCG has significantly outperformed its peer funds.
Figure 6 - Price return comparison between FCG, XLE, and XOP (Seeking Alpha)
The XLE ETF is modeled after the Energy GICS sector, and is dominated by the two megacap companies Exxon ( XOM ) and Chevron ( CVX ) which combine for 44% of the fund. It also has sizeable weights in refiners like Valero ( VLO ) and services like Schlumberger ( SLB ).
The XOP ETF, while it tracks essentially the same companies as the XLE ETF, employs a modified equal weighting scheme, which removes the concentration in the megacap companies like XOM and CVX. However, it too has sizeable exposure to refiners, with a 21% weight, and integrated at 7% weight.
Hence looking at E&P producer exposure, we find that FCG has much higher E&P producer exposure than the two peer ETFs, at 85% for FCG vs. 30% for XLE, and 70% for XOP. As E&P producers have been one of the best performing sub-sectors since the COVID-19 pandemic, it is not surprising that FCG has significantly outperformed.
Conversely, we can also see why FCG underperformed in the longer-term, as energy was in a significant bear market, culminating with near-term oil futures dipping into negative territory in early 2020.
Conclusion
For investors looking for an ETF that has the most E&P producer exposure, the First Trust Natural Gas ETF might be worth a consideration. It has higher E&P producer exposure than the more well known XLE and XOP ETFs. Since the COVID-19 lows, FCG has significantly outperformed both peer funds.
For further details see:
FCG: Highest E&P Exposure