FCO - FCO: Clearly Unsustainable Yield
Summary
- FCO invests in global fixed-income securities to generate a high yield.
- The fund pays an attractive 14.7% forward distribution yield.
- But with -0.9% 10Yr average annual returns, the fund's distribution is clearly unsustainable.
The abrdn Global Income Fund, Inc. (FCO) invests in global fixed income securities to pay high yield to investors.
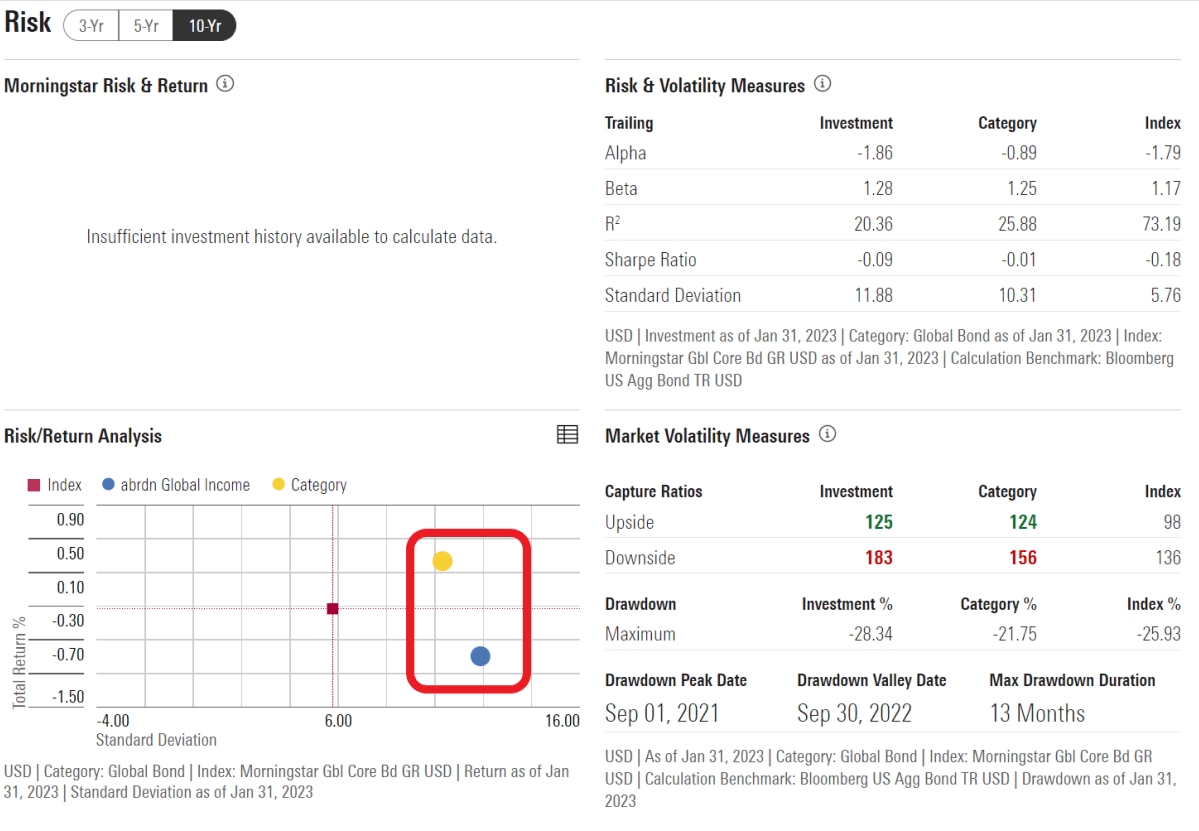
I am usually polite in my fund reviews, but the FCO appears to be one of the worst managed funds I have ever seen. Over 10 years, the fund has an average annual total return of -0.9%, underperforming its peer group in both returns and volatility. The fund pays a ridiculous 19.5% of NAV distribution that was 88% funded from return of capital in 2022. It charges an expensive 2.89% net expense ratio and trades at a 33% premium to NAV. Investors should avoid this fund at all costs.
Fund Overview
The abrdn Global Income Fund, Inc. is a closed-end fund ("CEF") that aims to provide high current income from a portfolio of global fixed income securities.
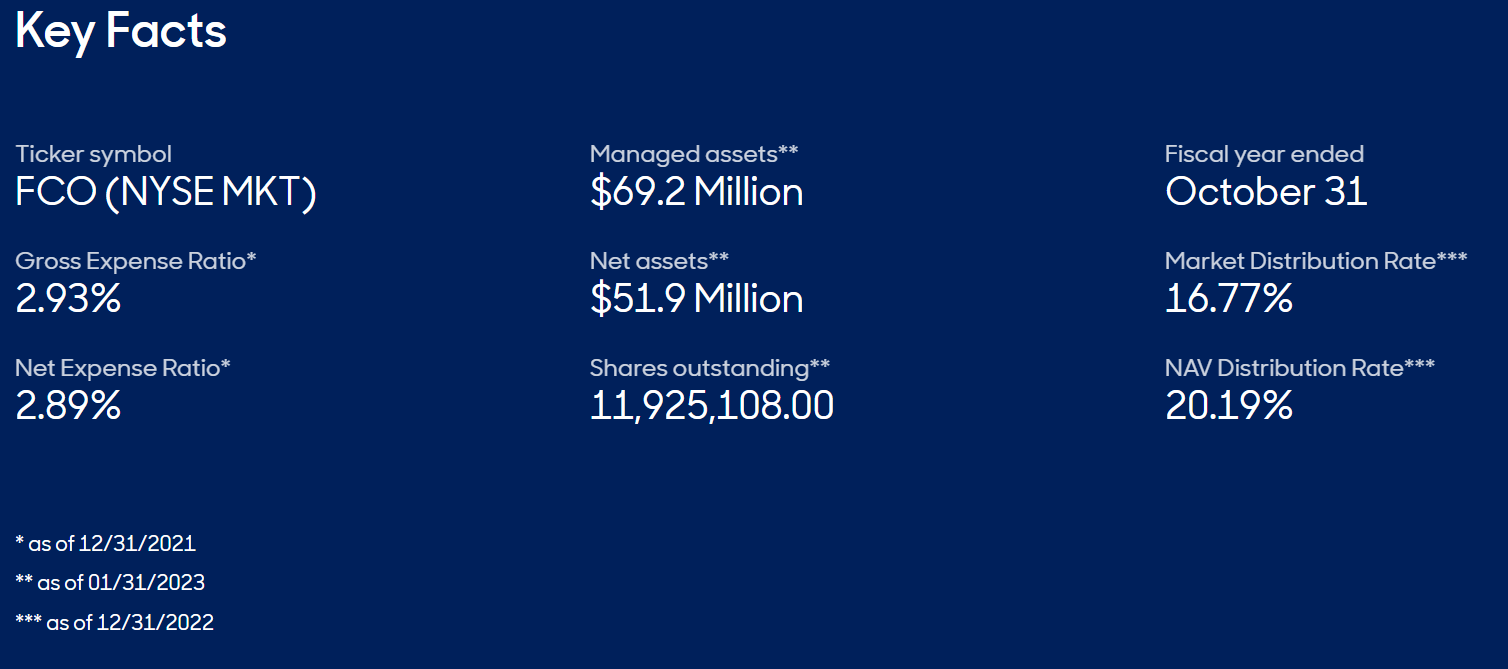
FCO is a relatively small fund with only $69 million in managed assets and $52 million in net assets for 25% effective leverage. The fund charges a high 2.89% net expense ratio (Figure 1).
Portfolio Holdings
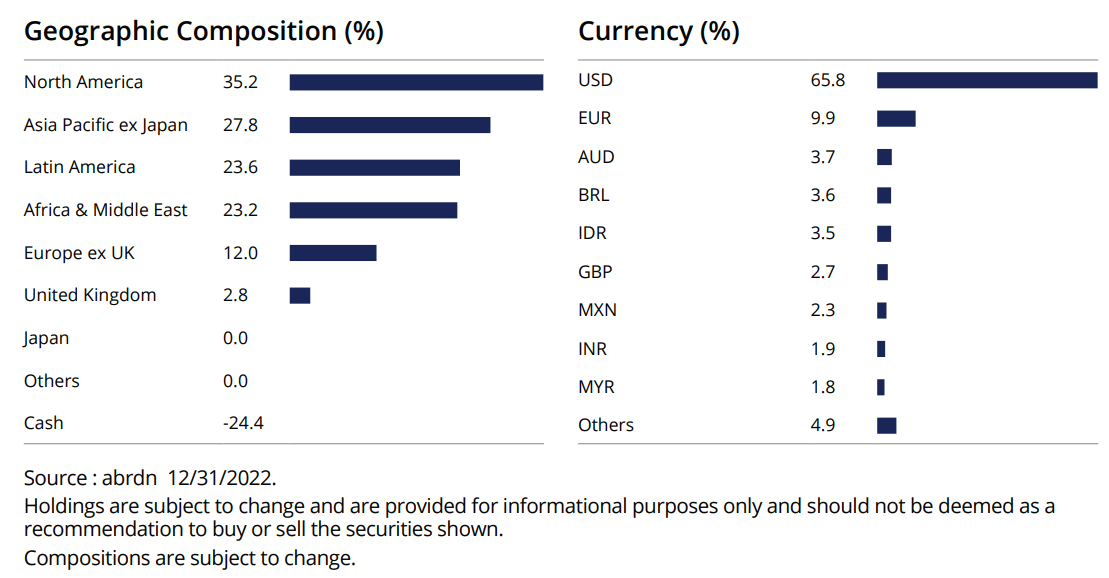
Figure 2 shows FCO's geographical allocation and currency exposure as of December 2022. 35% of the fund is invested in North American issuers and 28% is invested in Asia Pacific ex. Japan. Latin America is the 3rd biggest geography at 24%. 66% of the fund is invested in U.S. dollar denominated securities, 10% in Euros, and 4% in Australian Dollars.
Figure 2 - FCO geographical and currency allocation (FCO factsheet)
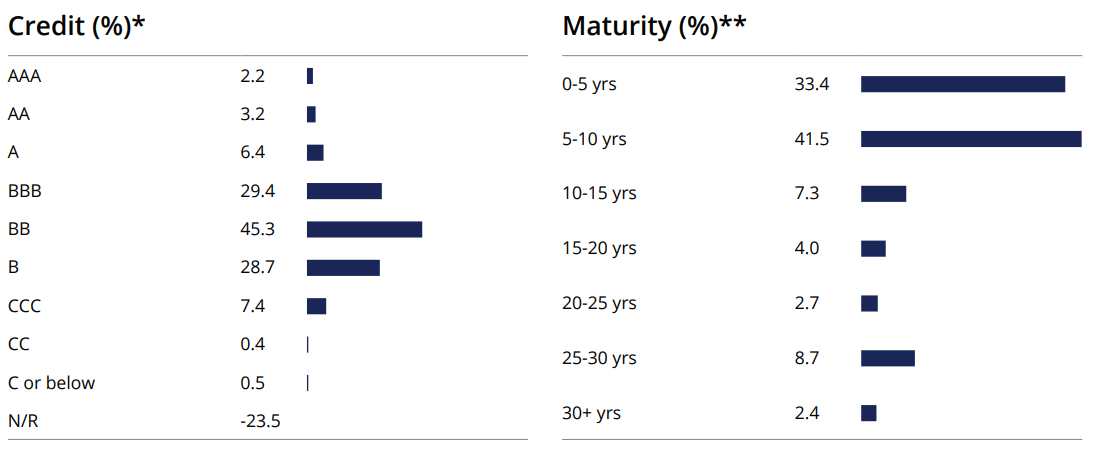
Figure 3 shows FCO's credit quality allocation and maturity allocation. The fund is predominantly invested in non-investment grade securities (rated BB or lower), with BB-rated accounting for 45% of assets, B-rated accounting for 29% of assets, and CCC-rated accounting for 7%. Investment grade securities account for 41.2% of the fund. The vast majority of the fund's assets have a maturity of 5 years or less (33%) or 5 to 10 years (42%). This gives the FCO portfolio a modified duration of 6.2 years.
Figure 3 - FCO credit quality and maturity allocation (FCO factsheet)
Returns
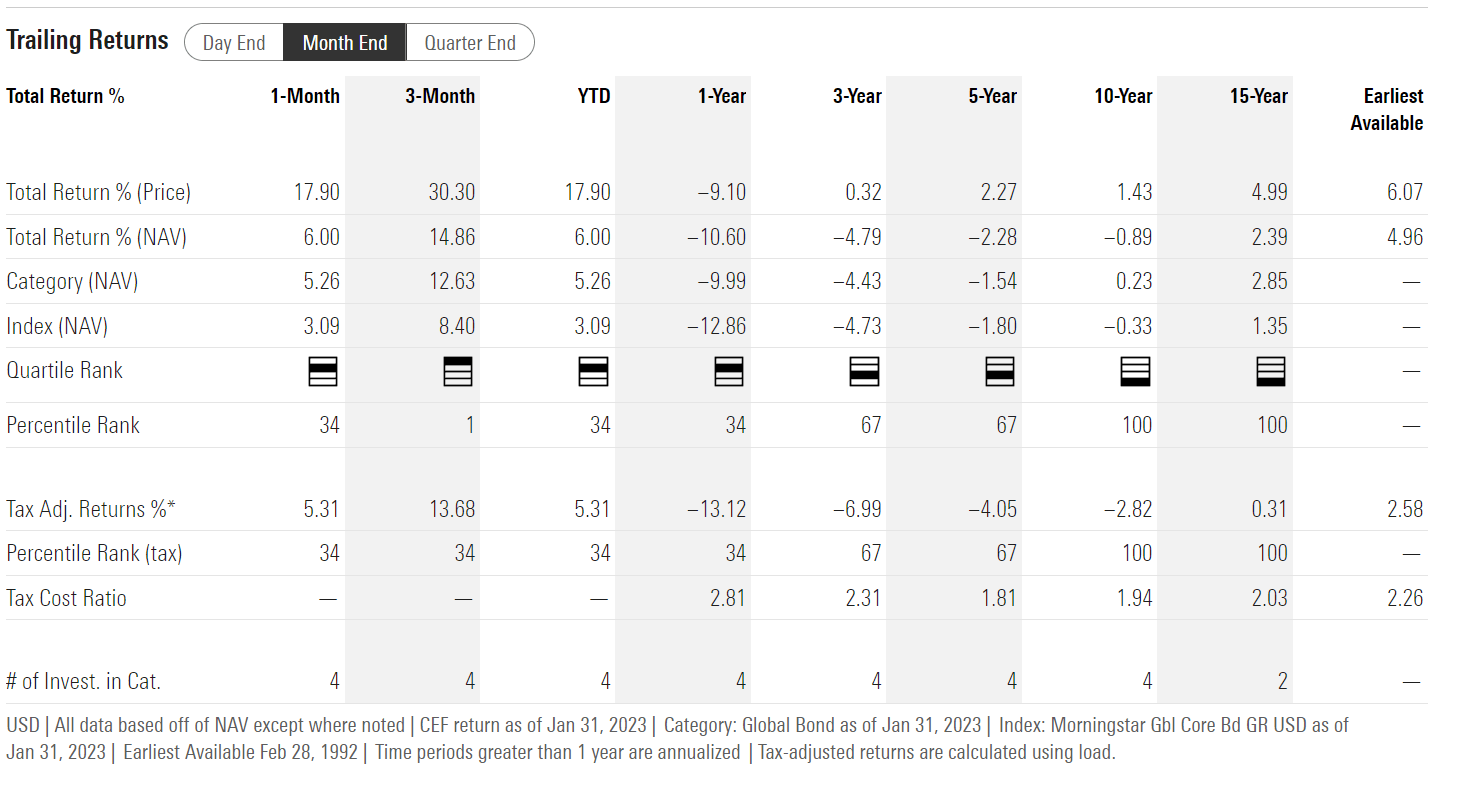
The FCO fund has generated extremely poor returns over both the short and long term, as shown in Figure 4. The fund has negative average annual returns out to the 10 Yr time horizon. Essentially, investors would have been better off parking their money under a mattress for 10 years.
Figure 5 shows that FCO's poor returns performance is partly due to a tough asset class, and partly due to mismanagement. The Global Bond category in Morningstar only has a 0.2% average annual return on a 10Yr horizon. However, FCO has exhibited far lower returns and higher volatility than its peer group.
Distribution & Yield
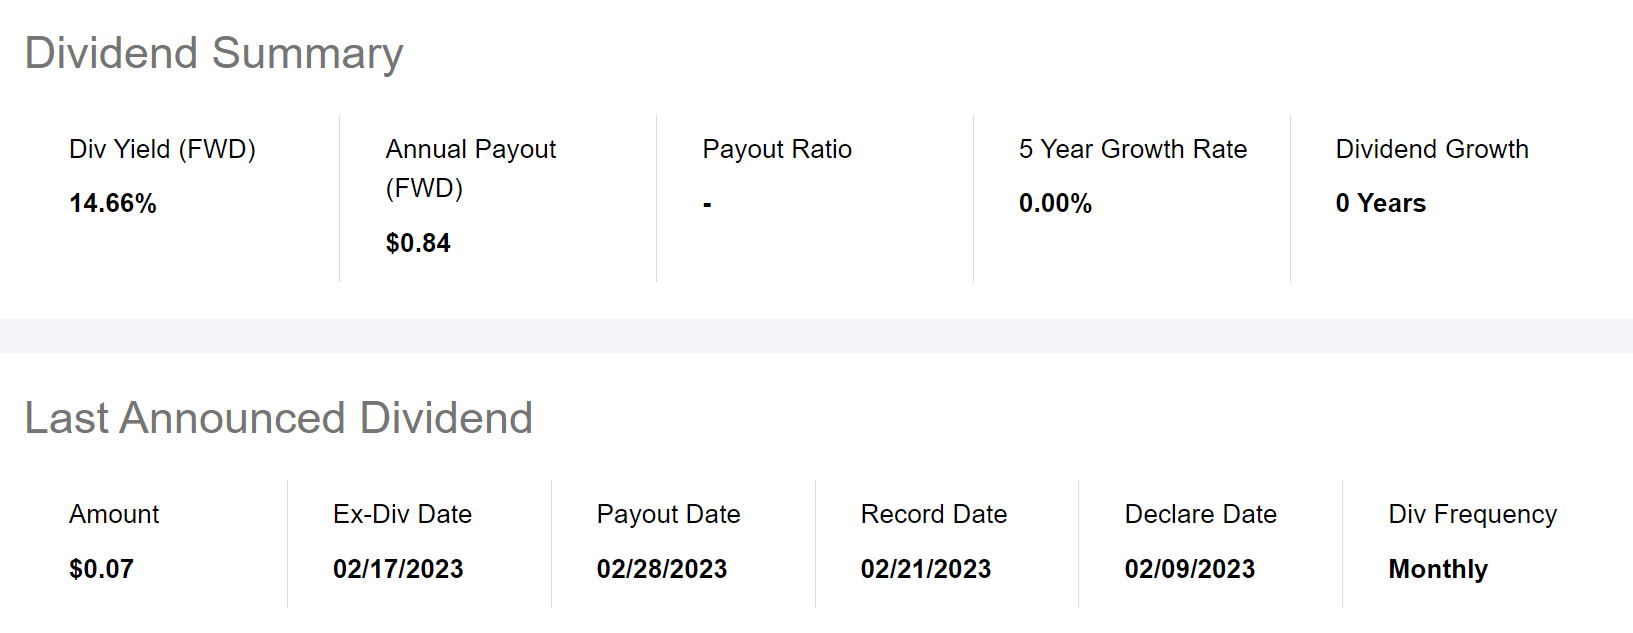
The FCO fund pays a monthly distribution of $0.07 which annualizes to a 14.7% forward yield. On the fund's latest NAV of $4.31, the forward yield is an eye-watering 19.5% (Figure 6).
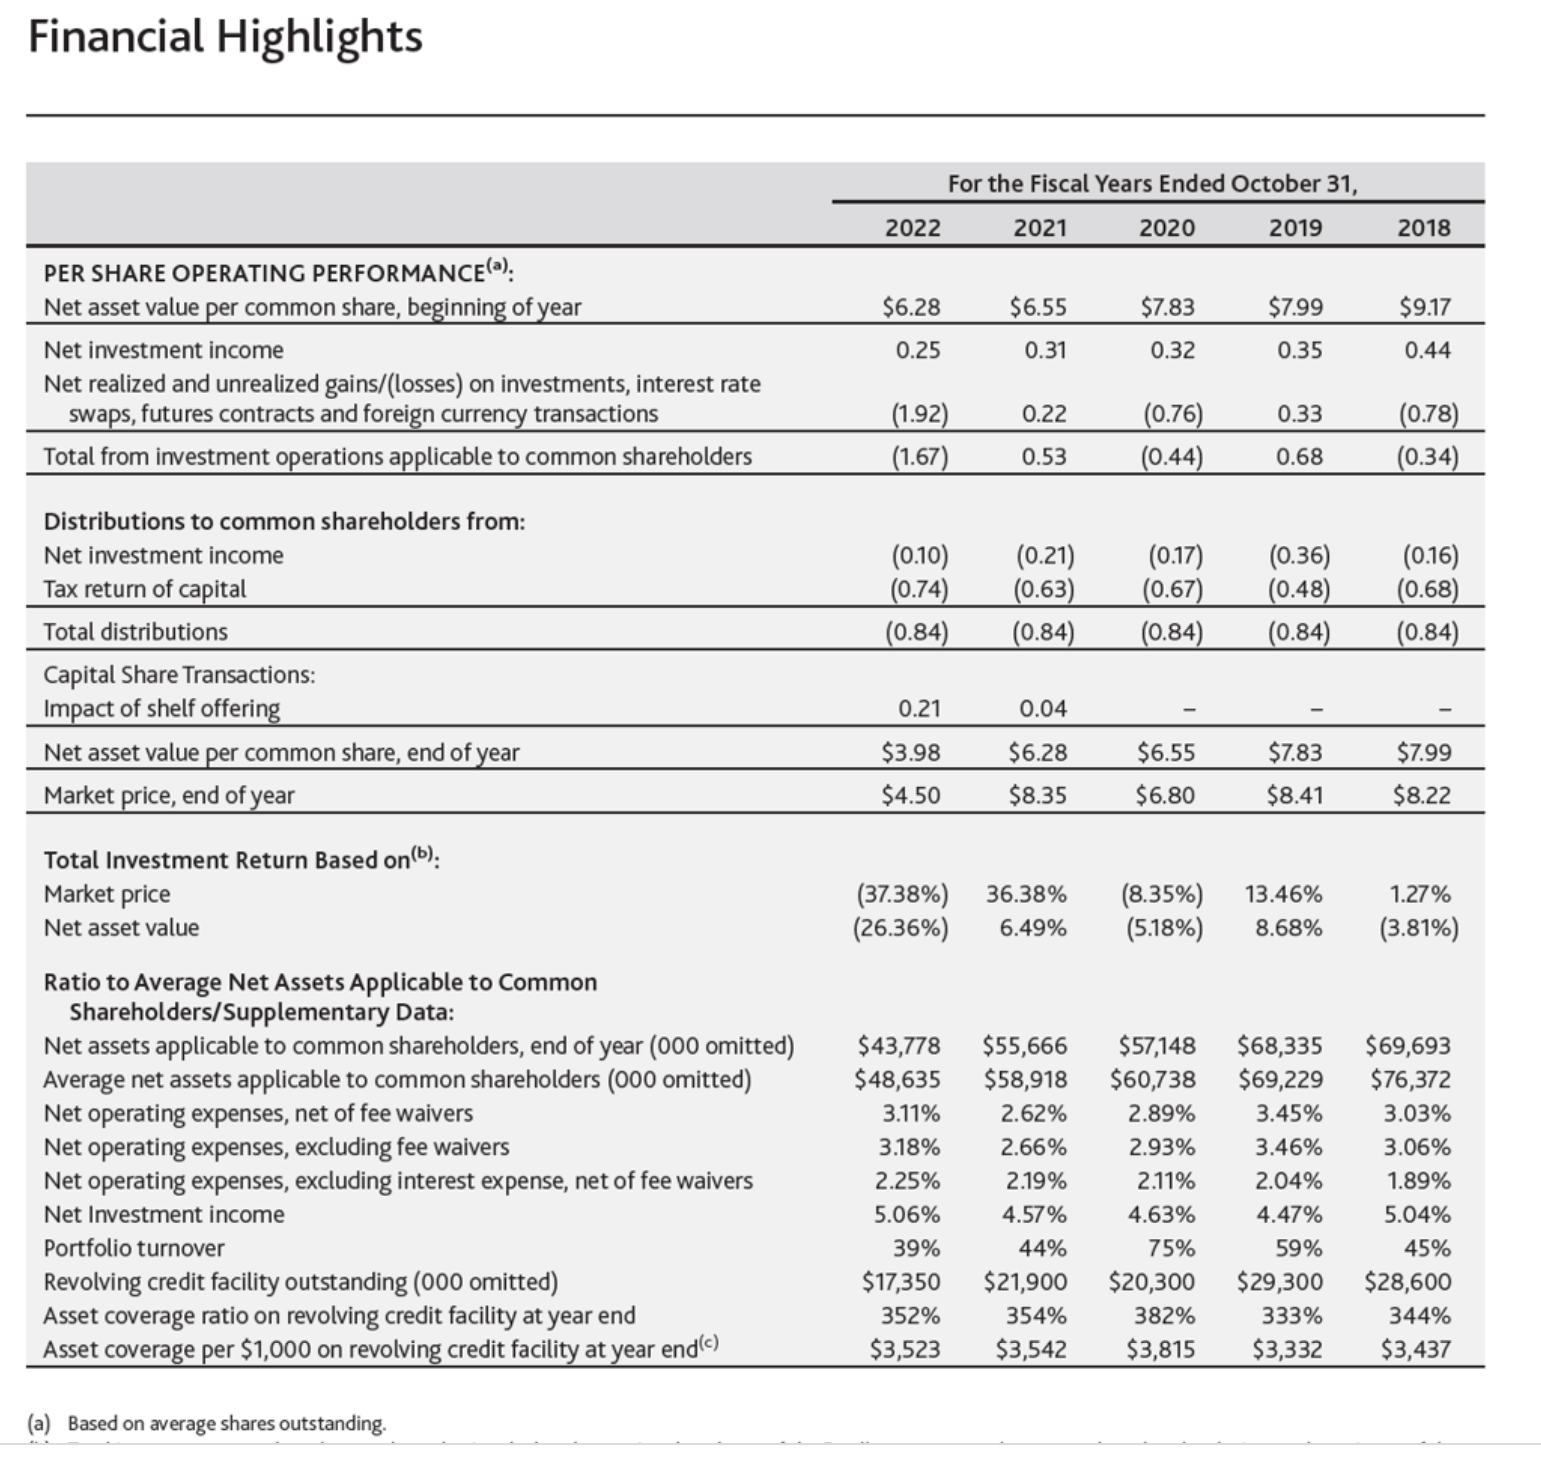
Before investors jump on the opportunity, they need to realize that with FCO's distribution is clearly unsustainable. A fund earning -0.9% average annual total returns over 10 years cannot sustain a 19.5% distribution yield. This is confirmed by the fund's annual report, which shows the vast majority of the fund's distribution is funded via value-destroying return of capital ("ROC").
The longer FCO maintains its unsustainable $0.07 monthly distribution, the more it will need to liquidate NAV. Investors buying this fund at a 33% premium today will most only likely get back $4.31 in NAV returned via ROC, plus a little bit extra from NII (Figure 8).
Figure 8 - FCO trades at a 33% premium to NAV (abrdnfco.com)
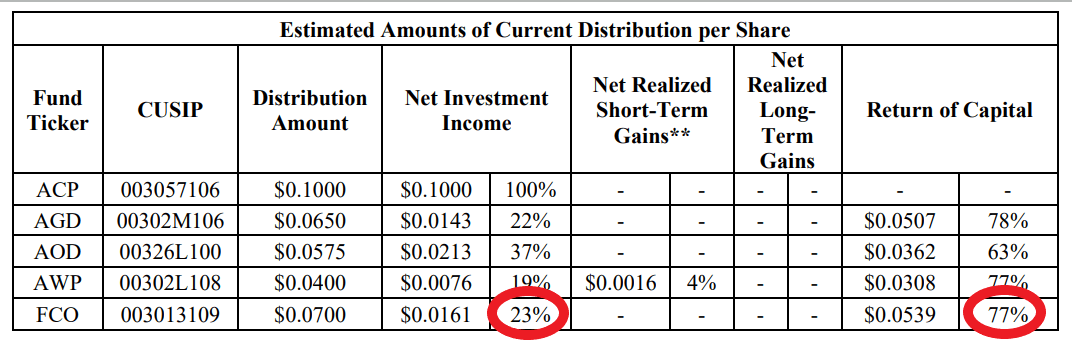
For example, for the most recent January 19 distribution, the fund is indicated to fund 77% of the $0.07 distribution via ROC. If this is projected for the full year, then the FCO fund may return another $0.65 of capital to shareholders in calendar 2022, further reducing the amount of income earning assets (Figure 8).
Figure 8 - FCO is funding majority of distribution via ROC (FCO January 2023 Section 19.a notice)
Conclusion
The FCO fund aims to provide high current income from a portfolio of global fixed income securities. While FCO pays an attractive 14.7% forward yield, investors need to look beneath the hood. FCO's distribution is mostly funded from ROC. Over 10 years, the fund has an average annual total return of -0.9%. It has grossly underperformed its peer group in both returns and volatility. It charges a 2.89% net expense ratio. Investors should avoid this fund.
For further details see:
FCO: Clearly Unsustainable Yield