SCHY - FDD: Overweight In Financials And Lagging Its Peers
Summary
- FDD invests in European high-yield stocks.
- It is overweight in financials.
- France, the U.K. and Germany represent about 58% of asset value.
- FDD shows poor performance in the last 10 years and in 2022 to date.
This dividend exchange-traded fund ("ETF") article series aims at evaluating products regarding the relative past performance of their strategies and quality of their current portfolios. As holdings and their weights change over time, reviews may be updated when necessary.
FDD strategy and portfolio
The First Trust Dow Jones STOXX European Select Dividend 30 Index ETF ( FDD ) tracks the STOXX® Europe Select Dividend 30 Index. It was launched on 09/15/2005. It has 30 holdings, a 12-month distribution yield of 6.04%, and a total expense ratio of 0.58%.
As described in the prospectus by First Trust , the underlying index selects companies in the STOXX Europe 600 Index that have a non-negative 5-year dividend growth rate and a dividend-to-earnings ratio of 60% or less.
For every eligible company, the dividend yield is divided by the dividend yield of its country index. Initially, the securities with the 30 best ratios are included in the index. Constituents are not removed as long as they are ranked in the top 60. When constituents are removed, the highest ranked candidates are added until reaching 30 constituents. They are weighted based on their net dividend yields, with a maximum weight of 15%. The index is reconstituted and rebalanced annually.
As of writing, the fund invests mostly in large and mid-caps (58% and 41%, respectively). The next chart plots the top 10 countries in asset value, for an aggregate weight about 98%, and compares them to the composition of a broad European index ETF: the Vanguard European Stock Index Fund ( VGK ). France comes first (24.5%), followed by the U.K. (18.3%) and Germany (15.6%). Other countries are below 8%. Compared to VGK, FDD overweights France, Germany, Italy and Belgium. It underweights the U.K., Switzerland and Sweden.
FDD countries (chart: author: data: FirstTrust and Fidelity)
The heaviest sector is financials by far (almost 40% of asset value), followed by utilities (17%) and materials (14.8%). Other sector weights are at or below 10% individually and 29% in aggregate. Compared to VGK, FDD massively overweights the top 3 sectors, and to a lesser extent communication and real estate. It ignores healthcare, consumer staples, technology and energy.
FDD sectors (chart: author: data: FirstTrust and Fidelity)
FDD looks much cheaper than VGK regarding valuation metrics (next table). However, the weight of financials is heavily skewing FDD ratios to the downside. In fact, the two funds cannot be reliably compared using these numbers.
| FDD |
| VGK |
| P/E TTM |
| 5.29 |
| 12.69 |
| Price / Book |
| 0.88 |
| 1.69 |
| Price / Sales |
| 0.5 |
| 1.25 |
| Price / Cash Flow |
| 3.73 |
| 8.84 |
The top 10 holdings, listed below, represent 46.26% of asset value. The heaviest ones weigh about 6%, so risks related to individual stocks are moderate.
| Name |
| Identifier |
| Sector |
| Weighting |
| Rio Tinto Plc |
| RIO.LN |
| Materials |
| 6.05% |
| Electricite de France S.A. |
| EDF.FP |
| Utilities |
| 5.93% |
| A.P. Moeller - Maersk A/S (Class A) |
| MAERSKA.DC |
| Industrials |
| 5.30% |
| ACS, Actividades de Construccion y Servicios, S.A. |
| ACS.SM |
| Industrials |
| 4.68% |
| Legal & General Group Plc |
| LGEN.LN |
| Financials |
| 4.55% |
| ASR Nederland N.V. |
| ASRNL.NA |
| Financials |
| 4.24% |
| IG Group Holdings Plc |
| IGG.LN |
| Financials |
| 4.06% |
| Bayerische Motoren Werke AG (Preference) |
| BMW3.GY |
| Cons. Discretionary |
| 3.85% |
| Holcim Limited |
| HOLN.SW |
| Materials |
| 3.82% |
| Credit Agricole S.A. |
| ACA.FP |
| Financials |
| 3.78% |
Past performance compared to its closest competitors
The next table compares the fund's performance and risk metrics in the last 10 years with VGK and a benchmark of U.S. dividend stocks: the Schwab U.S. Dividend Equity ETF ( SCHD ).
FDD has lagged SCHD by over 10 percentage points in annualized return. About 3 annualized percentage points are due to the Euro going down, and the rest to the relative performance of stocks in their respective currencies. FDD has also underperformed the broad European index ( VGK ).
| Trailing 10 years |
| Total Return |
| Annual Return |
| Drawdown |
| Sharpe ratio |
| Volatility |
| FDD |
| 31.32% |
| 2.76% |
| -40.53% |
| 0.21 |
| 17.74% |
| VGK |
| 54.53% |
| 4.45% |
| -37.32% |
| 0.32 |
| 16.04% |
| SCHD |
| 244.27% |
| 13.17% |
| -32.29% |
| 0.93 |
| 13.64% |
Data calculated with Portfolio123
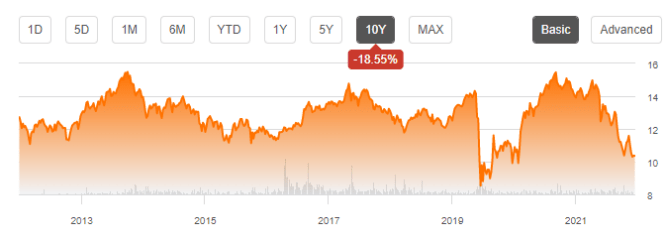
The annualized return of FDD in 10 years is below its average dividend yield. This is a red flag pointing to capital decay. In fact, the share price went down by 18.55% in 10 years.
FDD share price, trailing 10 years (TradingView on Seeking Alpha)
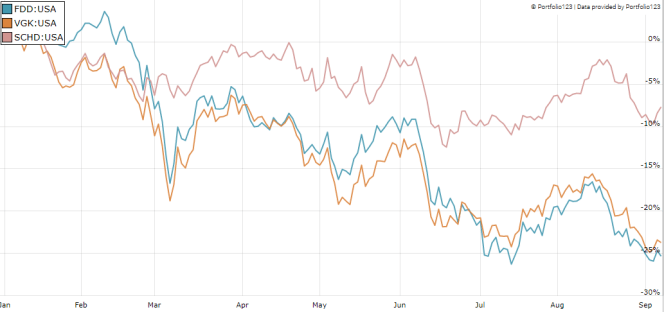
FDD is also the worst performer of the 3 funds year-to-date:
FDD, VGK and SCHD in 2022 to date (Portfolio123)
FDD vs. international high-yield ETFs
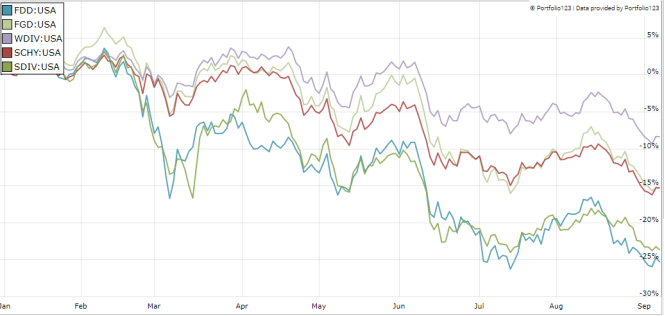
The next chart compares FDD with four high-yield global ETFs year-to-date: the First Trust Dow Jones Global Select Dividend ETF ( FGD ), the SPDR S&P Global Dividend ETF ( WDIV ), the Global X SuperDividend ETF ( SDIV ) and the Schwab International Dividend Equity ETF ( SCHY ). FDD is lagging the pack once again.
FDD vs. Global high-yield funds in 2022 to date (Portfolio123)
Takeaway
FDD holds 30 European high yield stocks. France, the U.K. and Germany represent about 58% of asset value. The fund is massively overweight in financials (40%). FDD has lagged a European stock benchmark and a number of global dividend funds in 2022. It has lost about 18% in share price in the last 10 years. Currency rates are responsible for about one third of underperformance. Like most funds chasing high yields, FDD shows high risk metrics (drawdown and volatility) and poor historical performance. For transparency, a dividend-oriented part of my equity investments is split between a passive ETF allocation and my actively managed Stability portfolio (14 stocks), disclosed and updated in Quantitative Risk & Value.
For further details see:
FDD: Overweight In Financials And Lagging Its Peers