UPS - FDL: Portfolio Quality Has Improved
Summary
- FDL holds 98 stocks with stable or increasing dividends.
- Energy and financials are its heaviest sectors.
- Quality and recent performance are attractive, it was not the case in the last review.
- Long-term performance and risk metrics are still underwhelming.
This ETF article series aims at evaluating products regarding the relative past performance of their strategies and quality metrics of their current portfolios. As holdings and weights change over time, updated reviews are posted when necessary.
FDL strategy and portfolio
The First Trust Morningstar Dividend Leaders Index Fund ( FDL ) has been tracking the Morningstar ® Dividend Leaders Index SM since 3/9/2006. It has 98 holdings, a 12-month distribution yield of 3.58% and an expense ratio of 0.45%.
As described by First Trust , eligible stocks must be listed in the U.S. Companies are excluded if they have: non-qualifying income dividends (in particular REITs), a negative 5-year dividend growth, or a projected payout ratio above 100%. Eligible stocks are ranked by dividend yield, and the top 100 are selected in the index. Constituents are weighted based on the dollar value of indicated dividends, with a limit of 10% by constituent, and 50% in aggregate for constituents above 5%. The index is rebalanced quarterly and reconstituted annually.
The fund is almost exclusively invested in U.S. companies (99.6% of asset value), mostly in large caps (80%). The heaviest sectors are energy and financials (about 20% each), followed by consumer staples (13%). Other sectors are below 10%. Compared to the S&P 500 ( SPY ), FDL overweights the top 3 sectors listed above, utilities, and communication. It widely underweights technology, consumer discretionary and healthcare. It ignores real estate by index constitution. Sector composition may change over time.
Sector breakdown (chart: author; data: First Trust)
The portfolio is very concentrated: the top 10 holdings have an aggregate weight of 54%. They are listed in the next table with their weights and some fundamental ratios. Exposure to risks related to the heaviest constituents is significant. The top two names (Exxon Mobil and Verizon) represent almost 19% of asset value.
| Ticker |
| Name |
| Weight |
| EPSgrowth %ttm |
| P/E ttm |
| P/E fwd |
| Yield% |
| Exxon Mobil Corp. |
| 10.29% |
| 146.59 |
| 8.36 |
| 10.25 |
| 3.27 |
| Verizon Communications, Inc. |
| 8.61% |
| -5.00 |
| 8.28 |
| 8.82 |
| 6.24 |
| AbbVie, Inc. |
| 6.09% |
| 78.71 |
| 19.30 |
| 10.52 |
| 4.09 |
| Philip Morris International, Inc. |
| 5.58% |
| -2.36 |
| 18.44 |
| 18.25 |
| 4.91 |
| Altria Group, Inc. |
| 4.79% |
| 139.50 |
| 14.73 |
| 9.32 |
| 8.01 |
| Cisco Systems, Inc. |
| 4.50% |
| 2.87 |
| 17.83 |
| 13.91 |
| 3.08 |
| International Business Machines Corp. |
| 3.85% |
| -72.26 |
| 77.52 |
| 14.38 |
| 4.84 |
| Pioneer Natural Resources Co. |
| 3.65% |
| 407.15 |
| 7.85 |
| 7.15 |
| 7.49 |
| United Parcel Service, Inc. |
| 3.40% |
| -10.07 |
| 14.48 |
| 16.66 |
| 3.39 |
| Citigroup, Inc. |
| 3.22% |
| -30.69 |
| 7.47 |
| 8.70 |
| 3.91 |
Ratios from Portfolio123
Regarding the usual valuation ratios, FDL is much cheaper than the S&P 500:
| FDL |
| SPY |
| Price/Earnings TTM |
| 12.32 |
| 19.02 |
| Price/Book |
| 2.29 |
| 3.59 |
| Price/Sales |
| 1.55 |
| 2.26 |
| Price/Cash Flow |
| 8.34 |
| 14.19 |
Source: Fidelity
Performance
FDL has underperformed SPY by about 1.2 percentage points in annualized return since inception in March 2006. Moreover, risk measured in drawdown and standard deviation of monthly returns (volatility) is significantly higher.
| Total Return |
| Annual Return |
| Drawdown |
| Sharpe ratio |
| Volatility |
| FDL |
| 264.33% |
| 7.96% |
| -65.93% |
| 0.48 |
| 16.61% |
| SPY |
| 342.94% |
| 9.21% |
| -55.19% |
| 0.57 |
| 15.71% |
Data calculated with Portfolio123
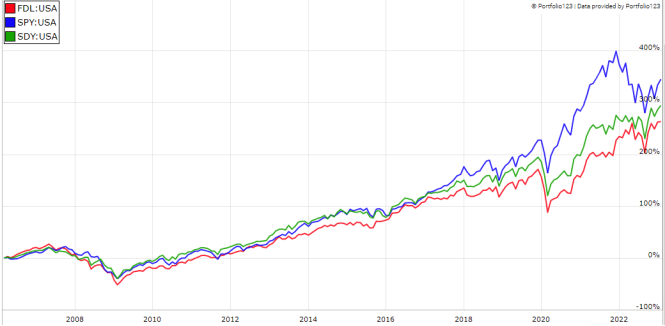
The next chart shows that it is also behind a dividend benchmark, the SPDR S&P Dividend ETF ( SDY ).
FDL vs SPY, SDY since inception (Portfolio123)
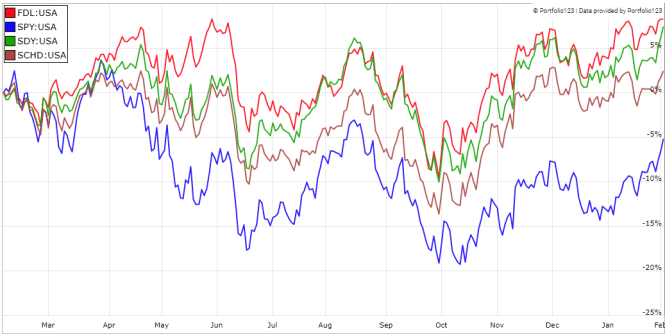
However, it has outperformed in the last 12 months, beating SPY, SDY, and the Schwab U.S. Dividend Equity ETF ( SCHD ).
FDL vs SPY, SDY, SCHD - last 12 months (Portfolio123)
FDL has a 10-year annual dividend growth rate of 6.3%. This is a bad point: it is inferior to the dividend growth rate of the S&P 500 in the same period (7.4%).
In previous articles, I have shown how three factors may help cut the risk in a dividend portfolio: Return on Assets , Piotroski F-score , and Altman Z-score .
The next table compares FDL with a subset of the S&P 500: stocks with an above-average dividend yield, an above-average ROA, a good Altman Z-score, a good Piotroski F-score and a sustainable payout ratio. The subset is rebalanced annually to make it comparable with a passive index.
| Total Return |
| Annual Return |
| Drawdown |
| Sharpe ratio |
| Volatility |
| FDL |
| 264.33% |
| 7.96% |
| -65.93% |
| 0.48 |
| 16.61% |
| Dividend quality subset |
| 499.29% |
| 11.19% |
| -42.50% |
| 0.7 |
| 15.29% |
P ast performance is not a guarantee of future returns. Data Source: Portfolio123
FDL lags the dividend quality subset by 3.2 percentage points in annualized return, and shows a much worse maximum drawdown. A note of caution: ETF performance is real and this subset is simulated. My core portfolio holds 14 stocks selected in this subset (more info at the end of this post).
Scanning FDL with quality metrics
FDL holds 98 stocks, of which 14 are risky regarding my metrics. These are stocks with at least two red flags among: bad Piotroski score, negative ROA, unsustainable payout ratio, bad or dubious Altman Z-score, excluding financials for which these metrics are unreliable. Risky stocks weigh only 4.5% of asset value: this is a good point.
According to my calculations, the weighted Piotroski F-score and ROA are better than for the S&P500 (see next table). These metrics point to a portfolio quality slightly superior to the benchmark. It is a significant improvement since my review of December 2021 .
| FDL |
| SPY |
| Atman Z-score |
| 2.6 |
| 3.5 |
| Piotroski F-score |
| 6 |
| 5.61 |
| ROA % TTM |
| 9.08 |
| 7.28 |
Takeaway
FDL holds 98 stocks of U.S. companies with a positive 5-year dividend growth and a sustainable projected payout ratio. Over 40% of asset value is in energy and financials. The fund is concentrated: 54% of asset value is in the top 10 holdings, and 19% in the top 2. Valuation ratios are cheap, and aggregate quality metrics are slightly superior to S&P 500 averages. However, the dividend growth rate is sub-par. FDL has done very well in the complicated period of the last 12 months, but it has underperformed the S&P 500 since inception and shows a higher risk in drawdown and volatility. For transparency, a dividend-oriented part of my equity investments is split between a passive ETF allocation (FDL is not part of it) and my actively managed Stability portfolio (14 stocks), disclosed and updated in Quantitative Risk & Value.
For further details see:
FDL: Portfolio Quality Has Improved