FDRR - FDRR: This Dividend Strategy Looks Good On Paper
2023-06-26 15:37:31 ET
Summary
- FDRR is an investment vehicle mindful of macro, utilizing an equity strategy calibrated to benefit from tighter monetary policy in the U.S.
- Past performance revealed flaws in the strategy.
- A case for monetary policy to remain contractionary still could be constructed, but as FDRR's past performance illustrated, this is hardly enough for its holdings to appreciate meaningfully.
- The portfolio does have strong factor exposure, with value and quality nicely balanced, but this does not immediately imply it can beat the market going forward.
The ETF universe is so voluminous that investors are not short of options to select from to prepare for any macro scenario, be it economic doldrums, a period of rampant growth, rising or falling interest rates, etc.
The Fidelity Dividend ETF for Rising Rates ( FDRR ) is one such investment vehicle mindful of macro, utilizing an equity strategy calibrated to benefit from tighter monetary policy in the U.S. One of the premises here is that certain dividend-paying equities with a positive correlation of returns to the 10-year U.S. Treasury yield should appreciate when the central bank aims at slowing down economic expansion and suppressing inflation.
The previous time I covered FDRR was in May 2022, when I concluded the ETF did not deserve a Buy rating, even though hawks were obviously in the driver's seat amid hot inflation, an opportune moment for stocks that tend to climb higher when interest rates are rising sharply. The major reason was its inability to beat the iShares 7-10 Year Treasury Bond ETF ( IEF ), a surprising development as the IEF holdings slip when interest rates are on the rise, and vice versa, while FDRR's peers designed for an inflationary environment also did better, highlighting deep flaws of its strategy. The S&P 500 index has risen by almost 11% since then while the FDRR ETF was flat.
Seeking Alpha
Today, I am still not bullish. Why? There are a few essential issues to discuss. Let us take a look at how the FDRR portfolio has changed since May 2022, as there is a great deal of valuable information in its factor exposure, so we should not ignore it.
Investment strategy and current holdings
As a refresher, the Fidelity Dividend Index for Rising Rates is the foundation of FDRR's strategy. As mentioned in the summary prospectus , the index
... is designed to reflect the performance of stocks of large and mid-capitalization dividend-paying companies that are expected to continue to pay and grow their dividends and have a positive correlation of returns to increasing 10-year U.S. Treasury yields.
As I have already said in the previous note, its sophisticated multi-step selection and weighting schema with the composite score at the basis make the benchmark permanently grossly overweight U.S. stocks, even though other developed world equities are eligible for inclusion (but with a maximum of 10% total weight). The ingredients of the score are:
The dividend yield (the heaviest in the mix, 63%), the payout ratio (a 13.5% weight), dividend growth (the same weight), and the correlation of weekly returns to weekly changes in the 10-year Treasury yields (10%).
The index is rebalanced once a year, but its constituents are checked quarterly in case they are no longer paying a dividend. More details on the process can be found in the methodology document .
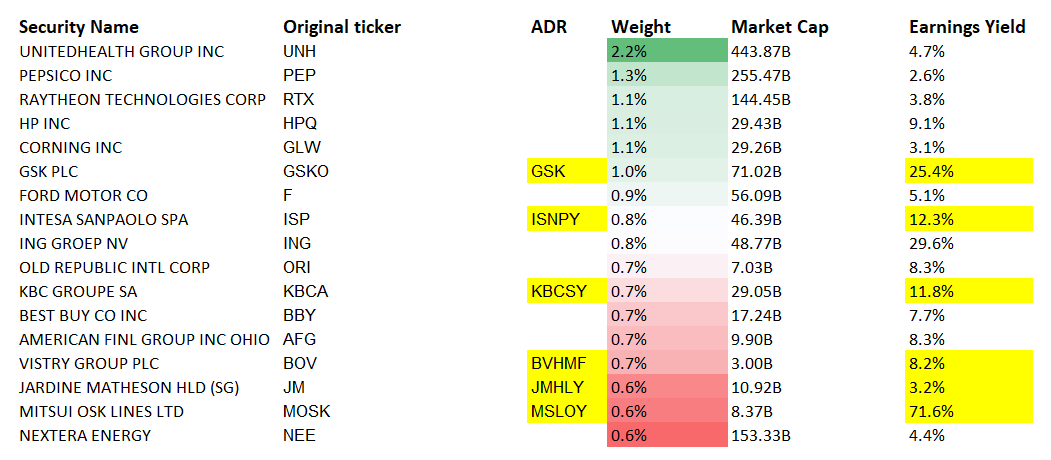
In the current version, there are 109 holdings in the FDRR portfolio, and a similar number was seen in May 2022. But the exact composition is obviously not entirely the same. For instance, 38 names (accounting for almost 23%) that the fund is currently long were absent as of writing the previous note, with the ten most notable additions, including a few non-U.S. stocks, shown in the table below.
Calculated by the author using data from Seeking Alpha and the fund. EYs are shown for ADRs.
Among removed companies, Gilead Sciences ( GILD ) and Oracle ( ORCL ) had the most significant weights in the May 2022 version, 1.4% and 1.2%, respectively.
What factor mix is FDRR offering at the moment?
| Market Cap |
| Sales Fwd |
| EPS Fwd |
| EY |
| P/S |
| ROE |
| ROA |
| DY |
| $580.5 billion |
| 5.4% |
| 4.2% |
| 7% |
| 4.55 |
| 38.9% |
| 11.4% |
| 3.3% |
Calculated by the author using data from Seeking Alpha and the fund. Data as of June 23
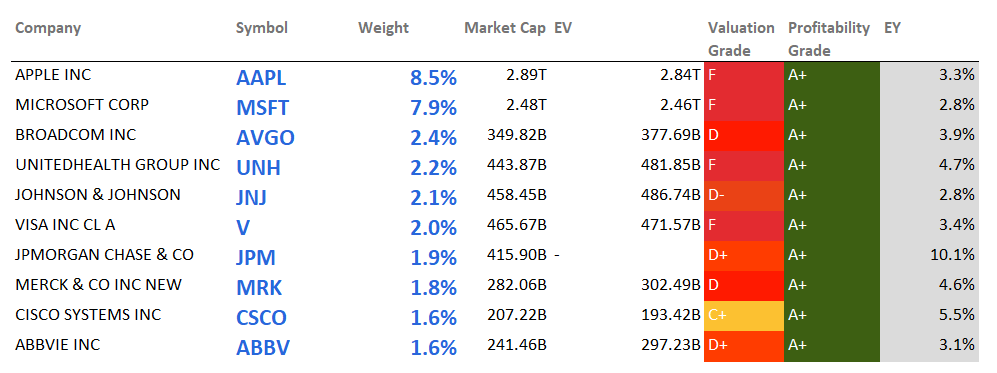
First, owing to the weighting schema, the fund ended up being overweight mega caps (close to 69%), with large exposure to the $1 trillion league, namely to Apple ( AAPL ) and Microsoft ( MSFT ). Thus, its weighted-average market cap of over $580 billion is hardly surprising. What is a bit strange is its slight value tilt manifested in a 7% earnings yield (a 14.2x P/E compared to IVV's 21.8x), as well as a 3.3% last twelve months dividend yield (1.56% for IVV). About 21.5% of the holdings have a B- Quant Valuation grade or higher, which is hardly spectacular, but still somewhat fine for a mega-cap heavy mix. Quality is close to exemplary, with over 92% of the companies having a B- Profitability grade or better. The ROE/ROA spread is adequate. Growth rates are tepid, but this is commonplace for dividend-oriented strategies.
The following table includes key valuation and quality data for the 10 main holdings of the fund.
Created by the author using data from Seeking Alpha and the fund
Performance
I am not impressed with FDRR's performance. Obviously, it did a good job last year, beating the iShares Core S&P 500 ETF ( IVV ) by around 7.7%, with a loss of just 10.5%. But I believe this is not a total return an investor seeking to benefit from tighter monetary policy would expect, especially considering a few value ETFs and funds designed to benefit from inflation still did better.
| ETF |
| 2022 Total Return |
| Fidelity Dividend ETF for Rising Rates ( FDRR ) |
| -10.47% |
| iShares 7-10 Year Treasury Bond ETF ( IEF ) |
| -15.19% |
| iShares Core S&P 500 ETF ( IVV ) |
| -18.16% |
| Fidelity Stocks for Inflation ETF ( FCPI ) |
| -7.1% |
| Horizon Kinetics Inflation Beneficiaries ETF ( INFL ) |
| 2.64% |
| Invesco S&P 500 Pure Value ETF ( RPV ) |
| -1.28% |
Data from Portfolio Visualizer
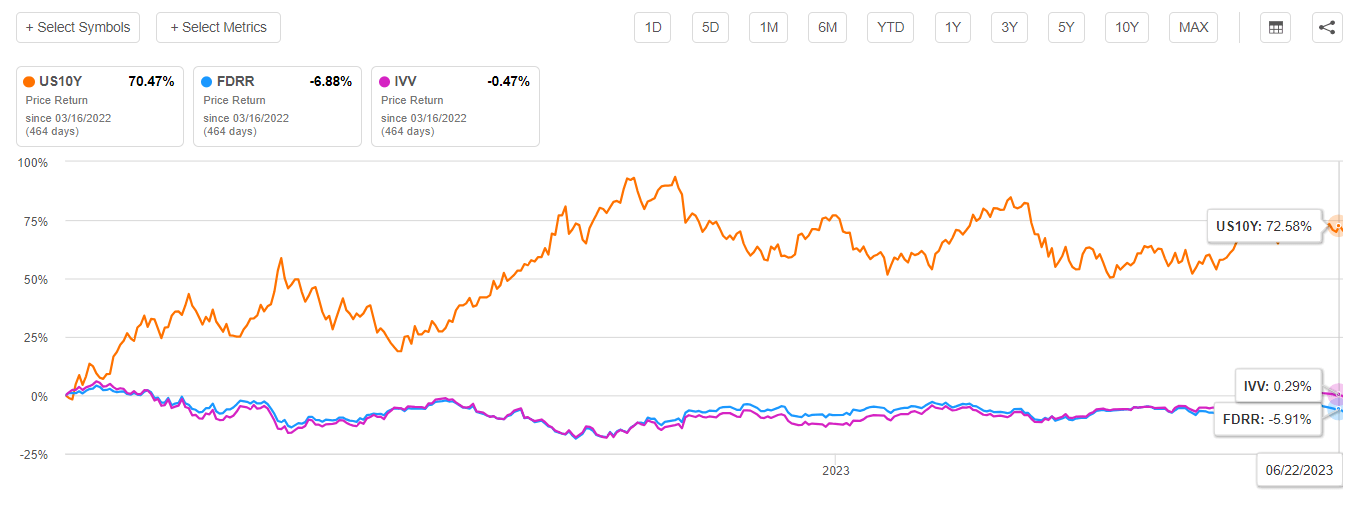
On March 16, 2022, the Fed ended the ultra-loose monetary policy era with a 25 bps rate hike as previously seemingly 'transitory' inflation was no longer tolerable. The chart below shows how FDRR and IVV have performed since that date. The US10Y was added for better context.
Surprisingly, with the 10-year yield soaring, FDRR managed to somehow underperform IVV, which was hardly positioned for higher interest rates, assuming its tech and growth exposure.
And the key reason here is that FDRR almost completely missed the growth rally this year.
So, with a slightly better return in 2022 and the recent growth rally missed, FDRR's longer-term returns are somewhat subdued. More specifically, since inception on 12 September 2016, over the October 2016 - May 2023 period, the ETF underperformed IVV, with a CAGR 2.6% lower; however, it is partly attributable to its expense ratio of 29 bps. vs. IVV's 3 bps. Both beat IEF nevertheless.
| Portfolio |
| FDRR |
| IEF |
| IVV |
| Initial Balance |
| $10,000 |
| $10,000 |
| $10,000 |
| Final Balance |
| $18,580 |
| $9,819 |
| $21,718 |
| CAGR |
| 9.74% |
| -0.27% |
| 12.34% |
| Stdev |
| 16.41% |
| 6.66% |
| 16.51% |
| Best Year |
| 26.86% |
| 10.01% |
| 31.25% |
| Worst Year |
| -10.47% |
| -15.19% |
| -18.16% |
| Max. Drawdown |
| -23.86% |
| -21.22% |
| -23.93% |
| Sharpe Ratio |
| 0.56 |
| -0.22 |
| 0.71 |
| Sortino Ratio |
| 0.82 |
| -0.29 |
| 1.06 |
| Market Correlation |
| 0.96 |
| 0.07 |
| 1 |
Data from Portfolio Visualizer
Investor Takeaway
In summary, investors should answer two questions.
- First, will interest rates in the U.S. continue to climb higher?
- Second, was FDRR's performance demonstrated during periods of tighter monetary policy robust enough?
Regarding the first question, a case for monetary policy to remain contractionary still could be constructed. The Fed did pause hiking earlier in June, thus grossly contributing to the rally in growth stocks and allowing the S&P 500 to entrench in the bull market territory. However, even though inflation is trending down, it is yet to hit the Fed's 2% target. And the comments made by the Fed Chair during the testimony before the House Financial Services Committee suggest more hikes are most likely ahead.
Regarding the second question, I would say FDRR's return clocked during the most hawkish episodes is hardly attractive. It did beat the S&P 500 ETF, but simpler value plays did better nevertheless. That is to say, even though interest rates may still go higher, there is little to no reason to anticipate FDRR's holdings to appreciate meaningfully as a consequence. The portfolio does have strong factor exposure, with value and quality nicely balanced, but this does not immediately imply it can beat the market going forward. There are dividend characteristics to appreciate, like 81.6% of the companies having robust Quant Dividend Consistency grades, but this is obviously not enough for a Buy thesis.
To conclude, investors who have an ambition to beat IVV should look elsewhere; the Hold rating is maintained.
For further details see:
FDRR: This Dividend Strategy Looks Good On Paper