FDVV - FDVV: A Well-Diversified Dividend ETF
2023-03-22 06:37:08 ET
Summary
- FDVV is a dividend fund by Fidelity, well-diversified across sectors and holdings.
- Valuation ratios look attractive, and quality is a bit superior to the benchmark.
- Regarding total return, it is close to similar funds by Vanguard and iShares.
- However, it has lagged Schwab’s SCHD.
This article series aims at evaluating ETFs regarding past performance and portfolio quality. As holdings and fundamental ratios change over time, reviews may be updated when necessary.
FDVV strategy and performance
The Fidelity High Dividend ETF ( FDVV ) has been tracking the Fidelity High Dividend Index since 09/12/2016. It has 108 holdings, a 12-month distribution yield of 3.35% and a total expense ratio of 0.29%. Distributions are paid quarterly.
As described in the prospectus by Fidelity ,
The Fidelity High Dividend Index is designed to reflect the performance of stocks of large and mid-capitalization dividend-paying companies that are expected to continue to pay and grow their dividends.
The fund invests mostly in U.S. based companies (89% of asset value), but also in Europe (7%) and Asia (about 3%). Large companies represent over 84% of the portfolio, mid-cap about 11% and small cap about 4%. The turnover rate was 38% of the portfolio’s average value in the most recent fiscal year.
The heaviest sectors are financials (20.2%) and technology (18.3%). They are followed by industrials (15.5%), consumer staples (12.8%) and energy (11.2%). Other sectors are below 10%. Compared to the S&P 500 ( SPY ), the fund overweights financials, industrials, consumer staples, energy and real estate. It underweights technology, healthcare, consumer discretionary, communication. Materials and utilities are ignored.
Sector breakdown ( Chart: author; data: Fidelity)
The top 10 holdings, listed below with fundamental ratios, represent 27.3% of asset value. The top 2 names, Apple and Microsoft, weight 9.6% together. Risks related to other individual companies are low.
| Ticker |
| Name |
| Weight% |
| EPS growth %TTM |
| P/E TTM |
| P/E fwd |
| Yield% |
| Apple, Inc. |
| 5.2 |
| -2.28 |
| 26.74 |
| 26.39 |
| 0.58 |
| Microsoft Corp. |
| 4.47 |
| -4.31 |
| 30.27 |
| 29.26 |
| 1.00 |
| JPMorgan Chase & Co. |
| 2.58 |
| -21.22 |
| 10.52 |
| 9.73 |
| 3.15 |
| Exxon Mobil Corp. |
| 2.5 |
| 146.43 |
| 7.71 |
| 9.58 |
| 3.55 |
| Procter & Gamble Co. |
| 2.34 |
| 0.63 |
| 25.49 |
| 24.89 |
| 2.52 |
| PepsiCo, Inc. |
| 2.19 |
| 16.90 |
| 27.69 |
| 24.50 |
| 2.59 |
| The Coca-Cola Co. |
| 2.11 |
| -2.59 |
| 27.63 |
| 23.33 |
| 3.04 |
| Chevron Corp. |
| 2 |
| 124.46 |
| 8.47 |
| 10.01 |
| 3.91 |
| Bank of America Corp. |
| 1.98 |
| -10.72 |
| 8.72 |
| 8.04 |
| 3.17 |
| Nvidia Corp. |
| 1.95 |
| -54.71 |
| 148.73 |
| 58.32 |
| 0.06 |
Historical performance
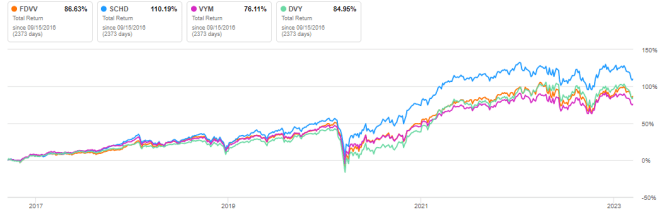
The next chart compares the total returns of FDVV and three competitors with distribution yields in a 3-4% range:
- Schwab U.S. Dividend Equity ETF ( SCHD )
- Vanguard High Dividend Yield Index Fund ( VYM )
- iShares Select Dividend ETF ( DVY )
FDVV is almost on par with DVY, it lags SCHD and beats VYM by a short margin.
FDVV vs. Competitors since September 2016 (Seeking Alpha)
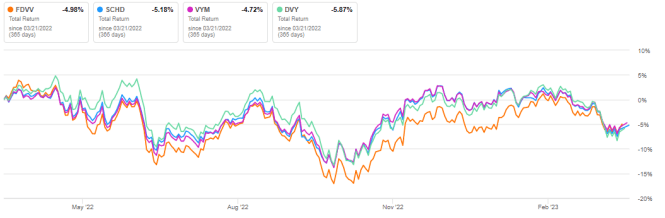
In the last 12 months, the four funds are almost tie:
FDVV vs. Competitors, last 12 months (Seeking Alpha)
In previous articles, I have shown how three factors may help cut the risk in a dividend portfolio: Return on Assets , Piotroski F-score , and Altman Z-score .
The next table compares FDVV since 10/1/2016 with a subset of the S&P 500: stocks with above-average dividend yield and ROA, a good Altman Z-score, a good Piotroski F-score and a sustainable payout ratio. It is rebalanced annually to make it comparable with a passive index.
| Total Return |
| Annual Return |
| Drawdown |
| Sharpe ratio |
| Volatility |
| FDVV |
| 84.69% |
| 9.96% |
| -40.25% |
| 0.6 |
| 18.11% |
| Dividend quality subset |
| 108.65% |
| 12.06% |
| -36.22% |
| 0.73 |
| 17.15% |
Past performance is not a guarantee of future returns. Data: Portfolio123
The dividend quality subset beats FDVV by about 2 percentage points in annualized return. However, the fund’s performance is real, and the subset is simulated. My core portfolio holds 14 stocks selected in this subset (more info at the end of this post).
The next table compares the evolution of annual distributions for the four funds between 2017 and 2022. Regarding dividend growth during this period, FDVV is far behind SCHD, but ahead of DVY.
| D istributions per share |
| FDVV |
| SCHD |
| VYM |
| DVY |
| 2017 |
| 1.04 |
| 1.35 |
| 2.40 |
| 2.37 |
| 2022 |
| 1.28 |
| 2.56 |
| 3.25 |
| 2.46 |
| Total growth |
| 23.08% |
| 89.63% |
| 35.42% |
| 3.80% |
| annualized |
| 4.24% |
| 13.65% |
| 6.25% |
| 0.75% |
Scanning the portfolio
FDVV is significantly cheaper than the S&P 500 ( SPY ) regarding aggregate valuation ratios, reported in the table below.
| FDVV |
| SPY |
| Price/Earnings TTM |
| 9.77 |
| 19.89 |
| Price/Book |
| 2.23 |
| 3.64 |
| Price/Sales |
| 2.14 |
| 2.31 |
| Price/Cash Flow |
| 7.05 |
| 14.62 |
FDVV holds about 100 stocks, 8 of them are risky regarding my metrics. In my ETF reviews, risky stocks are companies with at least 2 red flags among: bad Piotroski score, negative ROA, unsustainable payout ratio, bad or dubious Altman Z-score, excluding financials and real estate where these metrics are unreliable. Here, risky stocks weigh less than 2% of asset value, which is a good point.
According to my calculations, the aggregate Altman Z-score and Piotroski F-score are similar to SPY. ROA is a bit better. These metrics point to a portfolio quality slightly superior to the benchmark.
| FDVV |
| SPY |
| Altman Z-score |
| 3.66 |
| 3.33 |
| Piotroski F-score |
| 5.24 |
| 5.54 |
| ROA % TTM |
| 10.37 |
| 7.55 |
Takeaway
FDVV is a dividend fund whose heaviest sectors are financials and technology. It is well-diversified across a number of sectors and holdings. Valuation metrics are attractive, and quality is a bit superior to the S&P 500. Compared to three of its most popular competitors, it is significantly behind the best performer ( SCHD ) in total return, and also in dividend growth.
For further details see:
FDVV: A Well-Diversified Dividend ETF