FDVV - FDVV: Shrinking 3.25% Dividend Yield But An Optimistic Outlook
2023-05-28 21:36:55 ET
Summary
- FDVV selects approximately 100 securities based on a proprietary dividend yield, dividend growth, and dividend payout ratio screen. Fees are 0.29%, and the ETF manages $1.5 billion in assets.
- February's reconstitution improved the fund's quality but decreased its yield. Instead of FDVV's 3.81% trailing dividend yield, shareholders can expect 3.25% going forward.
- The lower yield may be disappointing but I view it positively from a total returns perspective. Utilities stocks were removed entirely, and the ETF is a top performer in 2023.
- Furthermore, FDVV has never been a bottom-quartile performer since its inception and is a leading dividend ETF this year as a result of these changes. I've upgraded my rating to a buy.
Investment Thesis
The Fidelity High Dividend ETF ( FDVV ) underwent substantial changes in February, abandoning its reliance on the struggling Electric Utilities industry in favor of higher allocations to mega-cap stocks like Apple ( AAPL ) and Microsoft ( MSFT ). It may seem strange for a high-dividend ETF, but FDVV will still deliver a solid 3.25% dividend yield, allowing it to compete with peers like the Schwab U.S. Dividend Equity ETF ( SCHD ) and the iShares Core Dividend ETF ( DIVB ). This article will highlight the results of the latest reconstitution, take a multi-factor approach to evaluate FDVV's strengths and weaknesses, and ultimately, decide whether it's worth buying.
FDVV Overview
Strategy Discussion
FDVV tracks the Fidelity High Dividend Index, selecting approximately 100 securities based on a proprietary method. The factors the Index screens for and the weightings applied are as follows:
- Trailing Twelve-Month Dividend Yield (70%)
- Trailing Twelve-Month Dividend Payout Ratio (15%)
- Trailing One-Year Dividend Growth (15%)
The Index calculates a composite score for each Russell 1000 security relative to others in the same sector, ensuring reasonable sector diversification. To illustrate, Apple and Microsoft are prominent holdings despite yielding less than 1%. However, few Technology companies pay high dividends, so they still qualify because they rank well on the other two factors.
I believe Fidelity's model aims for a portfolio beta close to one. I've followed FDVV for two years, and the five-year beta was between 0.98 and 1.04 each time. This feature is unusual for any dividend ETF, especially a high-yielding one. The exception that comes to mind is the SPDR Portfolio S&P 500 High Dividend ETF ( SPYD ), but that ETF targets companies near the bottom end of the large-cap segment, so it's not a great comparator.
Sector Exposures and Top Ten Holdings
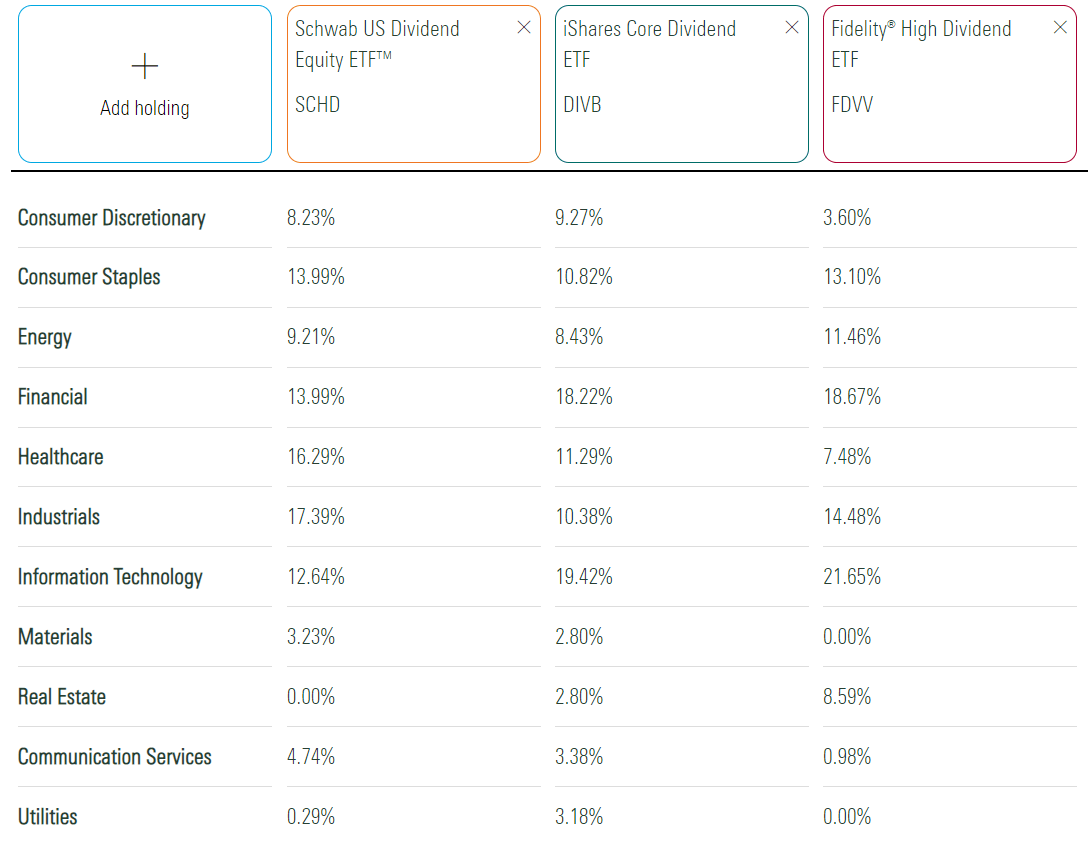
Instead, SCHD and DIVB are two alternatives I want you to consider. The trailing yields are 3.75% and 2.49% compared to FDVV's 3.81%. However, DIVB changed its strategy in December, and it will take another six months or so for its trailing yield to reflect its current composition. Furthermore, FDVV won't yield 3.84% anymore. My analysis reveals a yield closer to 3.25%, which I will discuss shortly. For now, let's examine the sector exposures of the three.
FDVV reduced Utilities sector exposure from 12% to 0% in February, which, as discussed in my last article , I hoped would happen. To offset this less-volatile sector, the Index added 13% to Consumer Staples and decreased Materials by 10%. Still, whereas FDVV previously had only one sector with less than a 1% allocation, now there are three, so it's less diversified than before.
FDVV differs from SCHD and DIVB for its higher exposure to Real Estate, meaning less of its distribution is considered qualified income for tax purposes. However, FDVV looks most similar to DIVB. Besides Real Estate, the most considerable allocation difference of 5.67% in Consumer Discretionary.
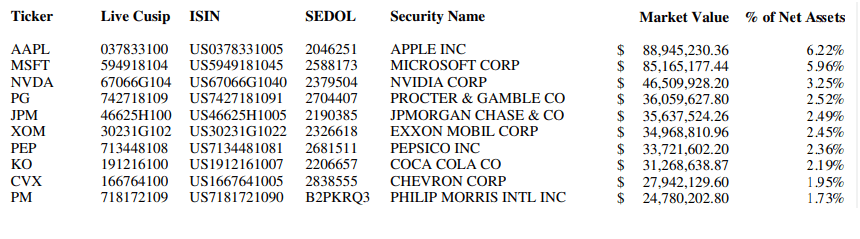
Finally, FDVV's top ten holdings are below. NVIDIA ( NVDA ) joins Apple and Microsoft as a prominent tech holding, which shareholders cheered following the updated guidance from earlier this week. Also included are defensive Consumer Staples stocks like PepsiCo ( PEP ) and Coca-Cola ( KO ), along with Energy giants Exxon Mobil ( XOM ) and Chevron ( CVX ).
Reconstitution Results
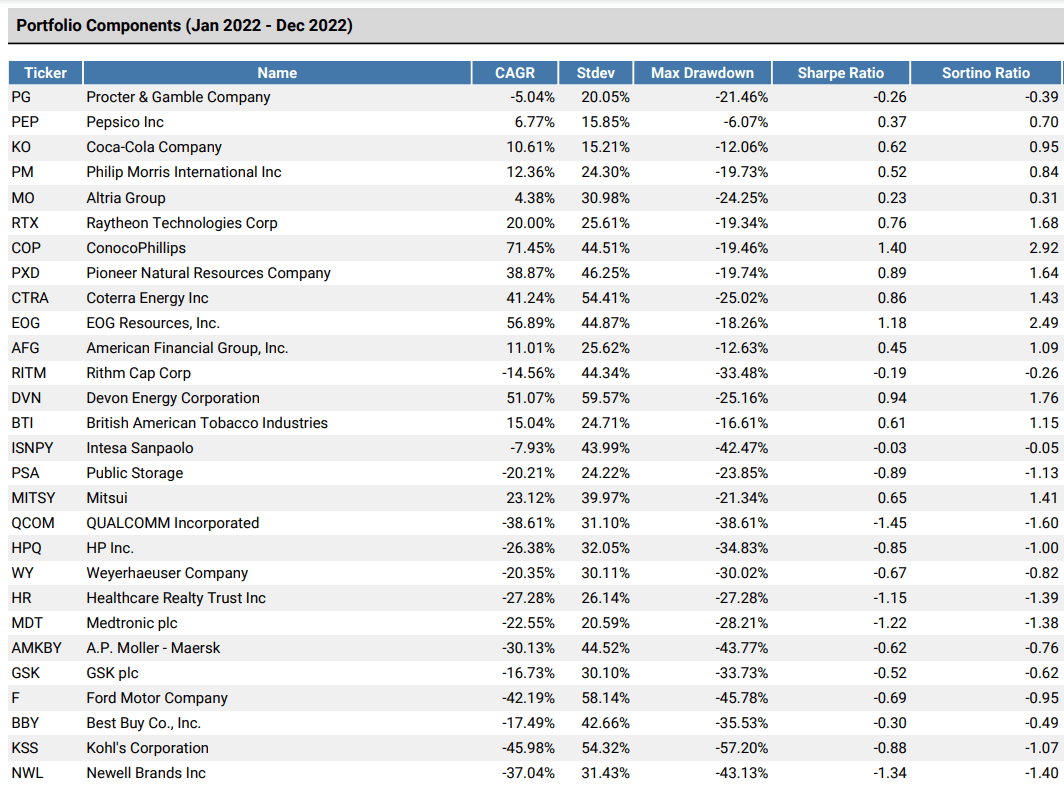
In February, FDVV added 29 stocks (31% total weight) and deleted 33 (42% total weight) in an eventful annual reconstitution that I've come to expect. Let's start with last year's returns for the additions, several of which you'll recognize from the list above.
I ordered these additions based on current allocations, and you can see that many of the largest ones did well last year. We don't always see this with high-dividend ETFs since the approach leans more toward poor-performing (and hence, high-yielding) Stocks. However, the weighted-average gain was 11.78%, so the result should be a decline in the ETF's expected dividend yield.
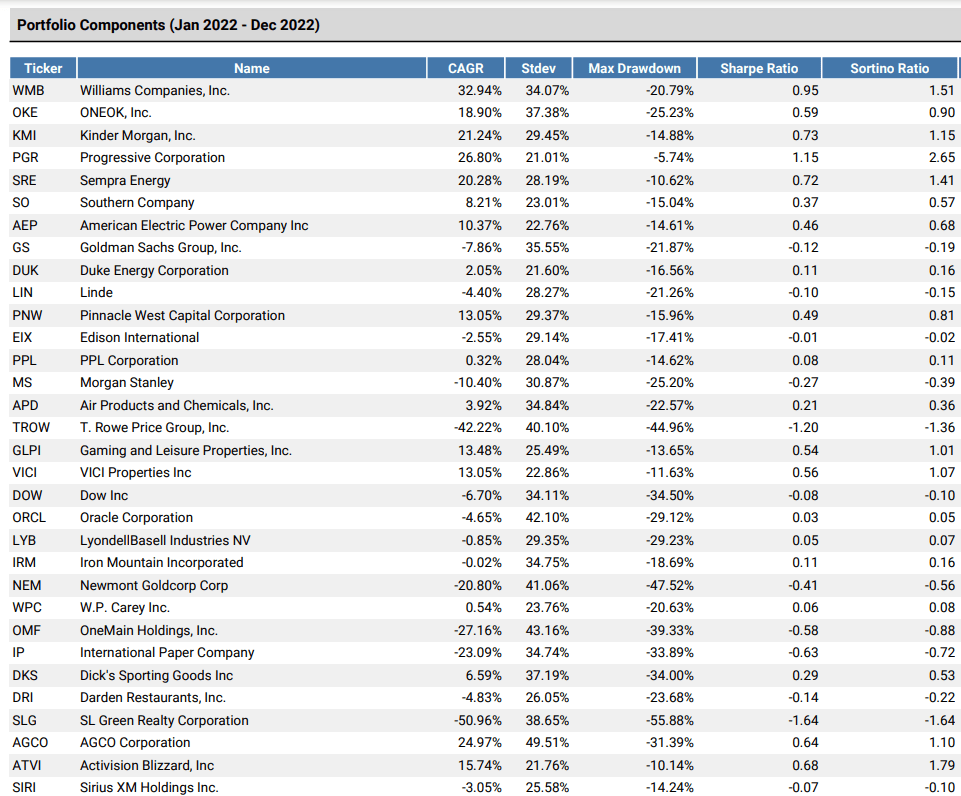
The top 30 deletions are listed below. They also did well in 2022, just not as well as the additions, gaining 7.01%. The most significant change was in Utilities, with companies like Sempra ( SRE ) and The Southern Company ( SO ) removed. I don't have an issue with these changes, as the sector no longer offers good value. Other funds, like the Invesco High Yield Equity Dividend Achievers ETF ( PEY ), continue to have high exposure to this sector, which is problematic .
FDVV Analysis
Performance
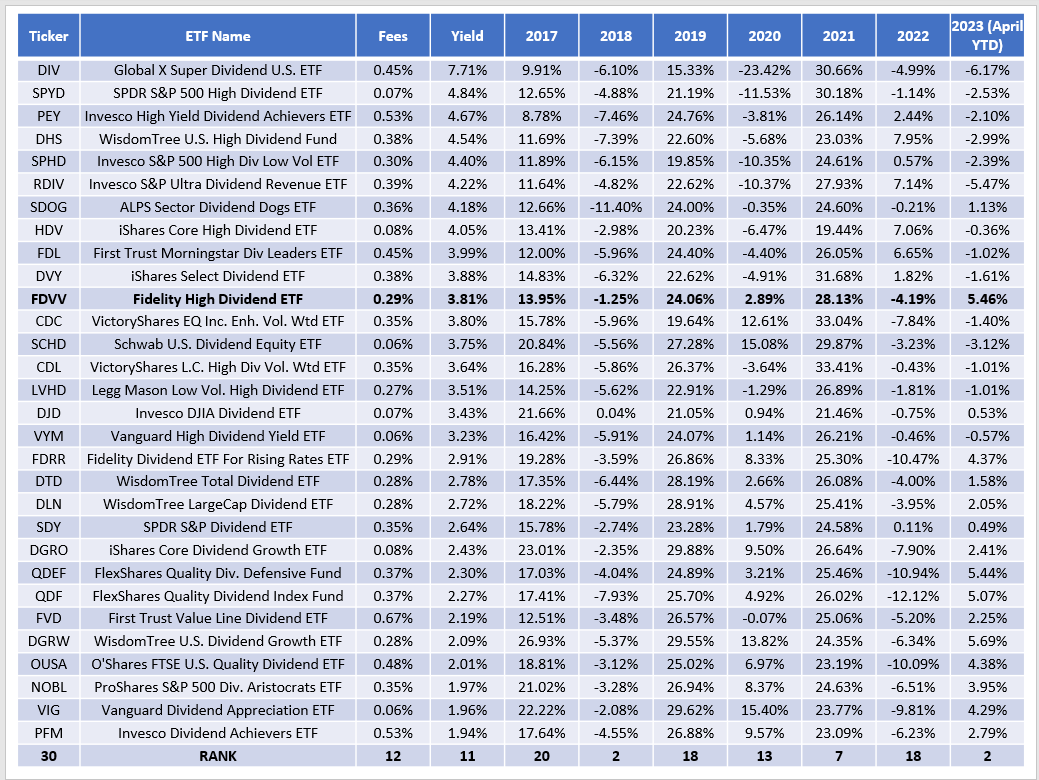
FDVV is a moderately consistent performer that has never ranked near the bottom quartile of its dividend ETF peer group. To illustrate, consider the following annual returns table for FDVV and 29 dividend ETFs, selected based on assets under management and market capitalization. FDVV's worst years were in 2017, 2019, and 2022, but even then, it ranked #20/30, #18/30, and #20/30. It also ranked #2/30 in 2018 and 2023 YTD, so it has demonstrated a potential to outperform even leading dividend ETFs like SCHD, which is struggling this year because of its low-growth profile.
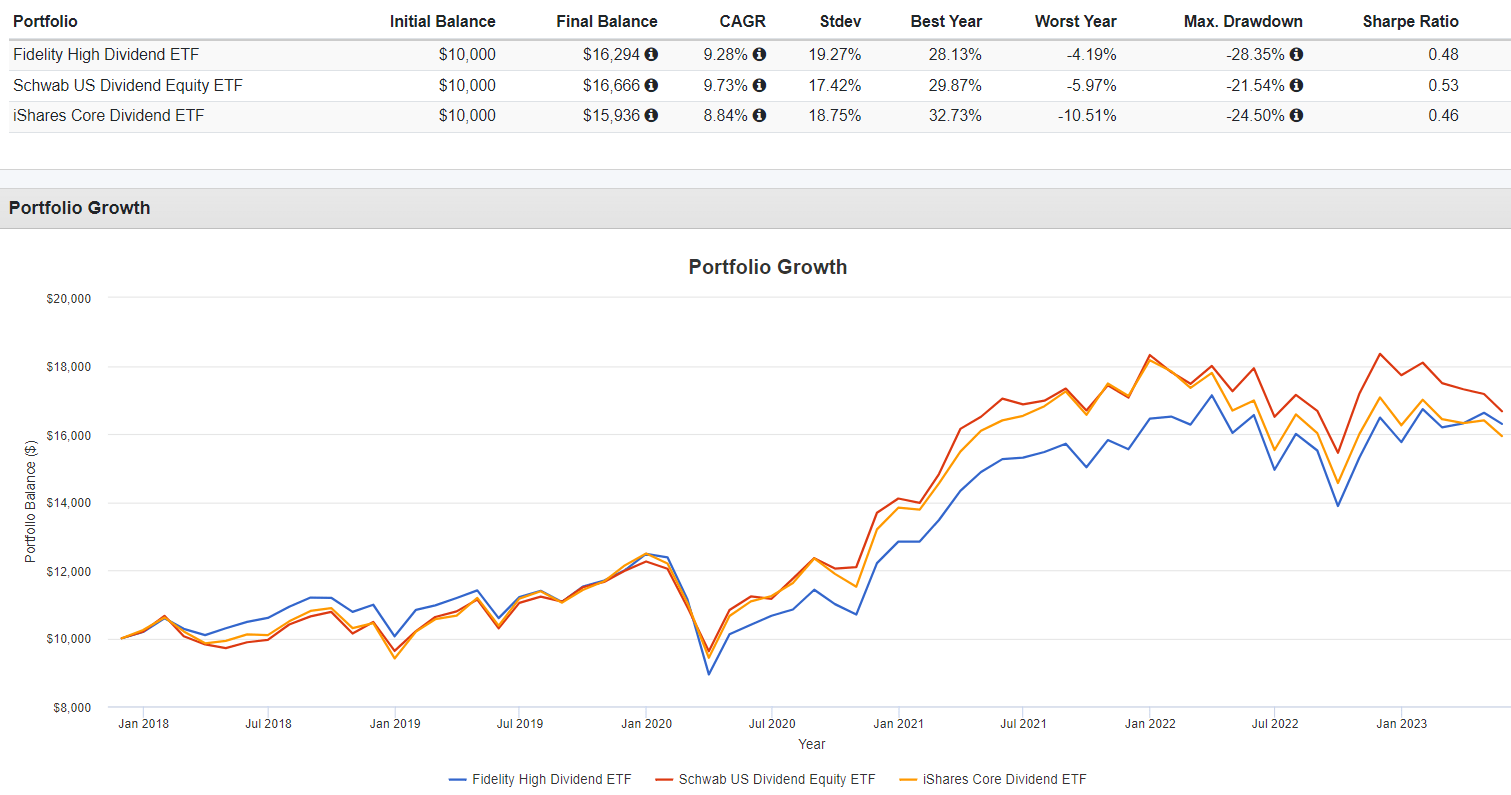
Against SCHD and DIVB, FDVV gained a respectable 9.28% per year since its inception date. SCHD outperformed by 0.45%, while DIVB lagged by 0.44%. However, as mentioned earlier, DIVB's strategy changed in December and is now considered a high-yield dividend fund.
Fundamentals By Company
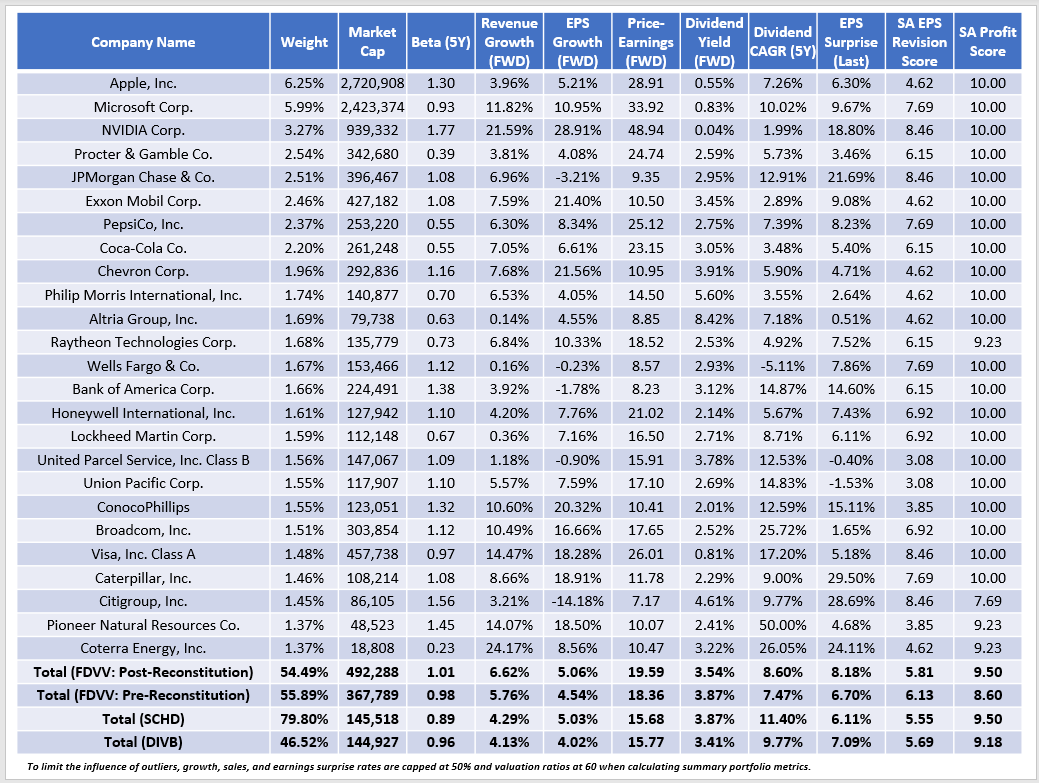
The following table highlights selected fundamental metrics for FDVV's top 25 holdings. I also included summary metrics for SCHD, DIVB, and FDVV's pre-reconstitution portfolio in the final rows.
Here are my observations:
1. FDVV's gross dividend yield decreased from 3.87% to 3.54%. After deducting the ETF's 0.29% expense ratio, shareholders should net approximately 3.25% at current prices. Meanwhile, SCHD and DIVB should net 3.81% and 3.36%. Current constituents have a slightly stronger five-year dividend growth rate (8.60% vs. 7.47%), but this will not offset the lower yield. Shareholders should expect low or negative dividend growth this year.
2. FDVV's profitability score jumped from 8.60/10 to 9.50/10, primarily because it eliminated exposure to Utilities. The score aligns with SCHD and should provide downside protection in a recession. While the 1.01 beta is still high for a dividend ETF, FDVV is better diversified, with 54% vs. 80% of assets in its top 25 holdings.
3. FDVV trades at 19.59x forward earnings, elevated when considering its estimated earnings growth rate is just 5.06%. However, its 6.62% estimated sales growth rate is solid and about 2.5% ahead of SCHD and DIVB. You can find better growth rates with lower-yielding dividend ETFs like the Vanguard Dividend Appreciation ETF ( VIG ), reviewed here. However, getting above 3% in this market is only possible by sacrificing capital appreciation potential.
4. FDVV's increased focus on mega-caps might prove beneficial, as this segment had a reasonably good Q1 2023 earnings season. The only top 25 holding to miss analyst estimates was United Parcel Service ( UPS ), with management citing changing consumer behavior and warning about potential higher union wages and the potential for strikes. Overall, FDV's constituents surprised to the upside by 8.18% on a weighted average basis, 1-2% better than SCHD and DIVB and slightly better than the SPDR S&P 500 Trust ETF ( SPY ).
Investment Recommendation
FDVV is having a good year, and it looks attractive if you're looking to blend quality, income, and solid capital appreciation potential. That is the type of investor I had in mind when I decided to upgrade my rating from a hold to a buy. I have some reservations about its 19.59x forward earnings valuation. Still, FDVV delivered good results in Q1, and I'm encouraged by the ETF's profitability score and how it has never ranked in the bottom quartile of its dividend peer group in seven years. I hope you enjoyed this analysis, and I look forward to answering any questions you may have in the comments section below.
For further details see:
FDVV: Shrinking 3.25% Dividend Yield, But An Optimistic Outlook