IEF - Fed May Cut Rates By Late Summer On Falling Inflation
2023-05-10 21:09:15 ET
Summary
- The Fed still says they plan to hold rates high for 2023. They may need to update that view.
- That's because they believe inflation will be slow to decline to 2%. That view may prove false.
- Inflation should fall rapidly for two fairly simple reasons (base rates and housing).
- Macro risks remain, but this is incrementally bullish both for stocks and maybe bonds into the summer.
There's likely a pretty attractive setup for inflation and hence interest rates over the coming 3 months, and it's based more on two simple statistics than overly elaborate economic forecasts.
On May 3, the Fed raised rates 0.25% for the third time in 2023 as inflation runs at 5% annually as of March CPI data, compared to the Fed's 2% target. There was no talk of cutting rates.
The Fed is understandably reluctant to talk about cutting rates while inflation remains above target and the job market tight. However, the inflation figures will likely change materially over the next 3 months, enabling the Fed to cut rates. The reasons are due to two things: base effects and home price trends.
Base effects simply means a lot of 2022's high inflation will drop out of the series over the coming months. Home price trends matter because they are the largest component of the inflation series. Home prices now appear to be declining from peak levels, but the CPI series hasn't fully picked this up yet due to statistical lags.
Base Effects
Inflation is a relatively unusual economic series in that it is an annual rate of change. It measures how much prices have changed on a 12-month view. So it's not like measuring your weight, but rather like measuring the change in your weight over the past year.
This means that the data that is dropping out of the series each month are just as important as the new data that's coming in.
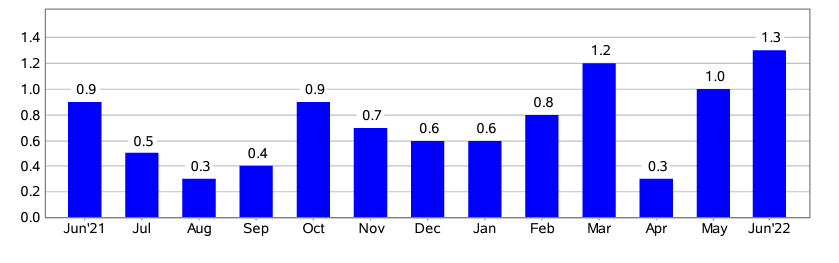
CPI-U month-on-month percentage change June 2021 to June 2022 (BLS)
This matters because back in May and June 2022 prices were running very hot. This suggests that around 2% of annual inflation will drop out of the inflation numbers with the June 2023 CPI report on July 12. That could put the annual inflation rate at around 3% compared to just under 5% currently.
Of course, we don't know what the 2023 numbers to replace them will be, but it's a fair bet they will be materially lower. Those should come in somewhere between 0.1% and 0.3% month-on-month based on what we're seen in the CPI series over recent months of 2023 and recent nowcasts , and current energy price trends. Hence inflation may drop by roughly 2% over May and June's CPI figures. This should occur as some of the inflationary spike from the corresponding period in 2022 drops out of the data.
Further Analysis of April Numbers
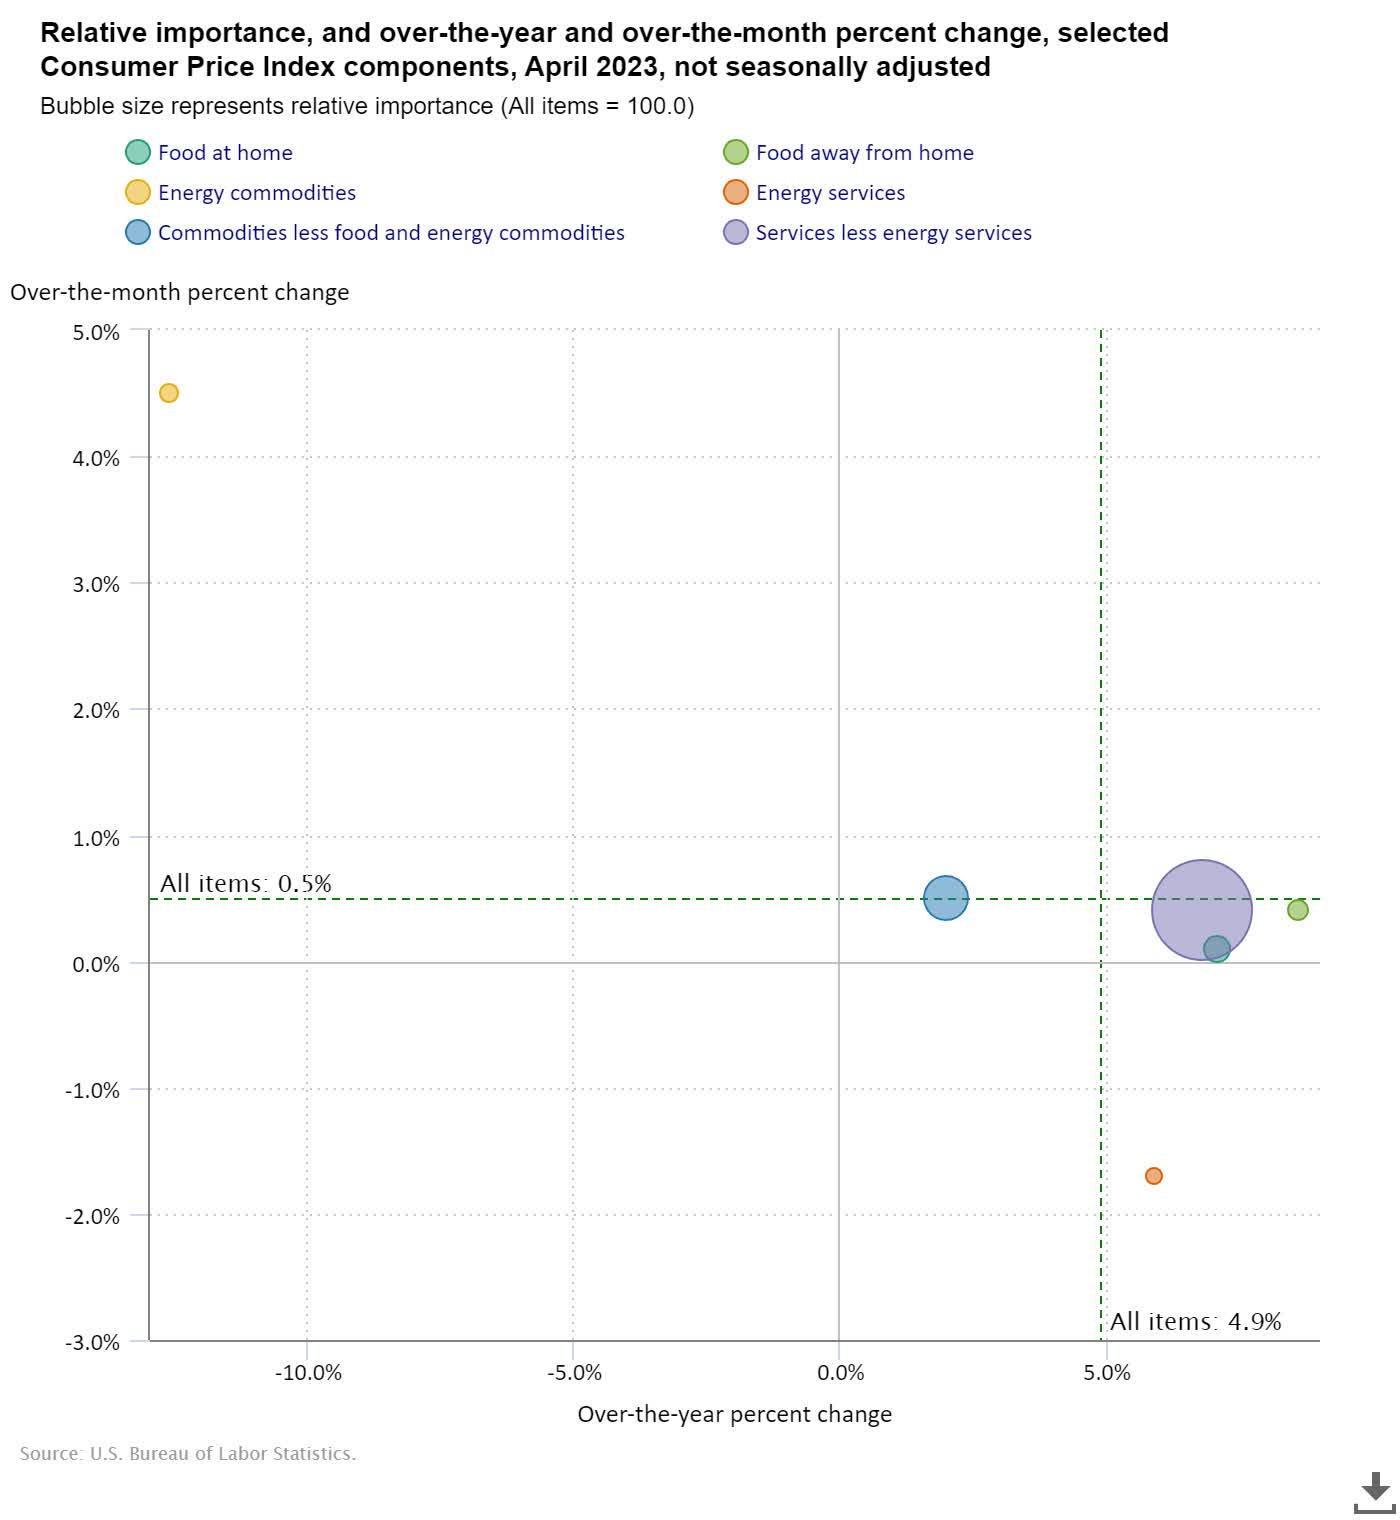
As another way to make the point here's CPI data for April. Bubble size is the relative weight and the y-axis shows the inflation weight for that category. The x-axis is the year-over-year move. Two things stick out about this analysis of the April numbers.
1. Energy prices spiked in April, that bought up inflation, but we now know (at least as of current energy prices) that the move was temporary.
2. Services less energy services is the biggest bubble, hence largest weight. That's basically housing costs (and rental costs for housing). That's trended lower over recent months and should have further to fall. That will drag the index lower since it's a very large component of the index.
CPI weights and movements for April 2023 (month-on-month) (Bureau of Labor Statistics)
It's All About Housing
A major piece of the inflation puzzle is housing. Shelter costs (as the CPI report terms it) make up 58% of the CPI in terms of relative importance. These costs are up 8.2% year-on-year. So housing is driving almost all of the increase in the CPI currently since 8.1% x 58% = 4.7% when the CPI is up 4.9% over the past year. So it's really all "shelter cost" inflation at this point, with other prices broadly flat in aggregate. The Fed fight against inflation is really becoming a crusade against the housing market at this point.
There's honestly a bit of a problem with the way the CPI reports shelter cost inflation. They use a 6-month panel approach , which means they average out trends from the past half year to look at a broader set of houses to form a more accurate assessment of housing costs. That obviously introduces a lag in the CPI series, since some of the data used is 6-months old. At turning points in the cycle, that's a big problem.
Guess what? We're at a turning point in the housing cycle. Pick your house price metric of choice whether Zillow, Redfin or Case-Shiller and you will see that home prices in the U.S. peaked last summer, since then they have been falling, and now they are just starting to decline in year-over-year numbers. They have actually rebounded a little in early 2023 on some recent numbers, but still the overall trend is down.
That house price move is not controversial, only the CPI series shows a weird estimate of housing costs. Below is the rate of change in home prices according to Case-Shiller year-on-year figures showing prices basically flat year-on-year having peaked last summer (now remember the latest CPI figures have shelter costs up 8.1% year-on-year).
Once the CPI shelter series catches up with what house prices are actually doing, then those prices, which remember make up the majority of the CPI weighting, will decline. That should occur at some point over the summer. That will cause inflation to fall materially. It appears to be happening now to some degree, April CPI had shelter costs up +0.4% month-on-month, that's lower than recent months.
Falling Inflation
By June's inflation report, which we can expect in early July we should see around 2% historic inflation 'drop out' of the inflation series taking us from a 5% annual rate currently to closer to 3%. In addition as and when shelter costs start to decline, which can't be too far away, CPI should move even lower month by month. The combination of those two factors should return inflation to around the Fed's 2% goal. We'll receive the June 2022 CPI data on July 12, which is comfortably ahead of the Fed's July meeting later the same month.
Symmetry
Another way to think about the U.S. inflation picture simplistically, is that so far the rise and fall of inflation has been surprisingly symmetric so far. It took 15 months from inflation to rise from the Fed's target of 2% in March 2021, to peak levels in June 2022. A similarly symmetrical decline could have inflation back to 2% by roughly September 2023.
The Fed's Reaction
The Fed will meet to set rates on June 13-14, at that point they may still feel inflation is uncomfortably high or recent declines are just noise, since the Fed has been pretty cautious on inflation over recent meetings.
However, at the subsequent meeting on July 25-26, the inflation data could be around 3% and falling. There may even be talk of deflation. At that point, the Fed may be inclined to cut rates since it's hard to justify high rates to fight inflation when inflation is not high. If the Fed isn't cutting by then, unless they are doing something very unexpected, they will be setting up expectations that cuts are coming. Then there a three remaining meetings of 2023 during which the Fed can potentially cut rates while still keeping things fairly restrictive with rates over 4%.
Investment Implications
When the Fed starts cutting rates it is generally bullish for both stocks and bonds. Of course, stock and bond prices cannot be predicted with a single macro variable, but interest rates and inflation are perhaps the two most central elements to stock and bond valuations and if both are easing by mid-summer that may set up a more bullish environment for both bonds and equities.
Possible Trades
This suggests a bullish setup for stocks and longer-term bonds in June and July as the forecast decline in inflation starts to play out in the data and the Fed's comments and messaging react to it, ultimately leading to either a rate cut at the Fed's July meeting or the Fed signaling a significantly more dovish posture for rates in the second half of 2023.
That could support a move up in broad stock indices such as the S&P 500 ( SPY ) or the total U.S. market ( ITOT ) and a general decline in bond yields, which may be best captured through intermediate term bonds, such as the iShares 7-10 Year Treasury Bond ETF ( IEF ) or Vanguard Intermediate-Term Treasury ETF ( VGIT ). Of course the challenge with fixed income is some cuts are already implied in fixed income futures, specifically 0.75% of rate cuts are expected by December 2023. However, historically with the exception of maybe the 1980s when the Fed cut rates it's basically a one-way journey and can happen fairly fast.
Risks
- Though shelter costs falling in CPI appears likely to happen, we don't exactly when it will occur, the summer seems a reasonable bet, but it could occur later and further supply shocks are possible.
- Other trends, such as surge in energy costs may offset inflation declines, though we're seeing the reverse currently.
- When considering government bonds the debt ceiling issue is likely to come to a head from now to early-June which may impact how U.S. government bonds and maybe stocks trade in early summer.
- Inflation and interest rates are key macro variables for stock and bond valuations. But other issues may prove more important such as a U.S. recession, which is certainly possible.
- Of course, this ultimately hinges on what the Fed will do and they may choose to do something completely unexpected.
For further details see:
Fed May Cut Rates By Late Summer On Falling Inflation