VEA - Fed Paper Suggests Future Real Returns Of 2% For U.S. Stocks
2023-07-25 13:30:00 ET
Summary
- A Federal Reserve report predicts future US stock market returns will likely not exceed 2%, the rate of GDP growth.
- The report attributes the impressive growth of the S&P 500 index from 1989 to 2019 to declining interest rates and corporate tax rates, which boosted corporate profits.
- I suggest that these factors are unlikely to continue, implying lower stock returns in the future, and question whether international stocks may offer superior returns.
(This article was co-produced with Hoya Capital Real Estate.)
Real longer-run stock returns [for the U.S. stock market] in the future are likely to be no higher than about 2 percent, the rate of GDP growth.
This is the dramatic conclusion of a recently-released paper by Michael Smolyansky , published under the Economic Research section of the Federal Reserve website.
In this article I will attempt to briefly, yet comprehensively, summarize the findings in this roughly 20-page document, as well as the implications for investors in U.S. stocks. I will also briefly address a related question that came to my mind, namely: Might the logic laid out in this article imply that foreign stocks will outperform their U.S. counterparts over the foreseeable future, making them a superior investment opportunity?
Underlying Thesis and Novel Approach
The author begins by featuring that, from 1989 to 2019, the S&P 500 index grew at an impressive real rate of 5.5 percent per year, excluding dividends. (NOTE: See here for a discussion of the difference between nominal and real rates of return.) Over this same period, the rate of U.S. real GDP growth was 2.5 percent. Over that roughly 30-year span, then, the real return from U.S. stocks outpaced GDP growth by some 3 percent, or more than twice the rate of GDP growth.
The question becomes; What accounts for this enormous discrepancy, and is it sustainable?
The author notes that this is far from the first time that this question has been addressed. For example, Mehra and Prescott noted in 1985 that the historical equity premium—usually about 6 to 7 percent per annum—is significantly higher than could be justified theoretically. Later literature tended to offer risk-based explanations in an attempt to reconcile the discrepancy.
In 2002 Fama and French attributed the excess return on stocks to a decline in discount rates (expected future returns). Based on this, they argued that historical earnings and dividend growth provide good estimates of expected long-term stock returns. More recent work by Greenwald, Lettau, and Ludvigson (2022) argued that reallocation of rewards away from labor compensation and towards shareholders was the dominant driver for these results.
With this background, we come to the crux of Smolyansky’s novel contribution to the discussion. Rather than attempting to reword it in any fashion, let me simply quote the key paragraph containing his explanation.
My central finding is that the 30-year period prior to the pandemic was exceptional. During these years, both interest rates and corporate tax rates declined substantially. This had the mechanical effect of significantly boosting corporate profit growth. Specifically, I find that the reduction in interest and corporate tax rates was responsible for over 40 percent of the growth in real corporate profits from 1989 to 2019. Moreover, the decline in risk-free rates over this period explains the entirety of the expansion in price-to-earnings (P/E) multiples. Together, these two factors therefore account for the majority of this period’s exceptional stock market performance.
More important than simply explaining the past, the author argues that the boost to corporate profits and stock returns from declining interest and corporate tax rates is unlikely to continue, implying lower stock returns in the future.
Lastly, and perhaps most importantly, he states the belief that the risks to his forecast are, if anything, to the downside .
With that overview, let’s now get into some of the details supporting the thesis.
Factor 1: Declining Corporate Interest Rates
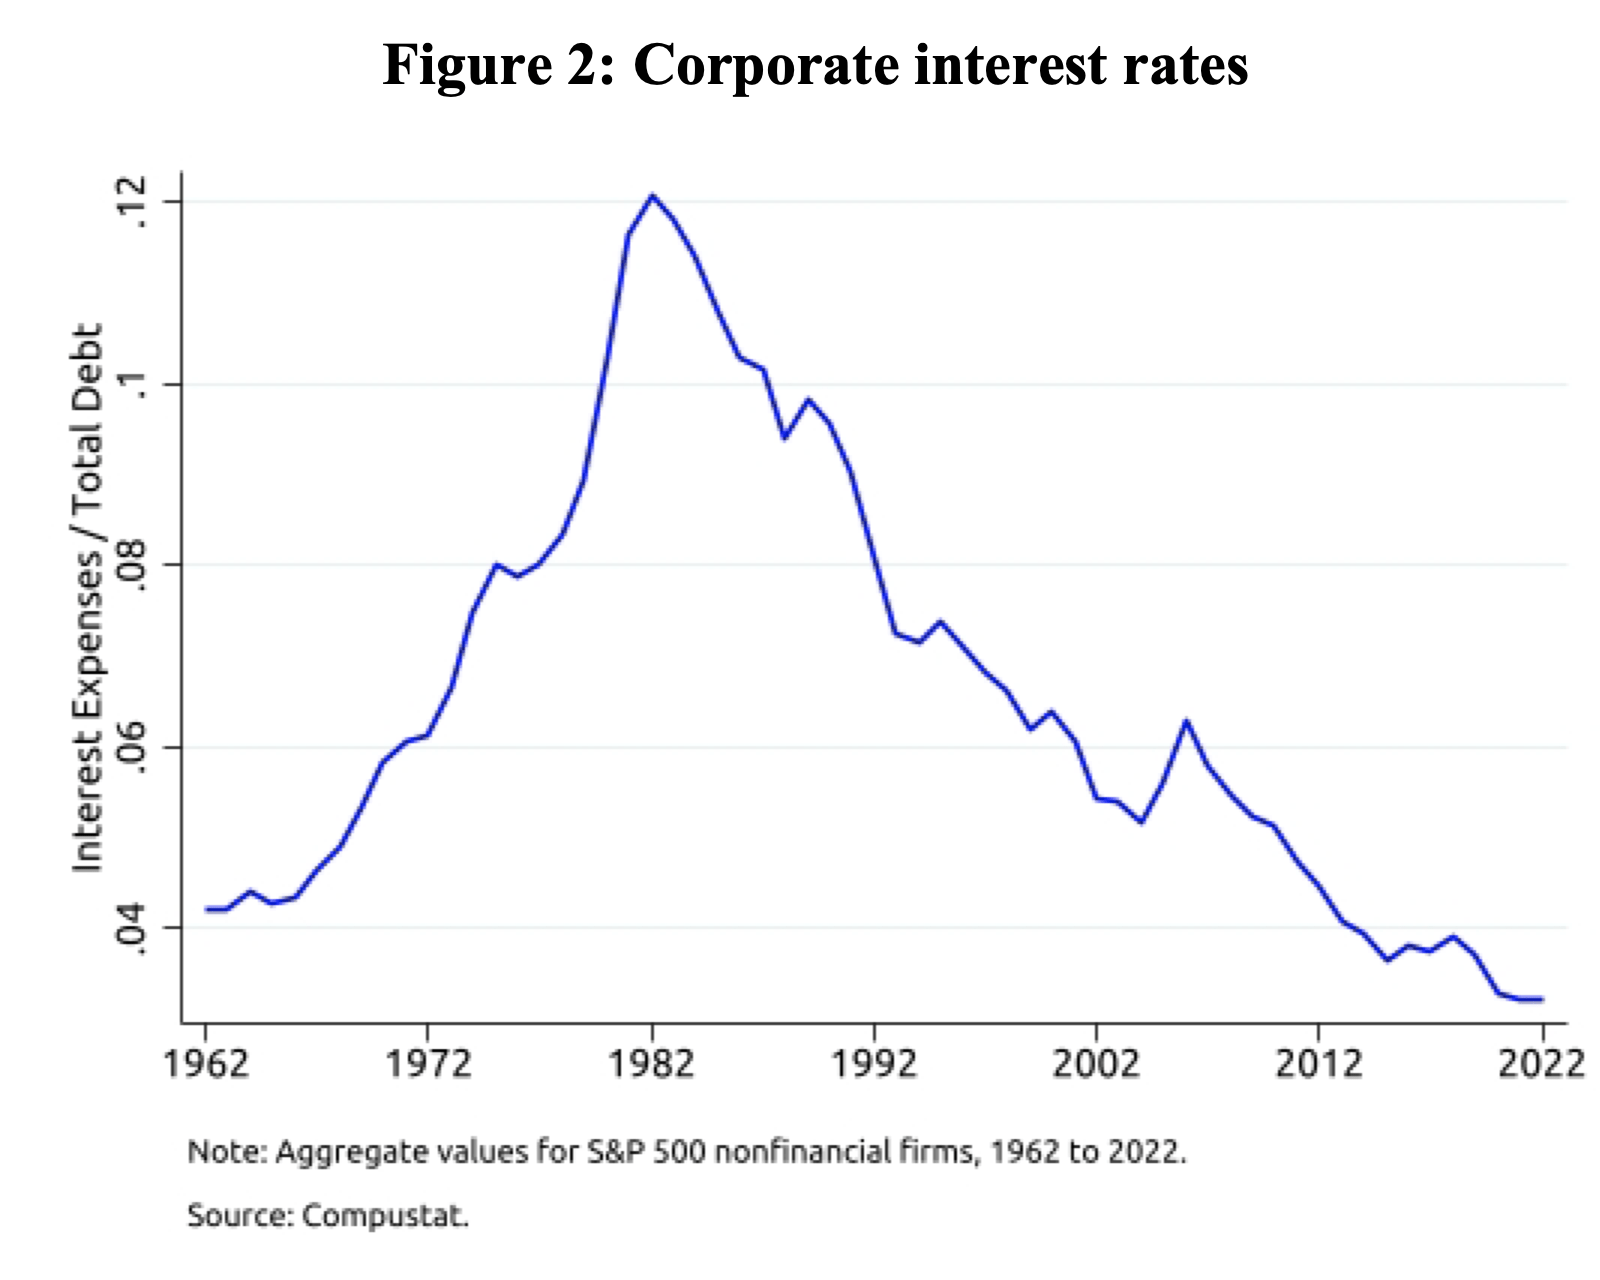
As shown in the below graphic, in 1989 interest rates faced by S&P 500 nonfinancial firms—as measured by the ratio of aggregate interest expenses to aggregate debt—stood at roughly 10 percent. By the end of 2019, before the COVID-19 pandemic, this had fallen to the vicinity of 3.7 percent. During the pandemic, by 2022, this measure fell even further, to 3.2 percent.
Historical Corporate Interest Rates (Smolyansky White Paper - Federal Reserve)
This significant decline allowed interest expenses to dramatically decline as a percentage of EBIT. Importantly, this allowed corporations to take on greater amounts of leverage. By 1989, corporate leverage stood at 35%.
Factor 2: Declining Corporate Income Tax Rates
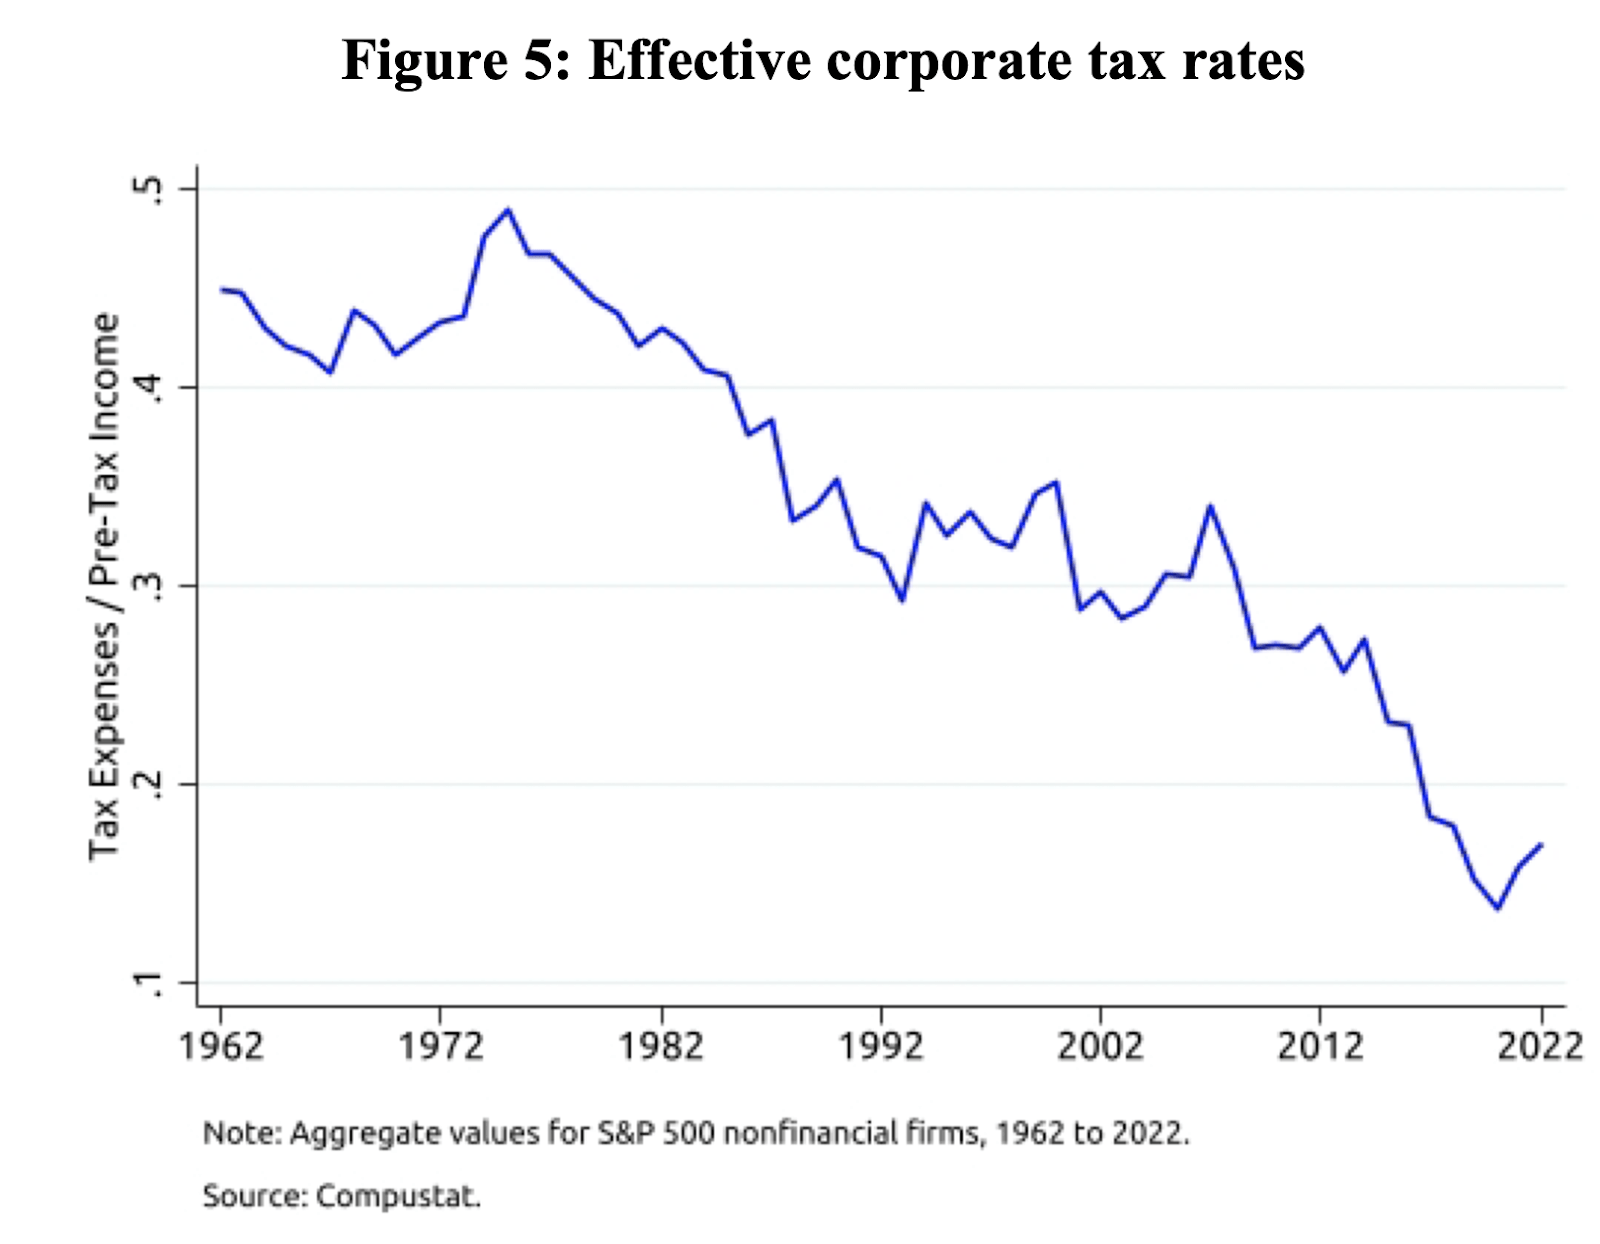
At the same time that interest rates were declining, so were effective corporate tax rates, defined as aggregate tax expenses divided by aggregate pre-tax income.
Interestingly, this decline started before the period of 1989 - 2019 considered in this study. During the Reagan administration, corporate tax rates began to fall from an average of 44 percent over the period from 1962 to 1982 to the level of 34 percent as we reach 1989.
Effective Corporate Tax Rates (Smolyansky White Paper - Federal Reserve)
From that point, effective corporate tax rates remained relatively even, averaging 32 percent over the period from 1989 - 2007. From there they drifted slightly lower until the next dramatic development, the passage of the Tax Cuts and Jobs Act of 2017, which cut the statutory corporate tax rate from 35 percent all the way to 21 percent. As a result, effective corporate tax rates had dropped all the way to 15 percent by 2019.
Effect On Corporate Profits and Stock Returns
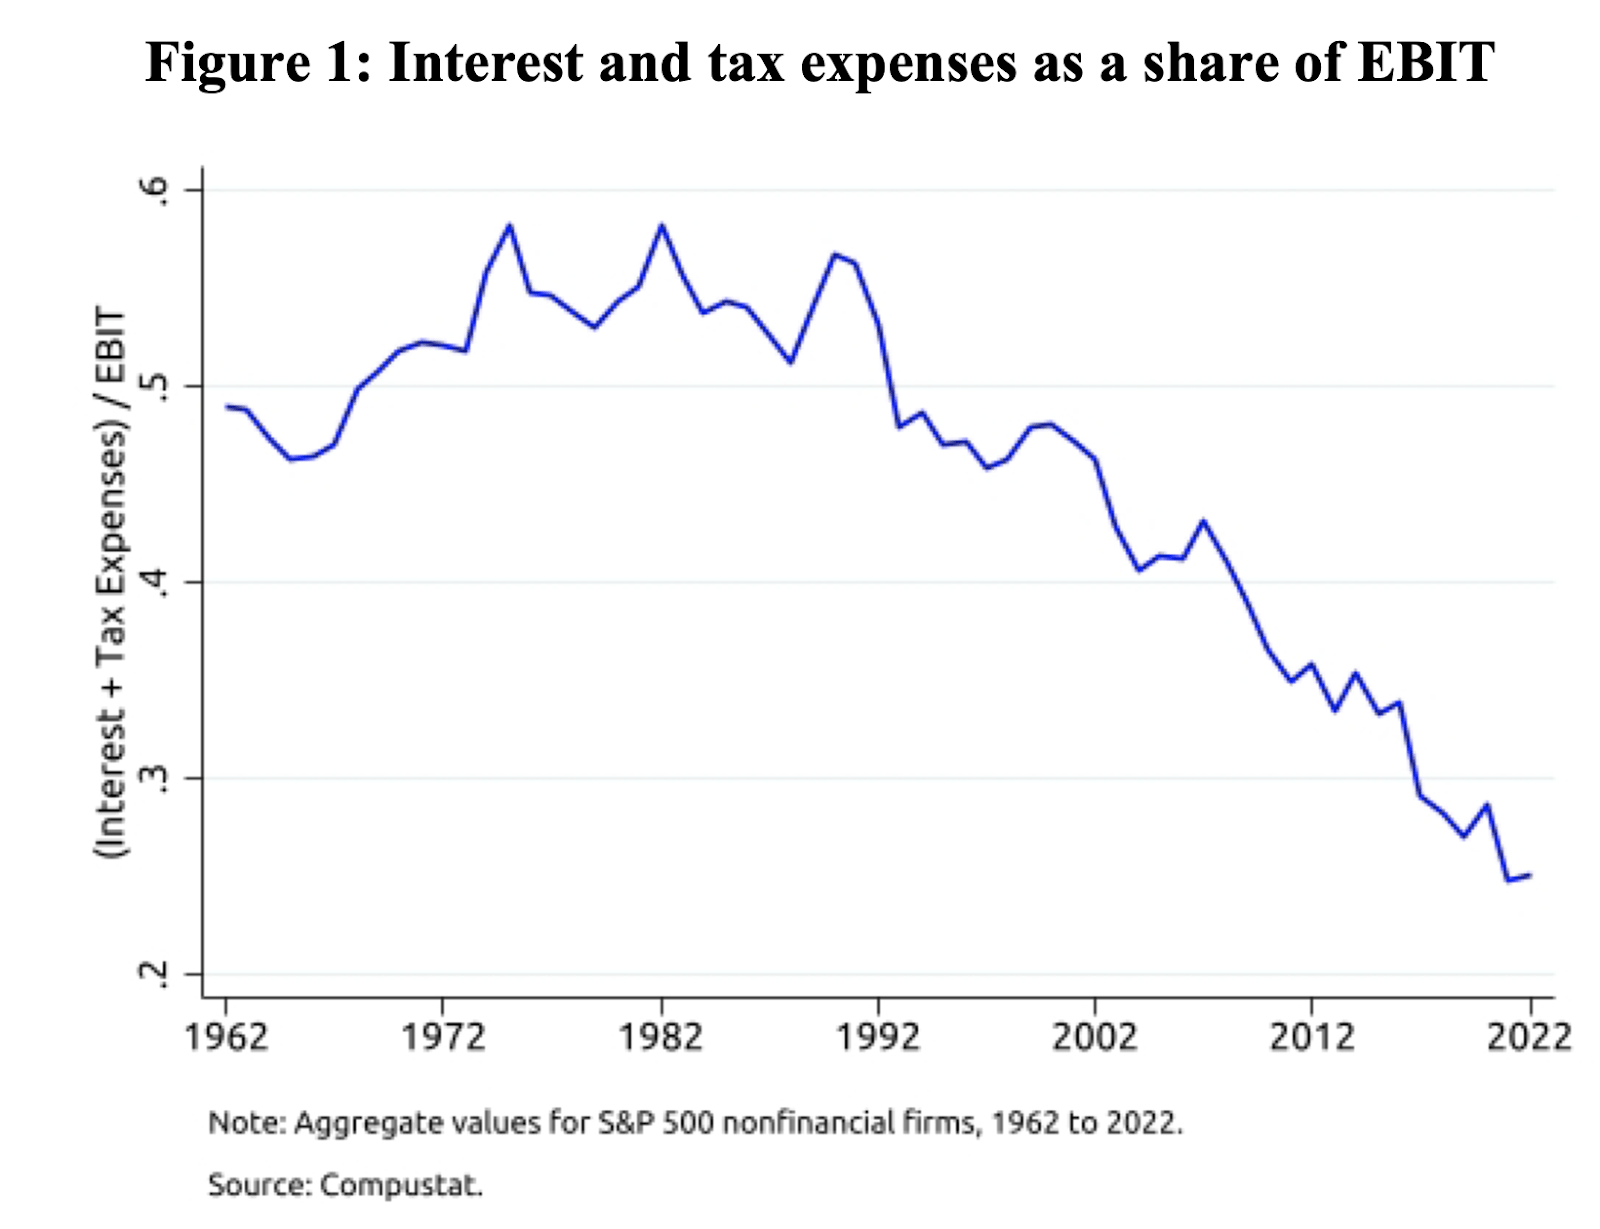
Taken together, these two factors were a key driver of corporate profit growth. In 1989, aggregate interest and tax expense consumed some 54 percent of corporate profits (EBIT). As a side note of interest, in the graphic below it can be seen that this level wasn't greatly different than the average going all the way back to 1962.
Interest & Tax Expense As A Share of EBIT (Smolyansky White Paper - Federal Reserve)
By 2019, however, this measure had been cut almost precisely in half, to 27 percent. Think about that for a minute. This demonstrates that, over this period, an ever-declining share of corporate earnings were paid to debt-holders and various tax authorities. That allowed an ever-greater share to be available to shareholders.
What was the result of all of this? Have a look at this next table.
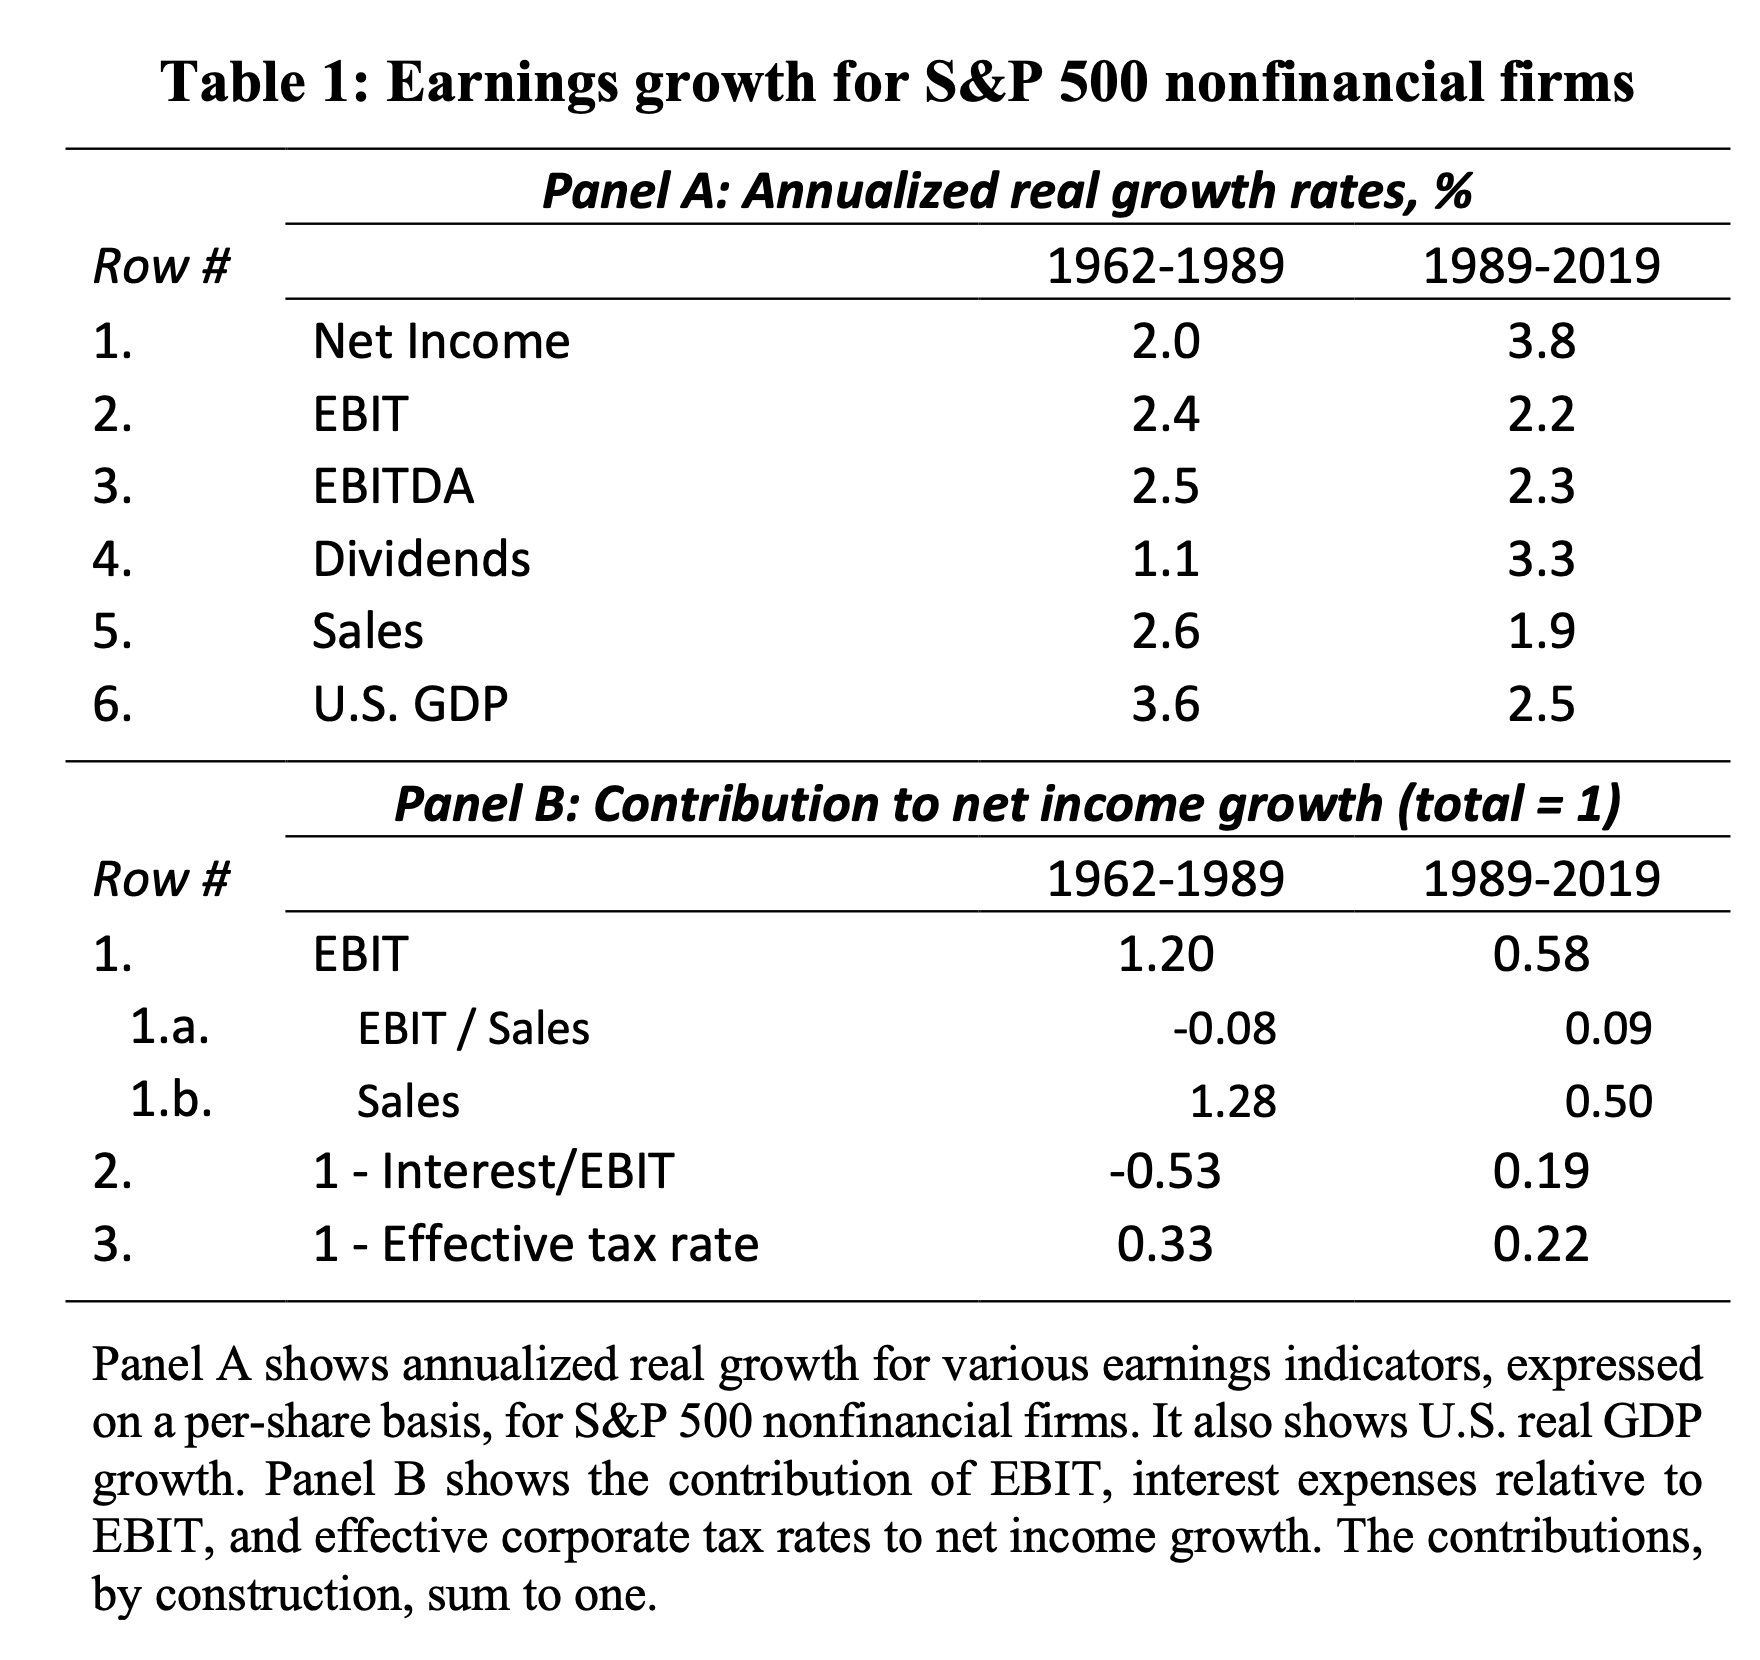
Earnings Growth - S&P Nonfinancial Firms (Smolyansky White Paper - Federal Reserve)
In the original article, the author explains each of the lines. For now, and to make the basic point, please simply consider rows 1-3 and 6 in Panel A. Row 1 shows that, from 1989 to 2019, real net income grew at an annualized rate of 3.8 percent, almost twice as fast as the period from 1962 to 1989. In contrast, look at rows 2, 3, and 6. Both EBIT and EBIDA, shown in rows 2 and 3, grew at about the same pace as the earlier period, and quite in line with GDP growth as shown in Row 6.
What was the effect if all of this on stock returns? Over the period from 1989 to 2019, the equity premium (the excess return of stocks over 3-month Treasury bills) was 7.2 percent on an annualized basis. This compares to 3.6 percent on an annualized basis during the period from 1962 to 1989.
As alluded to in the opening section of this article, previous literature had tended to explain the high realized equity premium as reflecting compensation for bearing risk. In contrast, the author argues that stock price volatility was lower during 1989 to 2019 than it was during 1962 to 1989. Instead, he argues that the simultaneous decline in interest and corporate tax rates can entirely explain this difference. Here is how he summarizes this argument.
Thus, stock price growth can come from: (1) an expansion in P/E multiples; (2) EBIT growth; (3) a decline in interest expenses relative to EBIT; or (4) a decline in the effective corporate tax rate. In other words, without a decline in relative interest expenses and corporate tax rates, and without an expansion in P/E multiples, stock prices can only grow by as much as EBIT.
Future Implications
Simply put, Smolansky states unequivocally that his outlook for stock price growth is bleak.
If one accepts the argument he presents, namely that the simultaneous decline in interest and corporate tax rates can entirely explain the dramatic increase in stock returns from 1989 to 2019, the only remaining question is: Where will interest and corporate tax rates go from here?
He believes that an optimistic outlook is that interest and corporate tax rates remain close to their 2019 levels. In this scenario, corporate profits could only grow by as much as EBIT. He further questions whether current stock pricing reflects an understanding of what he lays out in his analysis, and whether it can continue.
And with that, we have come full circle to the forecast that opened this article. Real longer-run stock returns [for the U.S. stock market] in the future are likely to be no higher than about 2 percent, the rate of GDP growth.
What About International Stocks?
To assure complete transparency, this is the point where my summary of the Smolansky article ends and my own research and opinion takes over.
For some time now, I have been advocating that investors maintain well-diversified portfolios. But further, that international equities may offer potential for superior returns compared to U.S. equities. As the most recent example of this, feel free to check out my recent review of Vanguard FTSE Developed Markets ETF ( VEA ), which I referred to as "quite possibly the sweet spot in equities."
After digesting and meditating on the Smolansky article, I couldn't help but wonder if his thesis might add to the arguments for investing in international stocks.
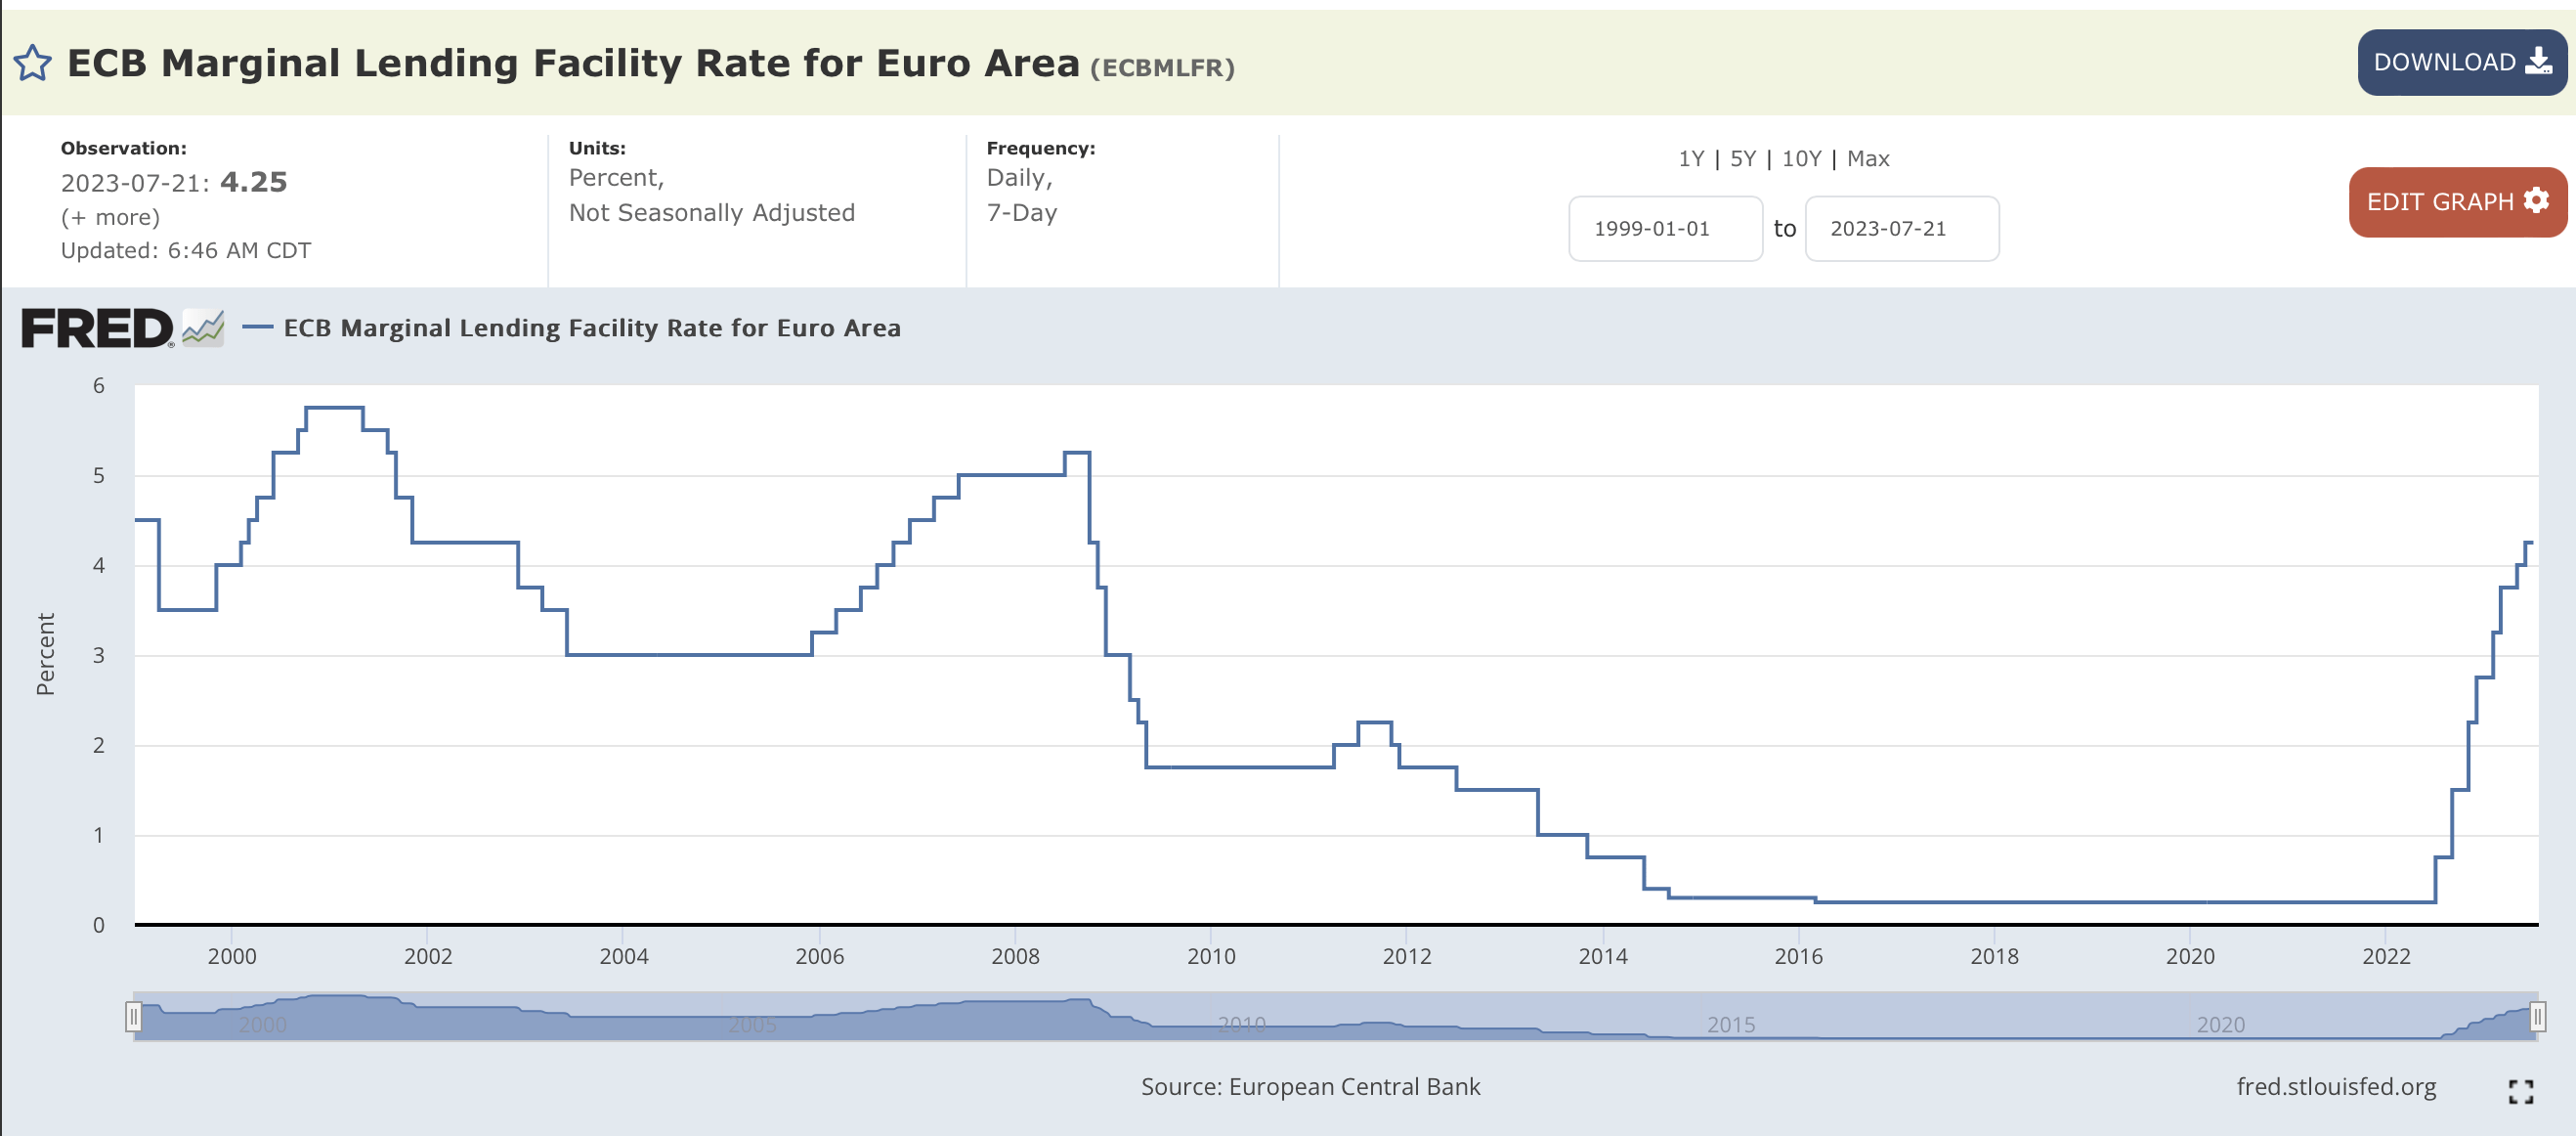
I started by trying to find some overall information on the trend of interest rates in Europe, to see how it compared with the U.S. I was able to find this very helpful graphic on FRED.
ECB Marginal Lending Facility Rate for Euro Area (FRED - St. Louis Fed)
Now, this graphic doesn't go quite as far back in time as the U.S. version from the Smolansky article featured in the "Factor 1" section above. But you can compare the path forward beginning in roughly the year 2000. Here is my takeaway: While the path doesn't track 100% exactly, the general trend in Europe is very similar to that of the U.S.
While I did not go to the next level of researching this for other countries, for example those in Asia, I suspect the answer would be at least somewhat similar.
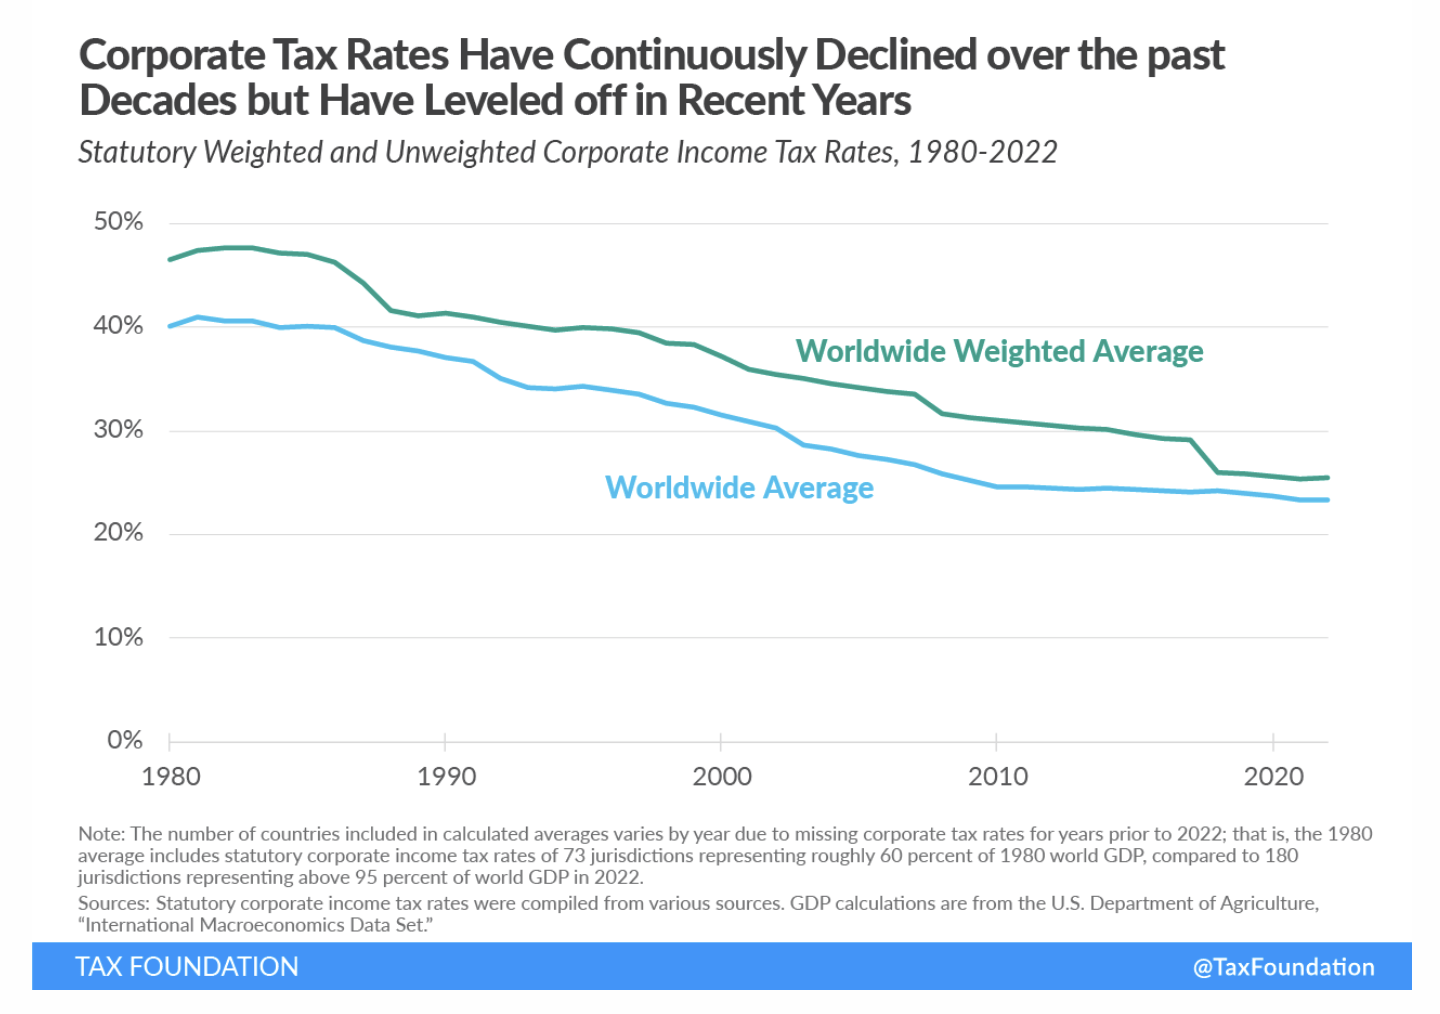
Next, let's turn to that second factor; that of corporate tax rates. With a little digging, I found a very helpful reference on tax rates around the world , on TaxFoundation.org. I will share two graphics that quickly summarize what I found.
First, here is a very helpful snapshot of the overall trend.
Corporate Tax Rates - Worldwide Trend (Tax Foundation)
As can quickly be seen, the overall trend is a mirror of what has happened in the U.S.
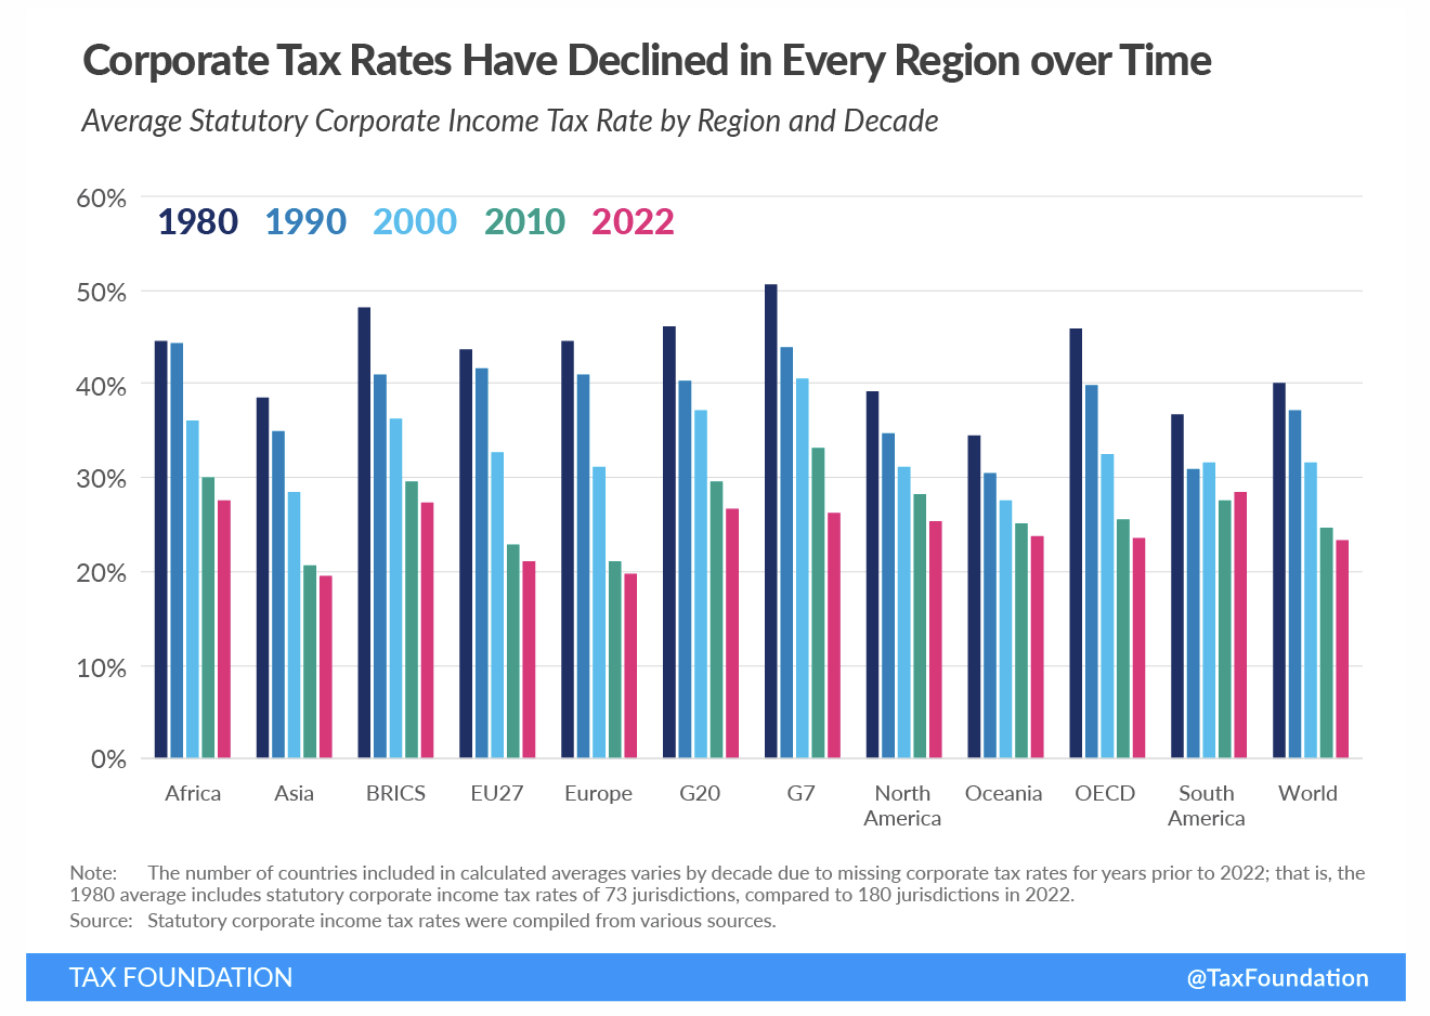
Going a little further, I found a second graphic that was even more helpful to me. This one breaks it down by region.
Corporate Tax Rates By Region (Tax Foundation)
Here's what I would like to feature. The fifth set of bars from the right represents North America. The rightmost set of bars represents the world as a whole. Do you see any significant difference? I don't.
Interestingly, then, the two factors Smolansky identifies appear to have been present both with respect to the U.S. as well as countries outside the U.S. So my conclusion is that, in and of themselves , these factors do not necessarily argue a differentiation between U.S. and foreign stocks.
However, the stock market returns have not been anywhere near the same. In the below graphic, I compare the performance of Vanguard Total Stock Market Index Fund ( VTSAX ) and Vanguard Total Intl Stock Index Fund ( VGTSX ) over the period from 1989 to the present.
As can be seen, over this long arc of time, returns on international stocks have substantially underperformed their U.S. counterparts. Interestingly, it would not appear that declining interest and corporate tax rates have supercharged the returns from international stocks to the same extent that they have from U.S. stocks. At the same time, it would appear that, going forward, international stocks may face the same headwinds (flat or rising interest and corporate tax rates) as their U.S. counterparts.
However, to the extent that their returns to-date have been more muted, the headwinds experienced by international stocks might also be more muted. Since, as other analysis has shown, international stocks have lower valuations at present, it may still be the case that they will offer superior returns moving forward, at least for the foreseeable future.
Summary and Conclusion
First of all, for investors who have the time and interest, I recommend reading through the Smolansky paper for yourself. While I tried my best to synopsize it in a brief yet understandable fashion, there is a substantial level of supporting math and argumentation that is marvelously laid out in the original work.
As my summary and conclusion I will simply say that, if anything, my read through Smolansky's excellent work did nothing but reinforce the summary I shared in my most recent article summarizing the H1 2023 performance of the ETF Reliable Retirement Portfolio. Here is how I wrapped up this section.
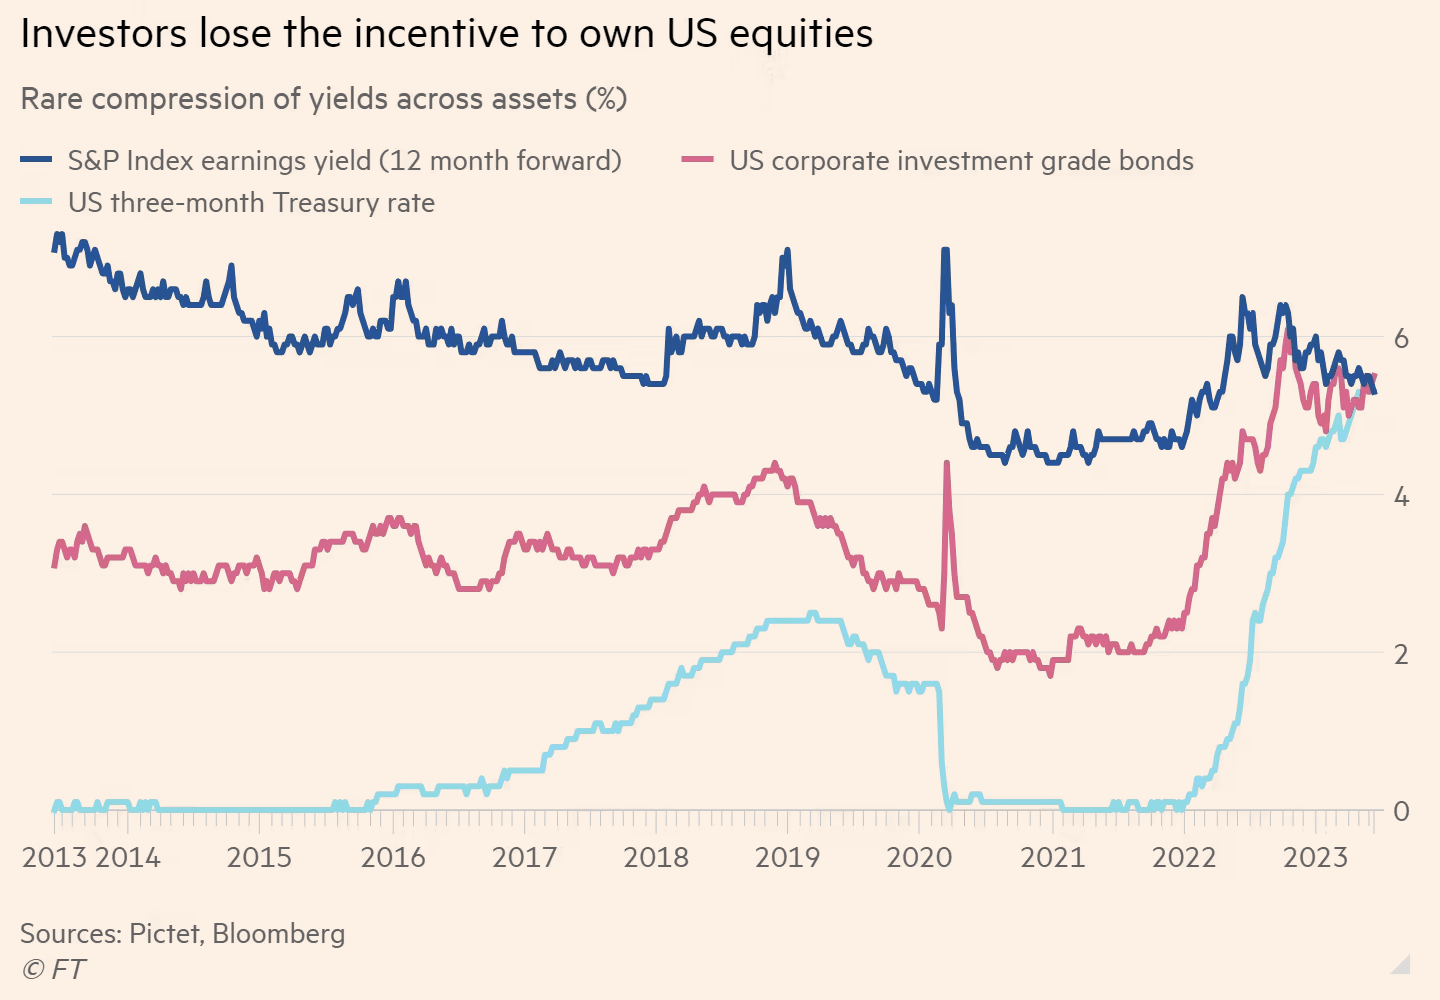
Where does that all leave us? Have a look at this recent graphic.
Yields on US Equities, Cash, and Bonds (Financial Times - Bloomberg)
Essentially, the yields on U.S. equities, cash, and bonds have arrived at a point where they are roughly equivalent at the present time. This may well serve as a headwind with respect to future stock returns.
As a result, my view for the second half of 2023 continues to be that investors-and in particular conservative investors-would do well to stay conservatively positioned and well-diversified .
What are some takeaways?
- Keep a reasonable portion of your portfolio in cash, in order to take advantage of opportunities which may present themselves.
- Decent returns are very likely to be had from bonds, with the best risk/reward profile coming at the short end of the duration spectrum.
- Foreign equities began to awake from slumber during the first half of 2023 and I believe this may well continue. Therefore, maintain a nice balance between global and U.S. equities.
Thank you for taking the time to read my article. I hope it has offered a perspective to consider. I'd love to hear from you in the comments below!
For further details see:
Fed Paper Suggests Future Real Returns Of 2% For U.S. Stocks