FHI - Federated Hermes: Good Candidate For Peak Rates Theme
2023-11-08 04:57:43 ET
Summary
- Federated Hermes' share price dropped 30% since April due to insider sales and removal from the Russell indices.
- Three different valuation models indicate upside between 10-20% which is appealing but not our ideal margin of safety.
- Further upside likely as interest rates stabilize: FHI is a sound candidate to play the macro theme of peaking rates.
- We rate FHI stock a hold at current levels.
Editor's note: Seeking Alpha is proud to welcome FactorRank Analysis as a new contributor. It's easy to become a Seeking Alpha contributor and earn money for your best investment ideas. Active contributors also get free access to SA Premium. Click here to find out more »
Overview
Federated Hermes ( FHI ) is a mid-sized asset manager of equities and fixed income, and a major player (#6) in the US money market.
Their share price peaked in April but then dropped 30% before bouncing off its lows. In our view the selloff was a justified response to insider sales, which then intensified after their removal from the Russell indices. But we argue in this report that these issues are temporary, barring some hidden risk signalled by insider sales.
The three different valuation models we look at for this analysis indicate upside potential between 10-20%. However, this is not our ideal margin of safety and we would wait for a price around $30.00 to start scaling into a position.
That said, we do anticipate strong upside for FHI in a macro backdrop of stabilizing interest rates. FHI's strength in money markets positions it as a primary beneficiary of a 'higher-for-longer' rates environment, and we consider them to be a sound option to play the macro theme of peaking rates.
We rate FHI a HOLD at current levels but recommend it as a watchlist addition.
FHI Snapshot
Federated Hermes Inc is a ~$3B market cap asset manager with $715B AUM across equities, fixed income, and money market funds.
Whilst being a mid-sized manager of equities and fixed income ($74B / $91B AUM), they are a major player in money market funds with $527B AUM giving them a 7% market share . This focus provides a more defensive posture than their peers, limiting 24-month beta to 0.82.
FHI generates almost half its revenues (46%) from money market assets, and 30% from equities. The remaining revenues are split across fixed income and alternatives (company data).
Steady Earnings Update
FHI reported earnings on Oct 27. Total assets under management were up an impressive 14% yoy, and they beat on both the top and bottom lines. Lift the covers though and the underlying picture is a little more mixed.
The majority of AUM increase is from money market funds which are now sitting at record highs and likely to increase further in an environment of plateauing rates.
However, fees from money market funds are lower than equities, and FHI reported continued outflows from both equity funds and equity-focussed SMAs. Of some concern is the run-rate of their reported $753m in redemptions for early Q4 which - if maintained - would translate into higher equity outflows than Q3.
Moreover, there are fee-mix concerns within equities, with fees generally lower for SMAs vs equity funds . Clients generally prefer an SMA structure over equity funds, as it provides look-through stock selection options and accompanying tax optimisation benefits that funds can't provide. This growth of SMAs is a global trend and will likely continue, making the fee impact on asset managers unrelenting. The challenge is to increase the SMA asset base at a faster rate than run-off of funds fees to minimize revenue impact during the transition. This is an area to monitor going forward.
So how did FHI beat in all three areas? Money markets driving AUM and revenue uplift, combined with solid cost control. Overall, a steady update with a few areas to monitor going forward. Analysts responded positively, with one ratings increase from hold to buy.
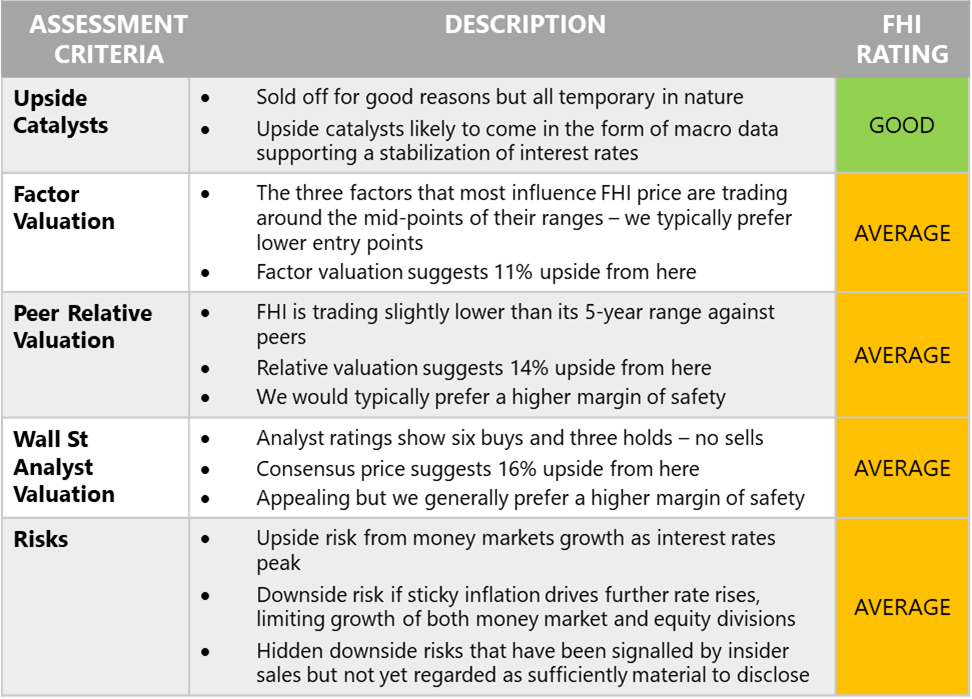
Summary of Investment Attractiveness
In our experience appealing investments score highly across five areas. We like candidates where both historical and forward-looking valuations combine to suggest a strong margin of safety, with clear upside catalysts, and low trade risks. For FHI we assign one 'Good' and four 'Average' scores, suggesting a 'Hold' at current levels.
Summary of Investment Attractiveness (FactorRank Analysis)
On the following pages we discuss reasons for the six-month selloff, then explore each of these five assessment criteria in detail.
Reasons For Selloff
FHI peaked at an all-time high in mid-April and has since dropped almost 30% while its sector peers fell half that and SPX remained largely flat. Why the selloff?
The starting trigger may well have been CEO John Christopher Donahue's massive sale of 868,000 shares, reported on 14 April. His selling continued into late May, by which time he'd sold down 1.3m shares, or 80% of his holdings. The Hermes CEO was also selling, as were most executives in the firm, albeit at much lower volumes. It goes without saying that this type of sustained selling is terrible for market confidence. One wonders if there are hidden risks yet to surface in the business, although nothing material was tabled in the two earnings calls since. Insiders now hold 3.2% of the company, down from 3.9% in the past six months.
Then in late June, index provider Russell removed FHI from their indices because the required public-shareholder voting percentage threshold was not met. FHI's B-Class shares are non-voting and Russell requires a 5% minimum voting threshold for inclusion in their indices. Despite FHI's claimed focus on ESG (the reason they bought into Hermes), management stated on the Q3 earnings call that they have no plans to change their Governance structure to get re-admission. That has certainly contributed to selling pressure.
Finally, FHI bond funds have been haemorrhaging flows (Q2/Q3 earnings calls) - particularly from shorter duration funds - as the values of existing holdings plummet with rising rates.
These are all sound reasons for a sell-off, but I would argue that each is temporary in nature, and barring a hidden material risk event, there are strong arguments that FHI is well-positioned for forward growth as rates stabilize.
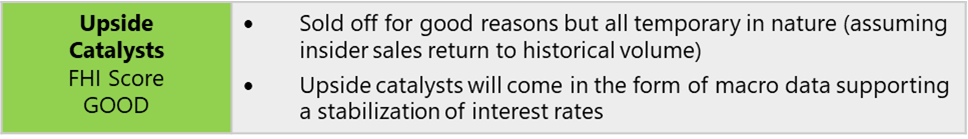
Upside Catalysts
Summary of Upside Catalysts (FactorRank Analysis)
FHI is a major player in money market funds with a market share of 7.3% . The exposure bodes well for growth in a 'higher-for-longer' (or 'high-but-falling-a-bit') rates environment. They will be a primary beneficiary of a world with stabilizing rates, and this is an excellent way to play that macro theme.
Management has stated that the most favourable environments for their money market funds is when rates start to level off and even begin to retreat, ideally within a 1-2% range of the peak (although not back to zero as fees are waived at this level). In these conditions, more investors are looking to extend duration and lock-in high interest rates 'while-they-last'. FHI management claim that on previous occasions when peak rates occurred they saw outsized growth at both the company and industry levels.
In addition, management reiterated their plan to look M&A consolidation opportunities of smaller money market funds, giving FHI even greater exposure to the sector.
On the fixed income side, short-duration bond fund outflows should steady/reverse as rates stabilize ( management has stated this is already starting to occur).
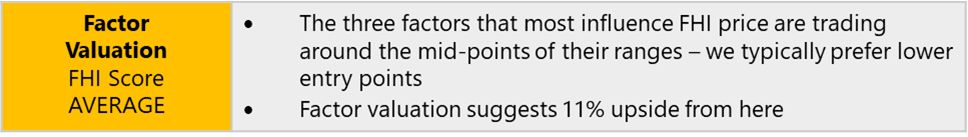
Factor Valuation
Factor Valuation Summary (FactorRank Analysis)
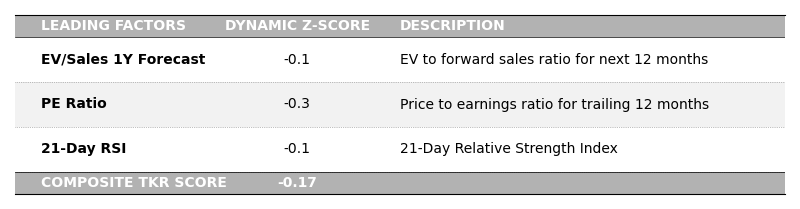
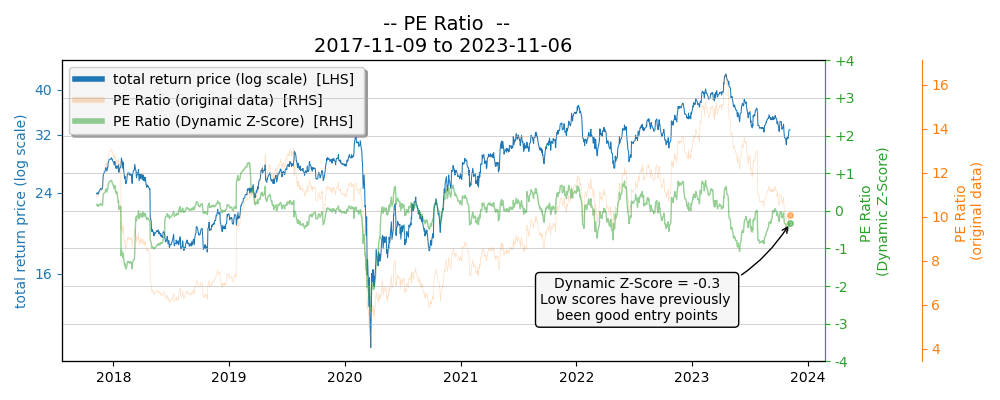
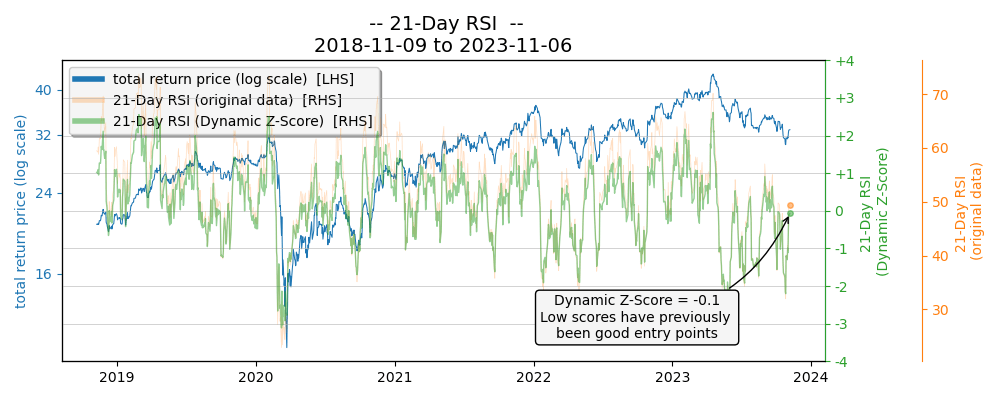
Factor analysis suggests FHI price is most influenced by three factors: two fundamental and one technical (see how we calculate these in the appendix).
Leading Factors (FactorRank Analysis)
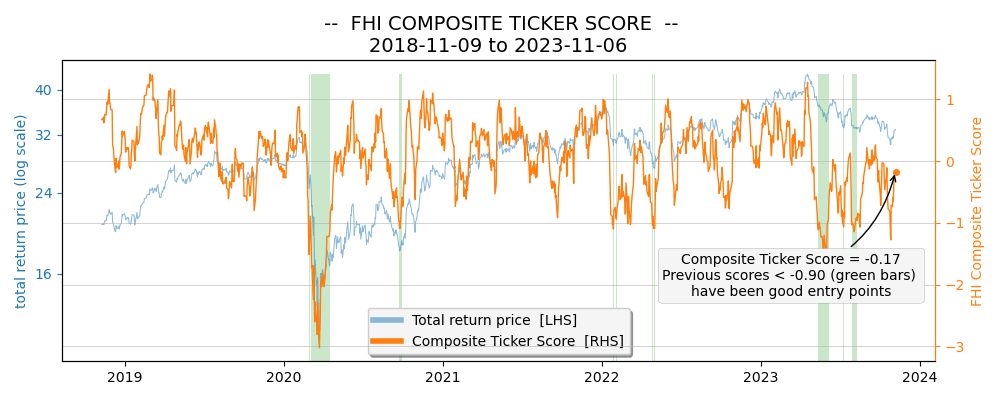
When these factors trade at Dynamic Z-Scores towards -1.0 they have previously shown to be good entry points (see individual charts in appendix). When combined them into a Composite Ticker Score (orange line below) we can see that previous scores at or below -0.90 (green bars) have been good points for trade entry. At time of writing we're sitting just below the mid-point of the range at -0.17: history suggests this is not an ideal entry point.
FHI Composite Ticker Score (FactorRank Analysis)
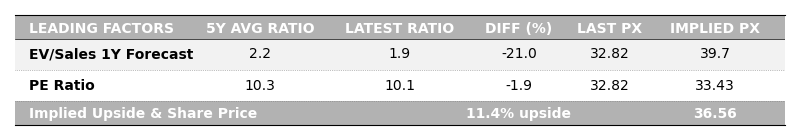
Assuming our two leading fundamental factors - EV/Sales and PE Ratios - return to their 5-year averages we calculate an implied share price of $36.56, or 11% potential upside from here.
Factor-Based Implied Share Price (FactorRank Analysis)
This upside is appealing but has limited margin of safety so we assign an 'average' score to this Factor Valuation analysis.
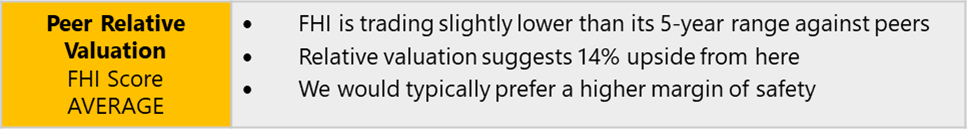
Relative Peer Valuation
Relative Valuation Summary (FactorRank)
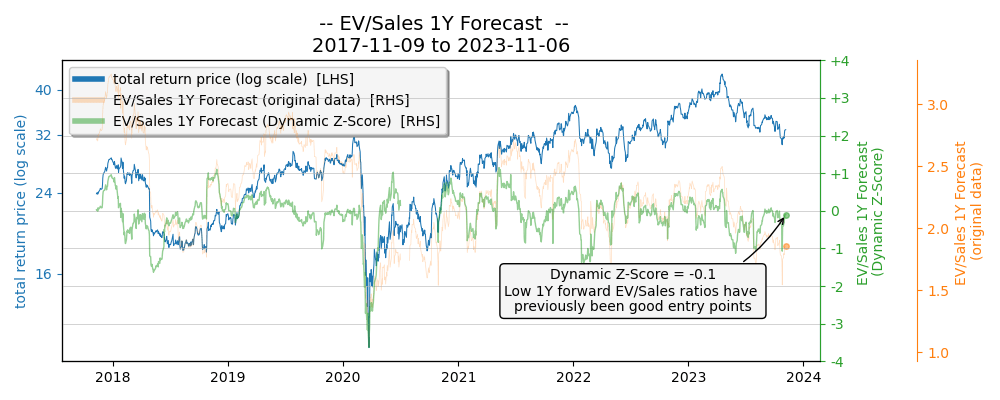
FHI is trading at the low end of its 5-year range relative to peers ( peer list in appendix). In this case, one of the metrics - 1Y forward EV/Sales - is also one of FHI's leading factors, which supports the upside case if we believe in a return to historical multiples.
Historical Range Chart
Historical Range Chart (FactorRank Analysis Based on Peer Company Data)
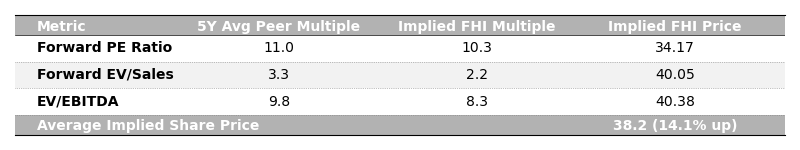
Given our view that the FHI selloff is temporary we will assume a return to trading at historical peer multiples for this calculation. In this case we get an average implied share price of $38.20 ( calculations in appendix), or potential upside of 14%.
Again, while this upside is appealing the margin safety is not the minimum 20% we prefer.
Relative Value-Based Implied Share Price (FactorRank Analysis)
Wall St Analyst Valuation
Summary of Analyst Valuations (FactorRank Analysis based on analyst target prices)
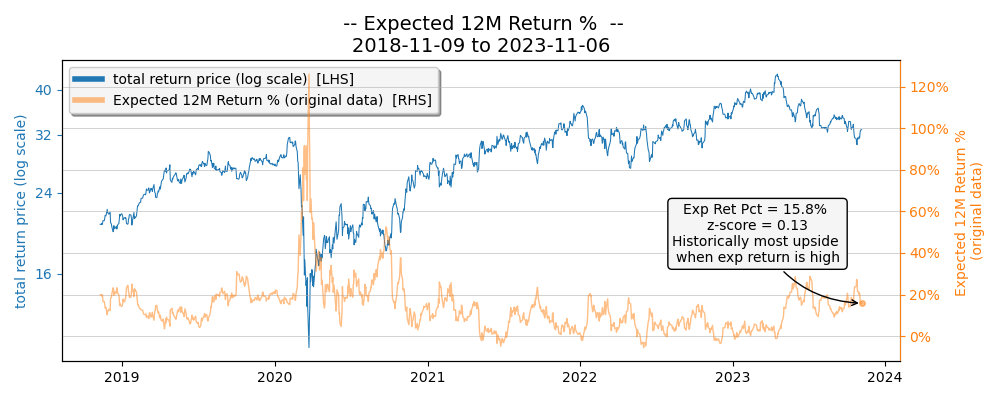
Nine analysts have updated their target prices since FHI reported earnings on Oct 27. One analyst upgraded their rating to 'buy' in that period and we now have six buys, three holds, and no sells. Potential upside sits at 16% which is appealing but we generally prefer higher margins of safety. As we can see in the chart below, previous upside extremes of this metric (orange line) have been good entry points, ideally above 20%.
FHI Expected 12M Returns (FactorRank Analysis based on Analyst Target Prices)
Risks
Risk Summary (FactorRank Analysis)
Upside Risks
- A run of macro data supporting the view that rate hikes are over but likely to stay higher for longer
- Immediately-accretive bolt-on acquisition of another money market player
Downside Risks
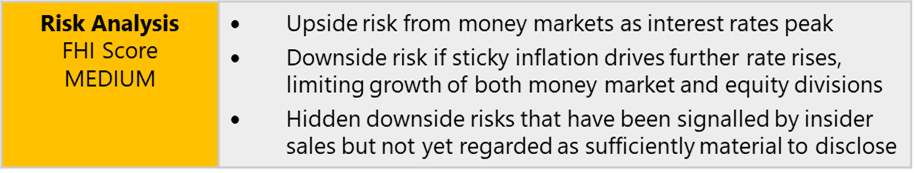
- Sticky inflation drives further rate rises, limiting growth of both money market division and equity division
- Hidden risks that have been signalled by insider sales but not yet regarded as material
- Significant acceleration in shift from equity funds to equity SMAs which would result in lower fee mix
- ESG overhang as investors focussed on Governance view the FHI structure (no voting for Class B shareholders) as below par
- Recession and dramatic fall in rates back to zero which would reduce money market fees (fee waivers kick in at zero rates)
There are no material credit risks of note.
APPENDICES
FHI TOP FACTORS
Leading Factors (FactorRank Analysis)
FHI Factor 1: EV/Sales Ratio 1Y Forecast
EV/Sales Ratio (FactorRank Analysis Based on Company Data)
FHI Factor 2: PE Ratio
PE Ratio (FactorRank Analysis Based on Company Data)
FHI Factor 3: 21-Day RSI
21-Day RSI (FactorRank Analysis Based on Company Data)
PEER RELATIVE VALUATION ANALYSIS
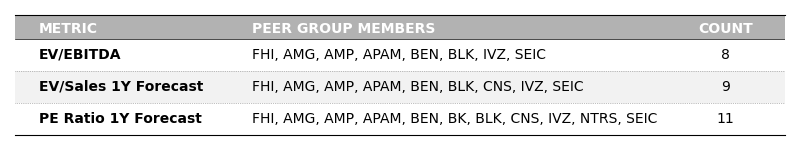
FHI Peers
Peer group members are from the same industry, show strong correlation and/or cointegration, and have good data quality. A common outcome of the selection process is slightly different stocks being used for each metric.
FHI Peers (FactorRank Analysis)
Implied Share Price Analysis
Here we show the calculation for implied share price of $40.05 for 1Y forward EV/Sales Ratio (middle row of Historical Range Chart). We're choosing this factor as its one of the primary factors explaining movement in FHI share price. Five year average peer multiple for forward EV/Sales is 3.3x. If FHI reverts to its 5Y discount of -34% (from historical range chart) it would trade at an implied multiple of 2.2 (from 3.3 x (1-0.34).
We then use the following projections to calculate a share price of $40.05:
- USD1.608B forward sales estimate X 2.2 = USD3.54B implied EV
- Less USD200m net debt = US3.34B implied EV
- Divided by 86m shares outstanding
- Equals USD40.05 implied share price (may be different with rounding)
Primary Factor List Tested
List of Primary Factors Tested (FactorRank Analysis)
Approach to Factor Analysis
Factor investing, supported by decades of rigorous academic research, has become a mainstream element of trading decisions for both institutional and retail investors.
Yet, we've found what sets successful factor analysis apart is the ability to determine the most influential factors at the individual stock level. Having spent several years analysing these factors, we've recognized that these factors are not only stock-specific, but they evolve gradually over time, and can be evaluated in different ways.
The traditional approach uses regression which examines all price changes across a dataset. Our concern with this approach was clouding the data with periods of limited trading appeal, when stocks were at 'fair value.' Given that we primarily aim to make investment decisions during periods of compelling upside potential, we sought an approach that pulls insights from a narrower dataset - the moments most crucial for trading decisions. This approach enhances our confidence that the generated factors are the primary influencers of price during the most likely trading periods.
Adopting this strategy requires a stationary dataset (see next section on Dynamic Z-Scores) and extensive ongoing backtesting. In our experience, it yields more dependable trading outcomes while also shedding light on the specific strategies that underpin these results.
A note of caution however. While factor-investing has proven itself over decades it can also have extended periods of underperformance. The factor view is only one component of a holistic valuation analysis.
Dynamic Z-Score Calculation
A key component of our approach to factor analysis is the generation of stationary data set to help inform factor-specific value on a rolling basis.
The traditional approach to z-score calculations uses matching time-frames for mean and standard deviation. Our approach uses different time-frames. We use rolling means with three-month windows because extreme price moves tend to occur over these relatively short time frames. This ensures we can identify the leading factors that influence reversals over these periods, rather than factors that influence price over the longer term. In addition, with earnings updates a common catalyst for reversion we get best results by aligning with this cadence.
Our rolling means are then balanced with a long-term (5-year) view of standard deviation to mitigate the influence of short-term volatility.
Using these two data series we construct a dynamic rolling baseline with a data series centered around a mean of zero. We've come to call this measure our "Dynamic Z-Score".
As with traditional z-scores we can interpret the results in terms of 'number of standard deviations.' For instance, if a factor exhibits a Dynamic Z-Score of -2, we interpret it as 'trading at 2 standard deviations below its rolling baseline.'
From a statistical standpoint, it's important to note that the underlying data often deviates from a Gaussian distribution. However, we find that using rolling means and standard deviations over different reference windows provides valuable insights into outliers relative to the data's inherent distribution. We flag these insights for further in-depth fundamental analysis.
Composite Ticker Score Calculation
The "Composite Ticker Score" is simply the average of the Dynamic Z-Scores of the leading factors for each stock. A negative score indicates that the leading factors are trading at lower multiples to our rolling baseline, signifying that the stock is potentially undervalued. Conversely, a positive score suggests that the stock is currently trading at higher multiples than our rolling baseline, possibly indicating overvaluation. Most scores fall within the range of -3 to +3, providing a concise representation of relative valuation.
Our Composite Ticker Score methodology enables direct stock ranking across pairs, sectors, indices, and even countries. In practical terms, the ranking process is just one component of a comprehensive process of in-depth research and analysis.
For further details see:
Federated Hermes: Good Candidate For Peak Rates Theme