FENY - FENY: A Cheap ETF To Gain Exposure To The Energy Industry
2024-01-12 05:11:13 ET
Summary
- Fidelity MSCI Energy Index ETF offers exposure to the energy sector, which may be reasonably valued and offer a margin of safety for investments.
- The fund is top-heavy, with its top two holdings, Exxon and Chevron, accounting for 35% of its total weight.
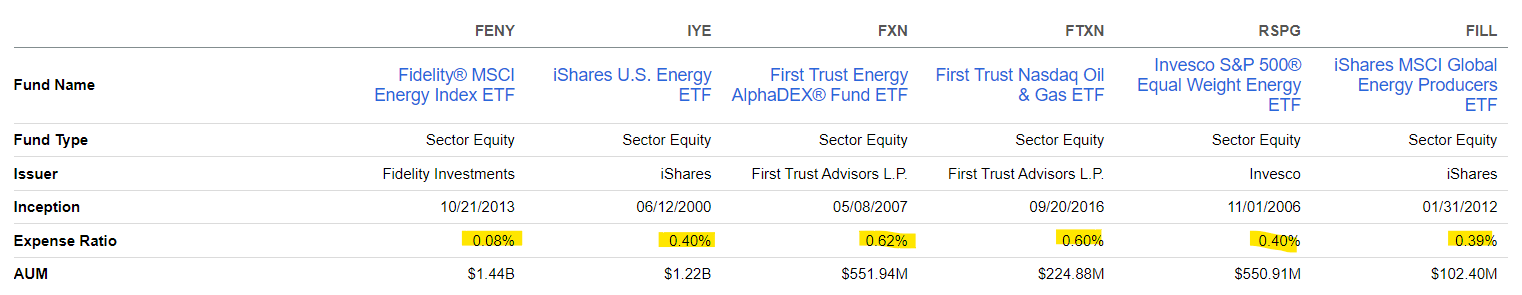
- FENY has a low expense ratio of 0.08%, allowing investors to keep almost all of their dividends, and a distribution yield of 3.43%.
- The fund's holdings have an average P/E of 8 and an earnings yield of 12%, indicating they are much cheaper than the overall market and support higher dividends.
- Meanwhile, the fund's long-term performance has been lagging, perhaps indicating it may be overdue for a rally, especially considering its cheap valuation.
Last year was a crowded trade year where everyone and their uncle crowded into 7 big tech stocks while everything else was left in the dust but now those 7 big tech stocks are approaching absurd valuations with 3 of their P/Es in 70s and 1 of their P/E below 30 so now investors are looking for another sector that may be reasonably valued and offer some margin of safety for their investments. Energy might be such a sector and Fidelity MSCI Energy Index ETF (FENY) might be a decent place to get exposure to the industry.
Investment Breakdown
FENY invests into 120 or so energy stocks that mostly deal with oil but there are also efforts to diversify into clean energy in the future. One thing you might notice about this fund is that it is top-heavy with its top 2 holdings Exxon (XOM) and Chevron (CVX) claiming 35% of its total weight because these two companies have by far the largest market caps in the fund and it's mostly weighted by market cap with no caps. Furthermore, the fund's top 10 stocks account for 65% of its total weight, which is not good for the sake of diversification but not too terrible either. If those companies are the most successful energy companies in the country, why not give them more weight?
Top 10 Holdings (Seeking Alpha)
Expense Ratio
The fund has an expense ratio of 0.08% which is much cheaper than its peers most of which charge anywhere from 5 to 8 times this amount. This means that investors will be able to keep almost all of their dividends as opposed to some funds which will take a significant chunk from your dividends. If a fund's holdings have a combined yield of 4% and its expense ratio is 0.40%, they are basically keeping 10% of your dividends as a fee. It's like paying an additional tax but thankfully this fund comes with a very small expense ratio. The only other energy fund I can think of that has a similar expense ratio to this fund is Vanguard Energy Fund (VDE) which charges an annual fee of 0.10%.
Dividend Distributions
Speaking of dividends, this fund has a distribution yield of 3.43% which is not exceptionally high but it's still more than twice the distribution yield of the overall market ( SPY ) which stands at 1.4% at the moment. The fund's average holding has a P/E of 8.6 indicating an earnings yield of 11.6% which means that the fund's holdings have a lot of room to increase their dividends in the future without suffering much. The average payout ratio of the fund's holdings is about 29.5% which is very healthy.
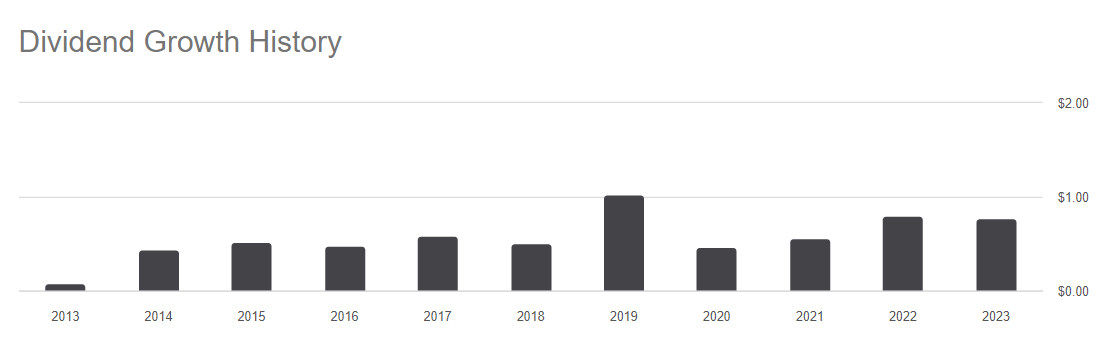
The fund has a pretty decent dividend growth history. While it doesn't hike dividend distributions every single year, the long term trend is upwards. The fund has an annualized dividend growth rate of 18% for the last 3 years and an annualized dividend growth rate of 9% for the last 5 years. This would put you well above the rate of inflation which peaked around 9% but averaged around 4-5% for the last 3 years.
Total Returns
One big negative for this fund is that it hasn't really done very well in terms of total returns. The fund's total returns are actually quite impressive if you focus on just the last 5 years which give you an annualized return of 11% but if you zoom out and look at the 10-year period, its total return is only about 27% which is 2% annualized. This is mostly caused by the disruption we saw in oil companies during the 2020 crash.
Some might look at the fund's underperformance in the last 10 years and say that it looks terrible which means this fund is not a good investment. Others might look at the same chart and say that this fund suffered from underperformance of the energy industry in the last 10 years and it's overdue for outperformance, especially given its cheap valuation. Currently the overall market supports a P/E ratio of 26 versus energy industry's average P/E of 8 which means the energy industry has plenty of catching up to do. Of course the energy industry will never match the overall P/E of the overall market because this industry has historically traded at a much cheaper valuation but even assigning it a fair P/E of 12 would indicate that it's undervalued by close to 50%.
Looking Forward
In the future, things could get interesting for the energy industry. As we found out in 2022, the world still needs a lot of energy to operate and the global demand for energy will continue to rise for years to come if not decades. We need energy to build things, transport things, heat things and so on and energy is used in every aspect of our lives one way or another. This is something that isn't going away whether we move to new sources of energy or not. Having said that, the energy industry is also highly cyclical and demand can fluctuate largely depending on where the economy is. When the economy is booming we need to build, transport and heat more things as compared to when the economy is slowing down significantly.
In the short-term economic cycles determine the demand for energy as well as energy prices while in the long term both of these are decided by the secular growth of the overall economy. In the short term we could see oil prices and other energy prices fluctuate wildly and even drop significantly but in the long run the demand for energy products should only increase as more parts of the world join the developed economy and their energy consumption increases. We've seen this with India and China and now we are seeing it with parts of Africa and other parts of Asia.
If you are an index fund investor and you have heavy exposure to S&P 500 index or Dow Jones Index (DIA) you most likely already have plenty of exposure to the energy industry but if you are not an index investor and if you would like to increase your exposure to this particular industry without picking stocks, this might be a good ETF to give you that kind of exposure.
For further details see:
FENY: A Cheap ETF To Gain Exposure To The Energy Industry