FENY - FENY: Good Risk/Reward Entry Point
Summary
- The FENY ETF provides broad exposure to energy companies.
- It has performed well vs. peer energy ETFs during the past year and pays a 3.5% trailing distribution.
- Recent economic data out of China supports my thesis that a Chinese re-opening could spur significant energy demand.
- I think FENY offers good risk-reward at current levels.
The Fidelity MSCI Energy Index ETF ( FENY ) provides broad equity exposure to energy companies by tracking the MSCI USA IMI Energy 25/50 Index. FENY performs well against peer ETFs during energy bull markets.
A recent positive surprise in Chinese economic data supports my thesis that a re-opening China could spur oil demand and prove to be a tailwind for energy equities. I believe FENY offers good risk-reward at current levels if one is constructive on oil prices.
Fund Overview
The Fidelity MSCI Energy Index ETF provides broad equity exposure to the energy sector. The FENY ETF tracks the MSCI USA IMI Energy 25/50 Index ("Index"), an index designed to measure the performance of the energy sector in the U.S. equity market.
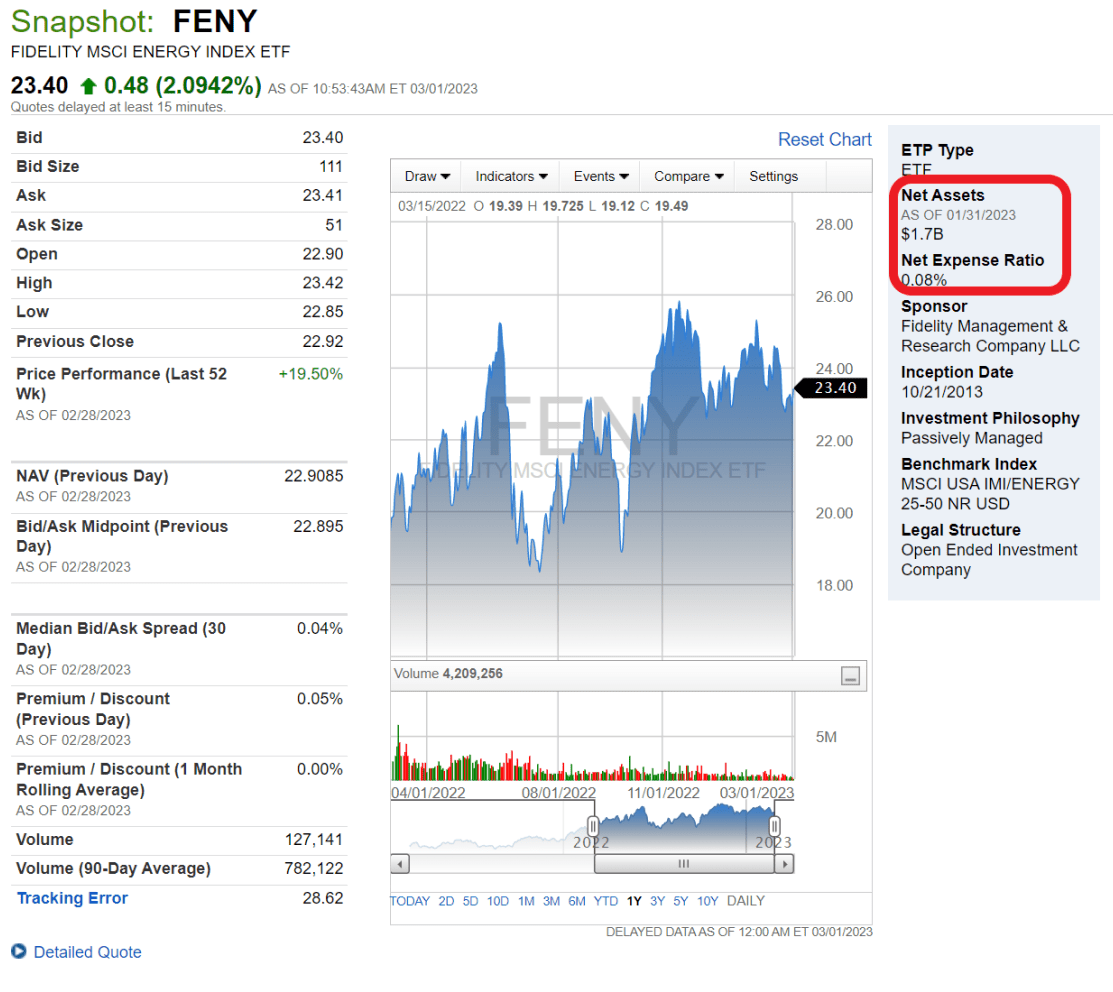
The FENY ETF has $1.7 billion in assets and charges a 0.08% net expense ratio (Figure 1).
Figure 1 - FENY overview (fidelity.com)
Portfolio Holdings
Although the FENY ETF holds 124 positions, the fund is fairly concentrated with the top 10 positions accounting for 67% of the fund's assets (Figure 2).
Figure 2 - FENY top 10 holdings (fidelity.com)
Returns
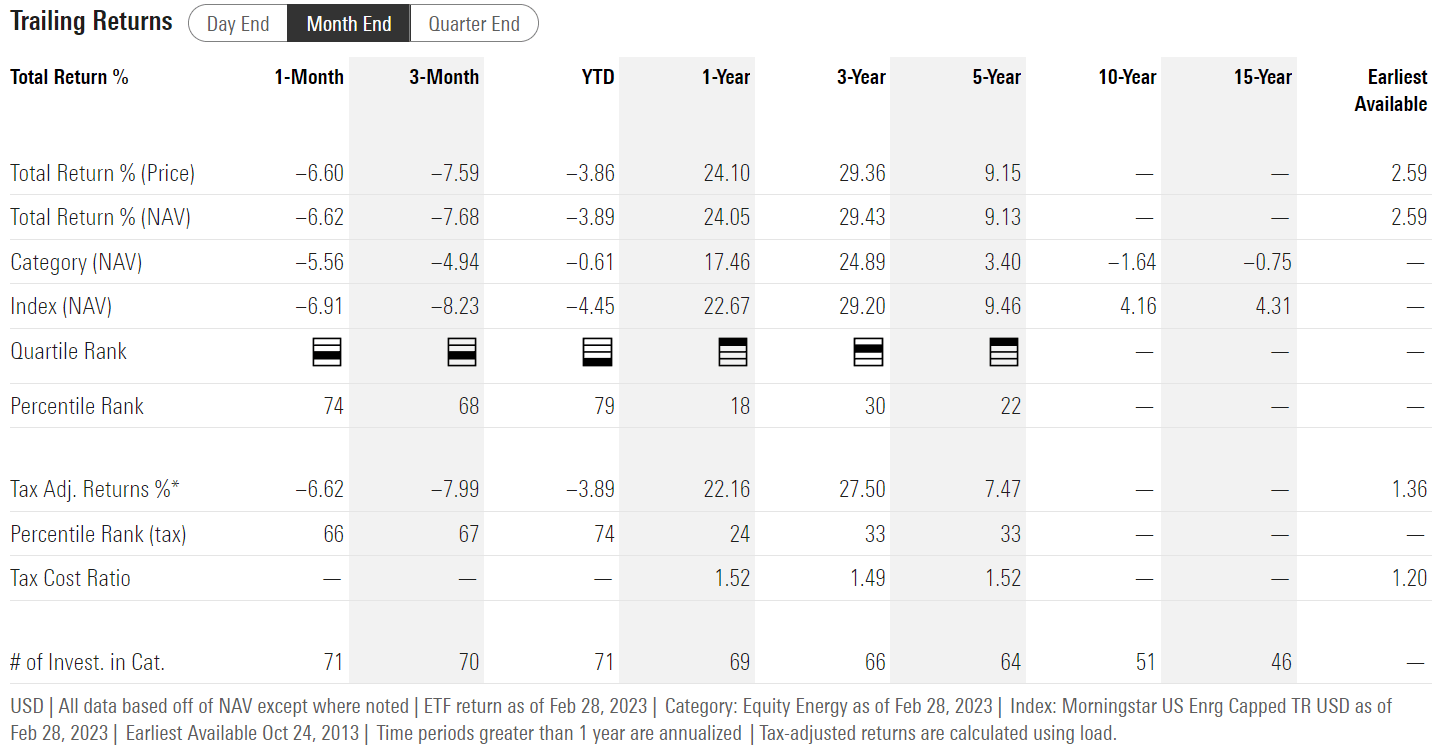
Figure 3 shows FENY's historical returns. The FENY ETF has done well in the past few years due to the tremendous rally in energy stocks after the COVID pandemic. FENY has a 1 and 3Yr average annual return of 24.1% and 29.4% respectively to February 28, 2023. However, FENY's 5Yr average annual return is more modest at 9.1%.
Figure 3 - FENY historical returns (morningstar.com)
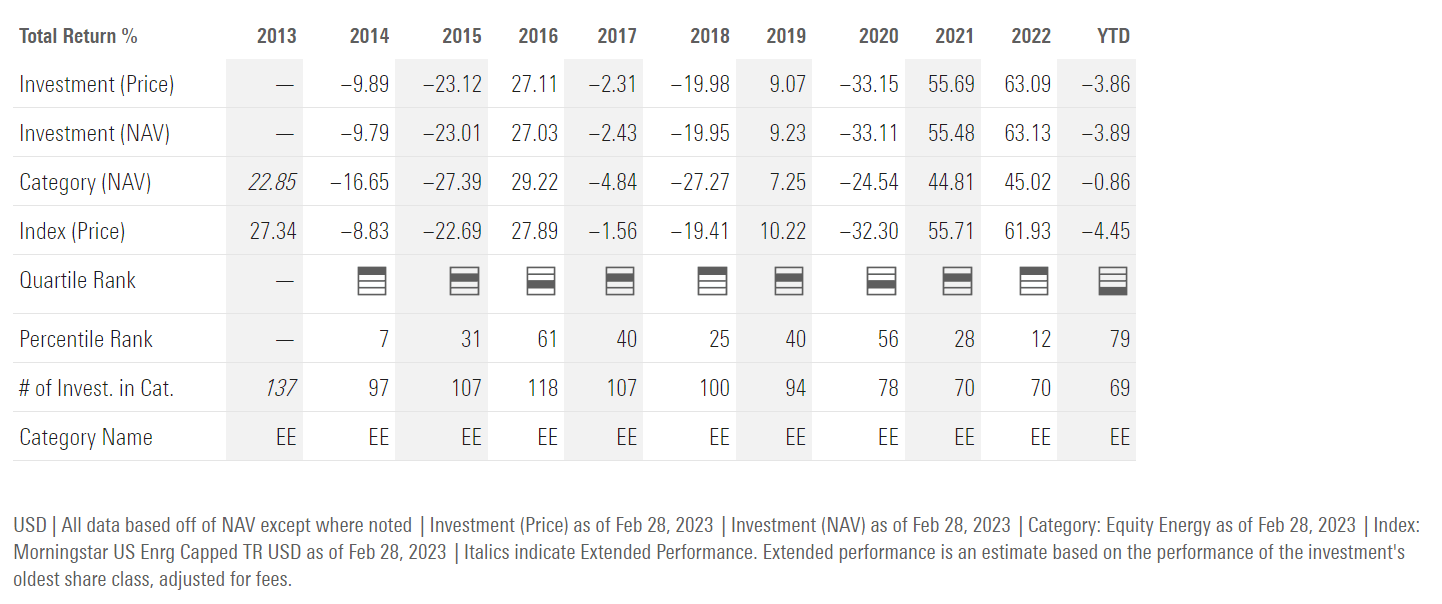
On an annual basis, we can see FENY's performance has been mostly on the back of a good 2021 and 2022. Prior to 2021, performance was actually quite poor with 5 out of 7 years (2014 to 2020) negative (Figure 4).
Figure 4 - FENY has had a good 2021 and 2022 (morningstar.com)
Distribution & Yield
The FENY ETF pays a modest quarter distribution with trailing 12 month distribution of $0.80 or 3.5% yield (Figure 5).
Figure 5 - FENY distributions (Seeking Alpha)
FENY vs. Peers
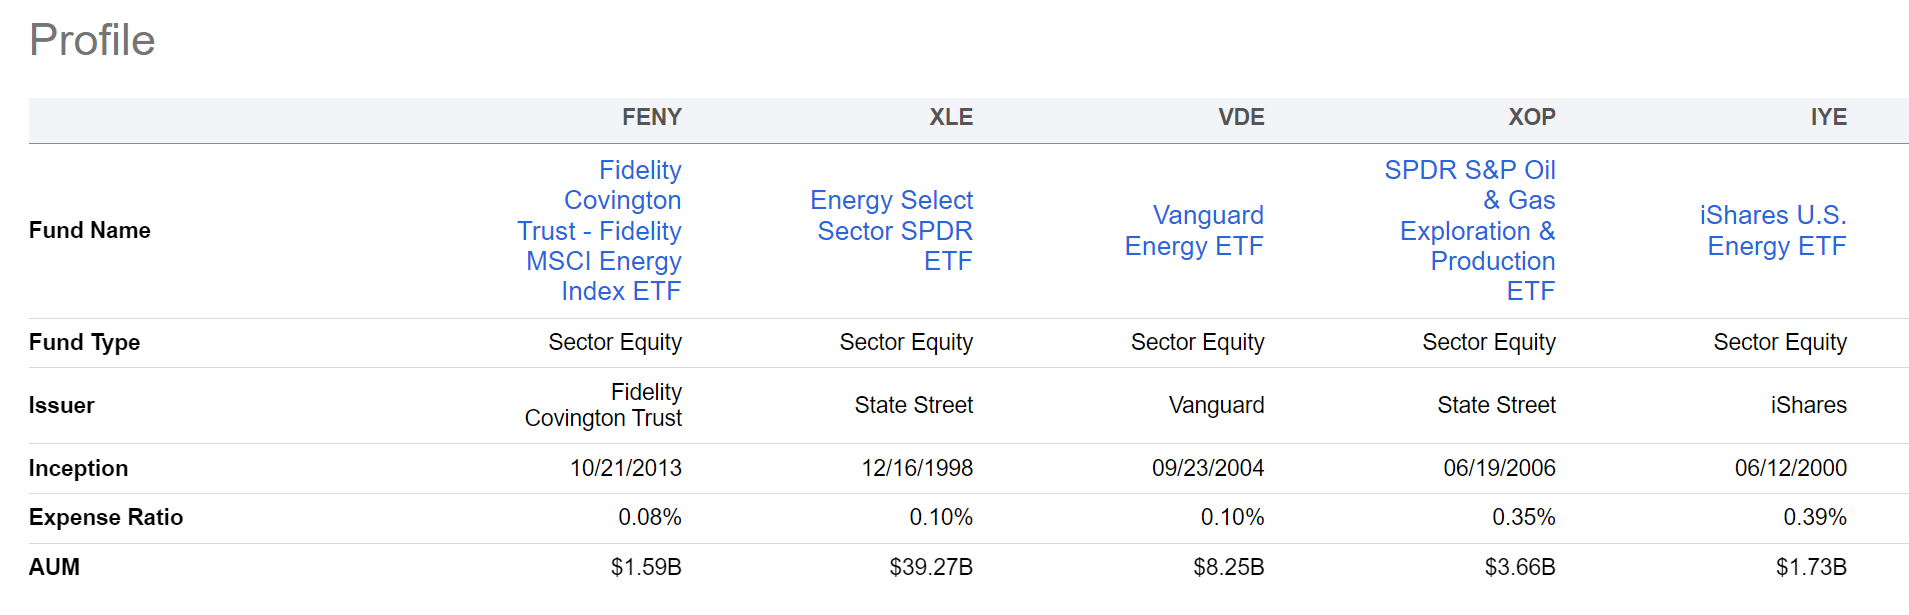
How does the FENY ETF compare against more popular peer energy ETFs like the Energy Select Sector SPDR ETF ( XLE ), the Vanguard Energy ETF ( VDE ), the SPDR S&P Oil & Gas Exploration & Production ETF ( XOP ), and the iShares U.S. Energy ETF ( IYE )?
First, comparing their structures, the FENY ETF actually has the lowest expense ratio at 0.08%, even below Vanguard, which is impressive (Figure 6). FENY also has the least assets out of the peer funds analyzed.
Figure 6 - FENY vs. peer fund profiles (Seeking Alpha)
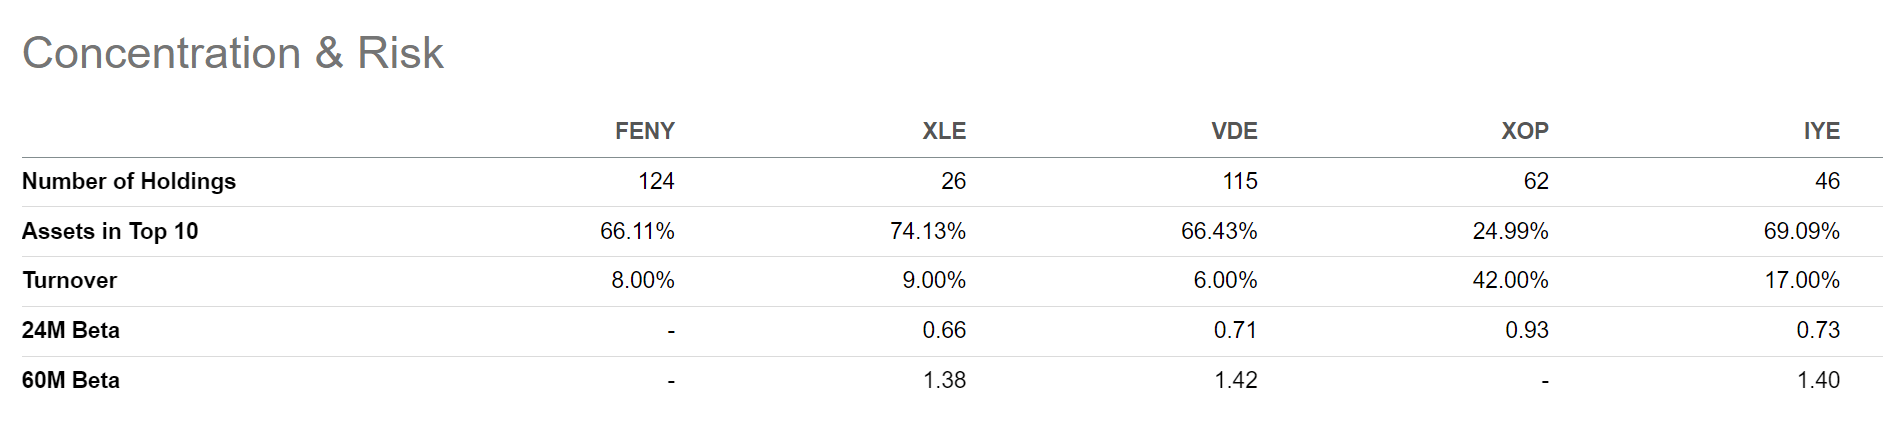
FENY's structure is most similar to VDE, as they both have over 100 securities across the different energy sub-sectors and market caps. XLE is more concentrated in the large-cap companies. XOP is more concentrated in upstream exploration and production companies (Figure 7).
Figure 7 - FENY vs. peer holdings (Seeking Alpha)
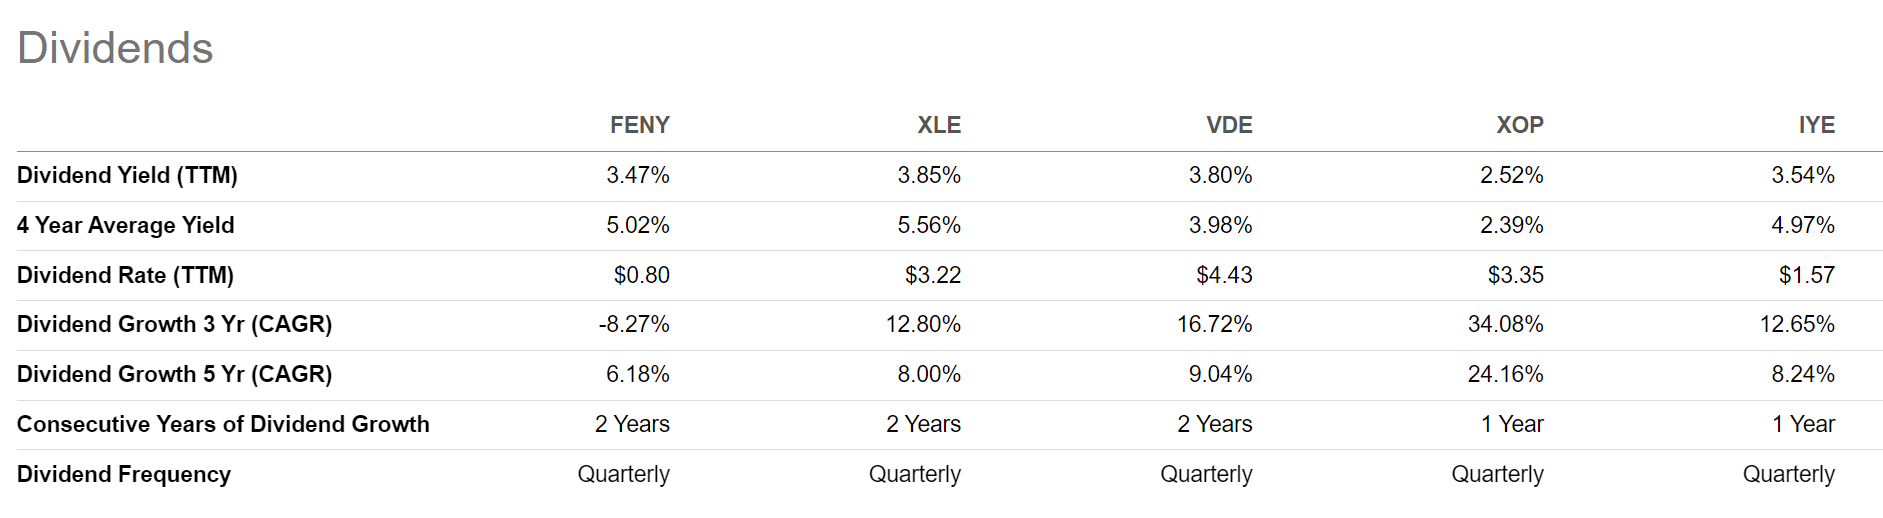
In terms of distribution, FENY pays a modest 3.5% trailing distribution yield, below XLE and VDE which pay 3.9% and 3.8% respectively (Figure 8).
Figure 8 - FENY vs. peer distributions (Seeking Alpha)
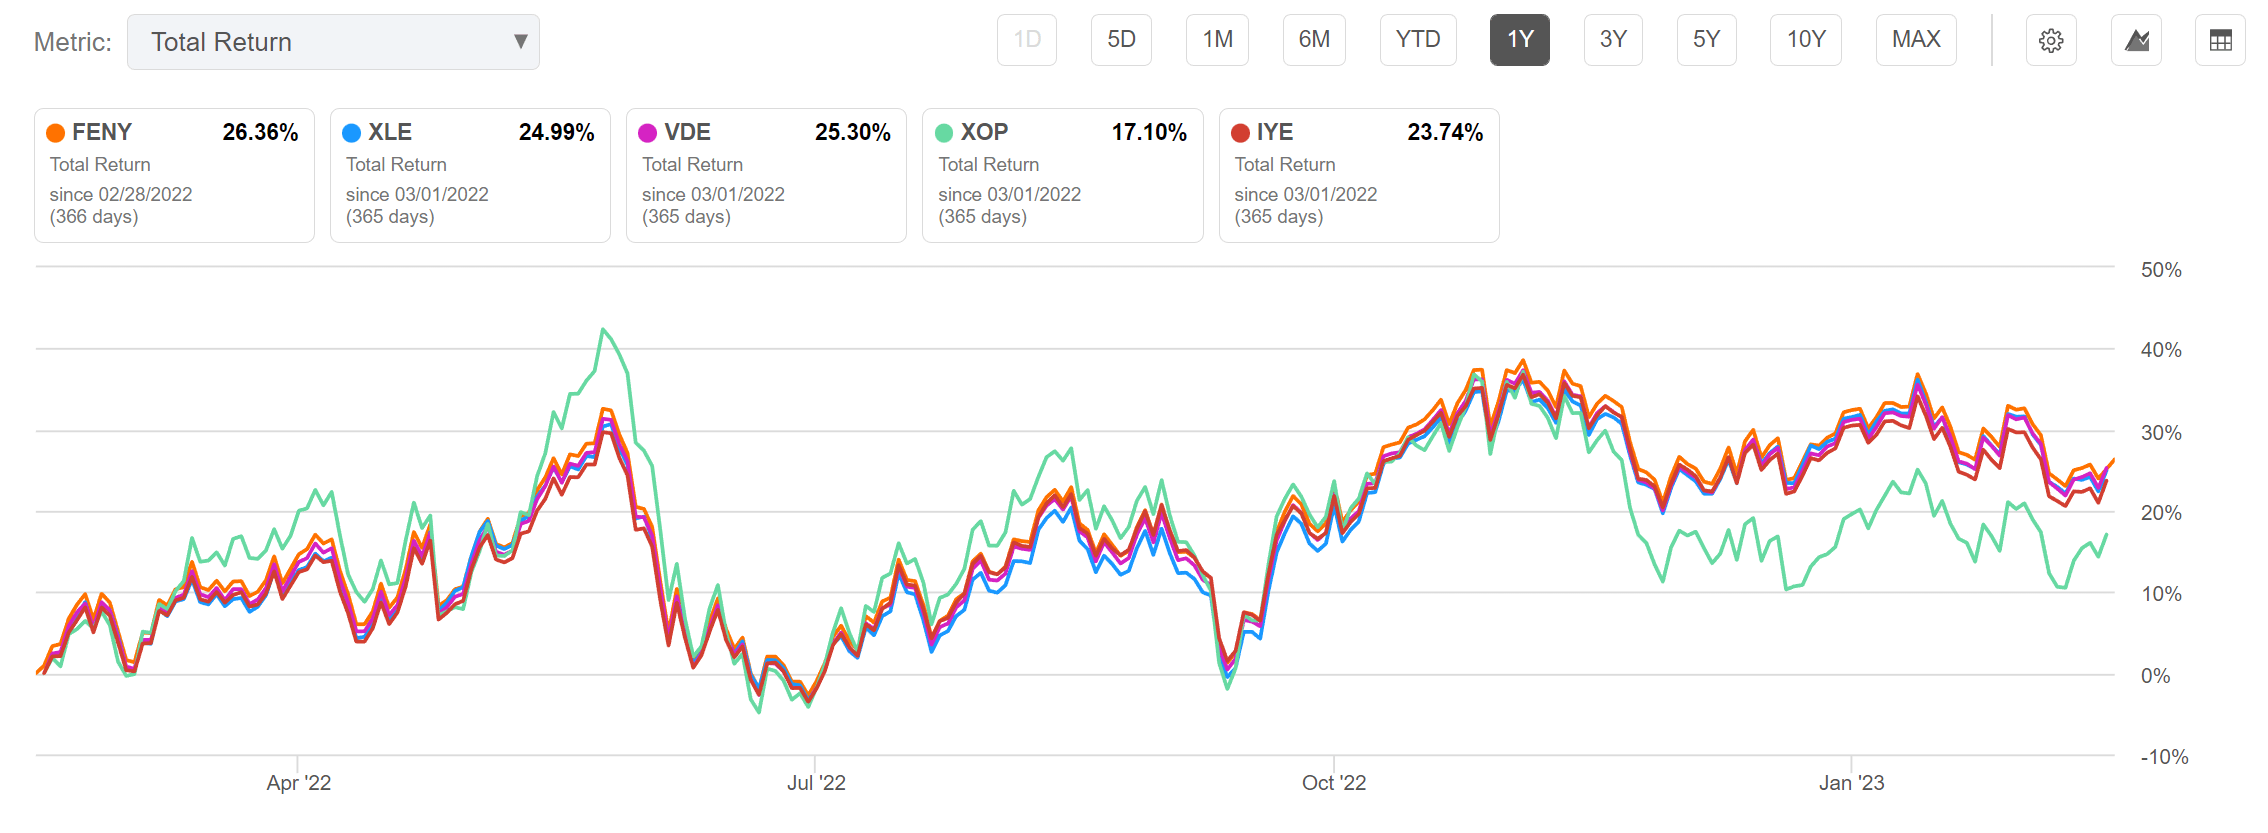
Comparing 1Yr total returns, FENY has the highest total returns compared to the peer funds (Figure 9).
Figure 9 - FENY vs. peers 1Yr total returns (Seeking Alpha)
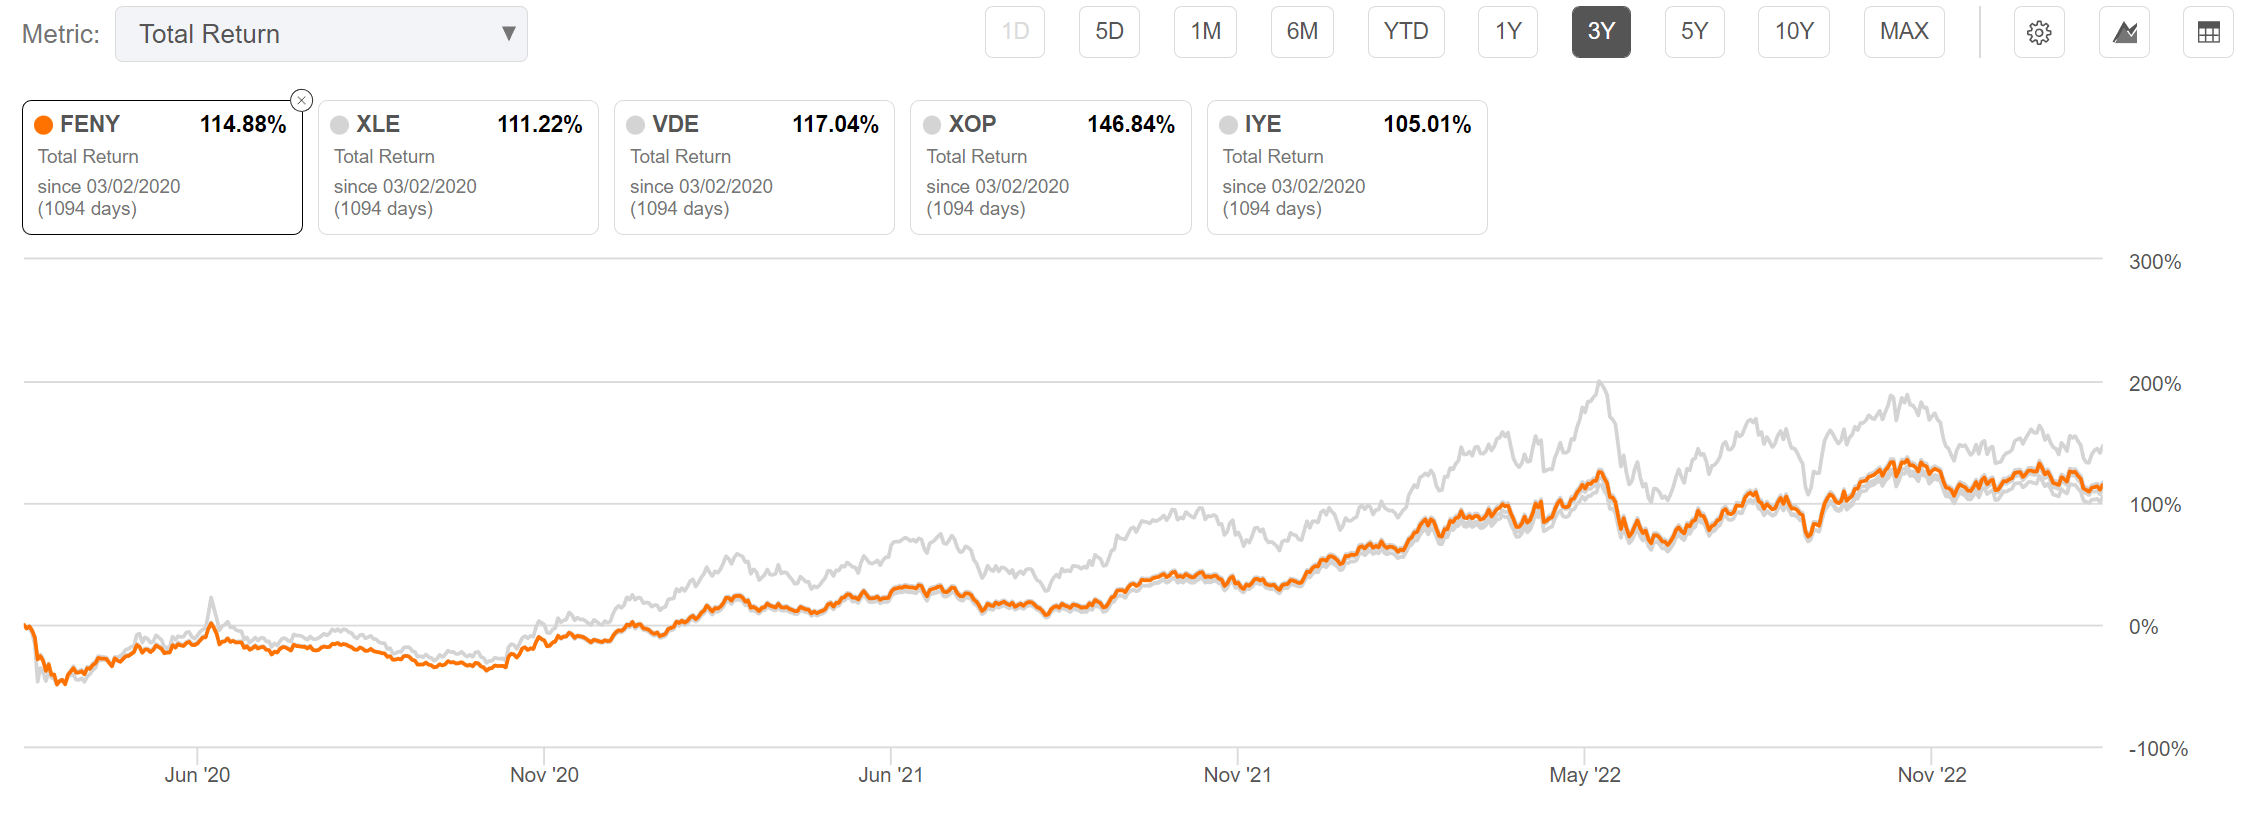
FENY has performed similar to diversified peers like XLE and VDE on a 3Yr time-frame (Figure 10).
Figure 10 - FENY vs. peers 3Yr total returns (Seeking Alpha)
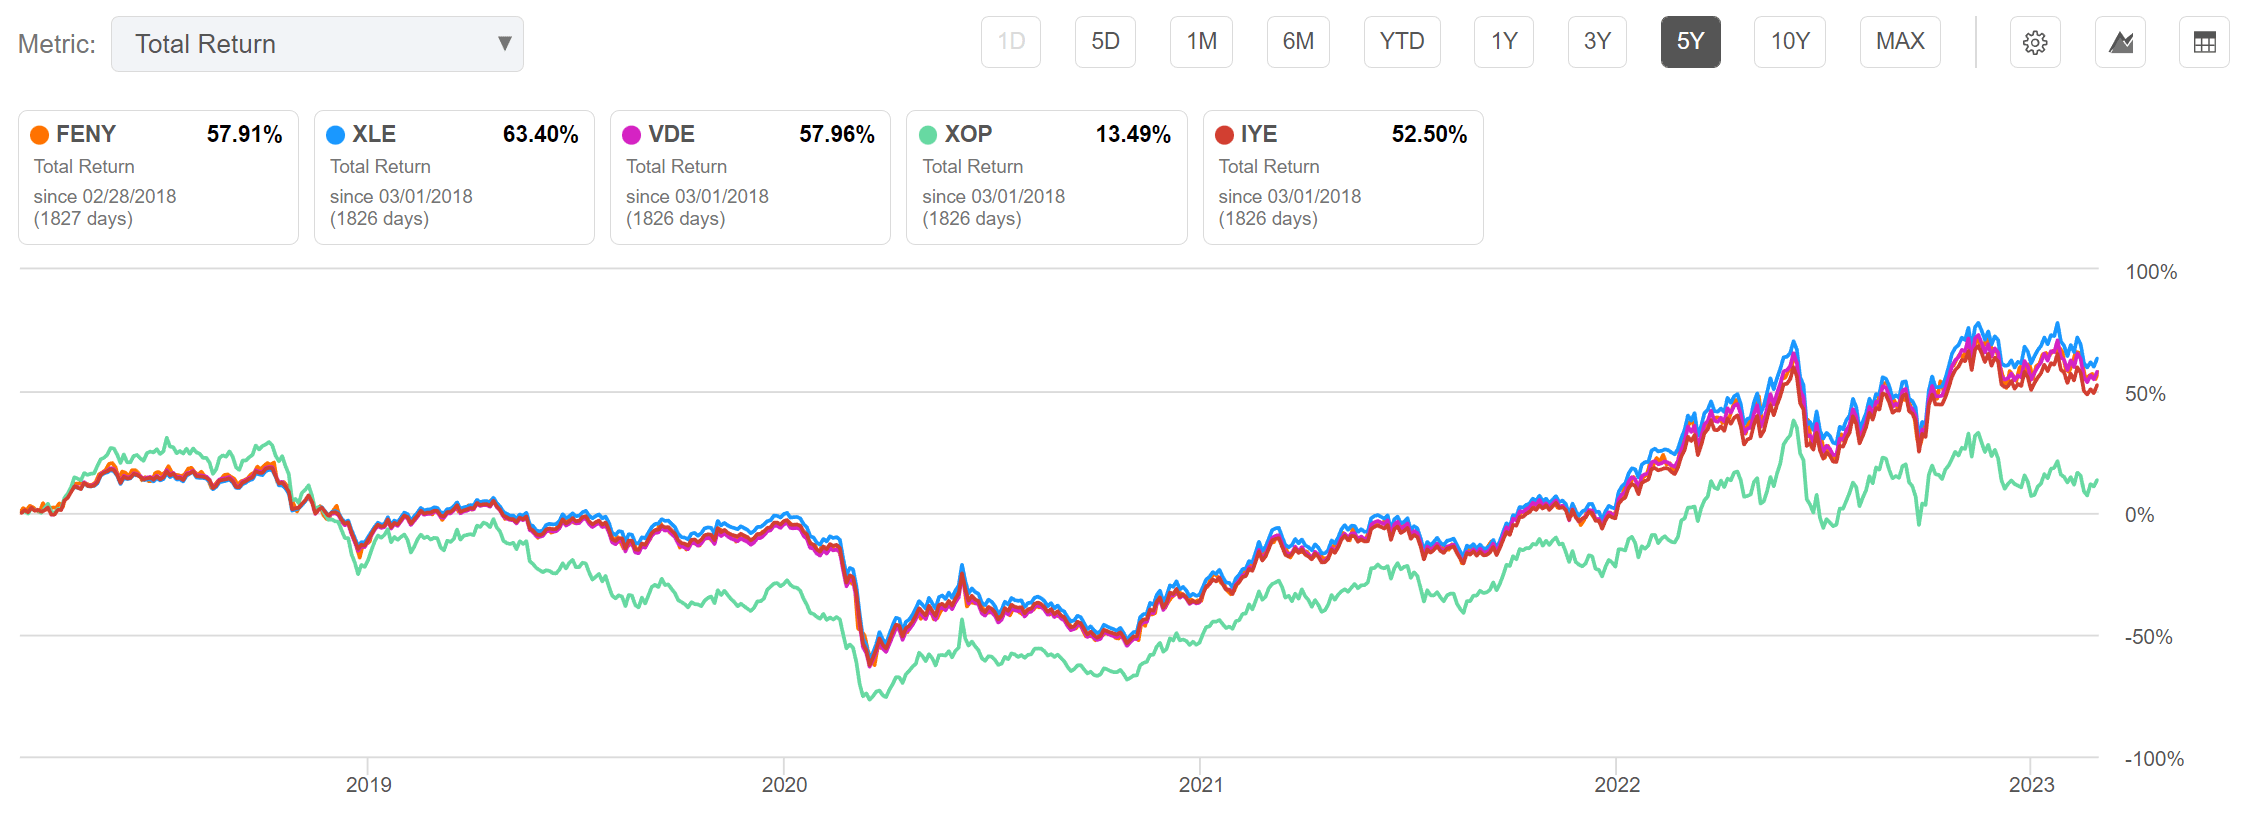
On a 5Yr time-frame, FENY lags behind XLE and performs similar to VDE (Figure 11).
Figure 11 - FENY vs. peers 5Yr total returns (Seeking Alpha)
Overall, the FENY ETF delivers solid performance during an energy bull market, as its broad basket of holdings allow it to generate high returns. However, over a cycle, it trails the large-cap focused XLE ETF, as XLE's higher mega-cap exposure (XLE has 42.9% weight in Exxon (XOM) and Chevron (CVX)) allows it to weather the downswings better than FENY's more diversified portfolio.
China PMI Surprise To The Upside
A few weeks ago, I wrote a bullish article on the United States Brent Oil Fund ( BNO ), suggesting risks were skewed to the upside on oil prices, as China re-opens its economy and supply / demand balance remains tight with continued Russian oil disruptions.
In the ensuing few weeks after my article, the China re-opening trade hit a bit of a lull, as lack of news-flow caused both crude oil and FENY's stock price to drift sideways.
However, on February 28th, markets were rewarded with a positive surprise when China reported official manufacturing PMI of 52.6 for February, the highest level since April 2012. The strong PMI reading far exceeded analyst forecasts for a 50.5 reading and neatly dovetails with my expectation for a rebound in economic activity following the late January lunar new year celebrations.
Technicals Suggest Possible Rebound In Progress
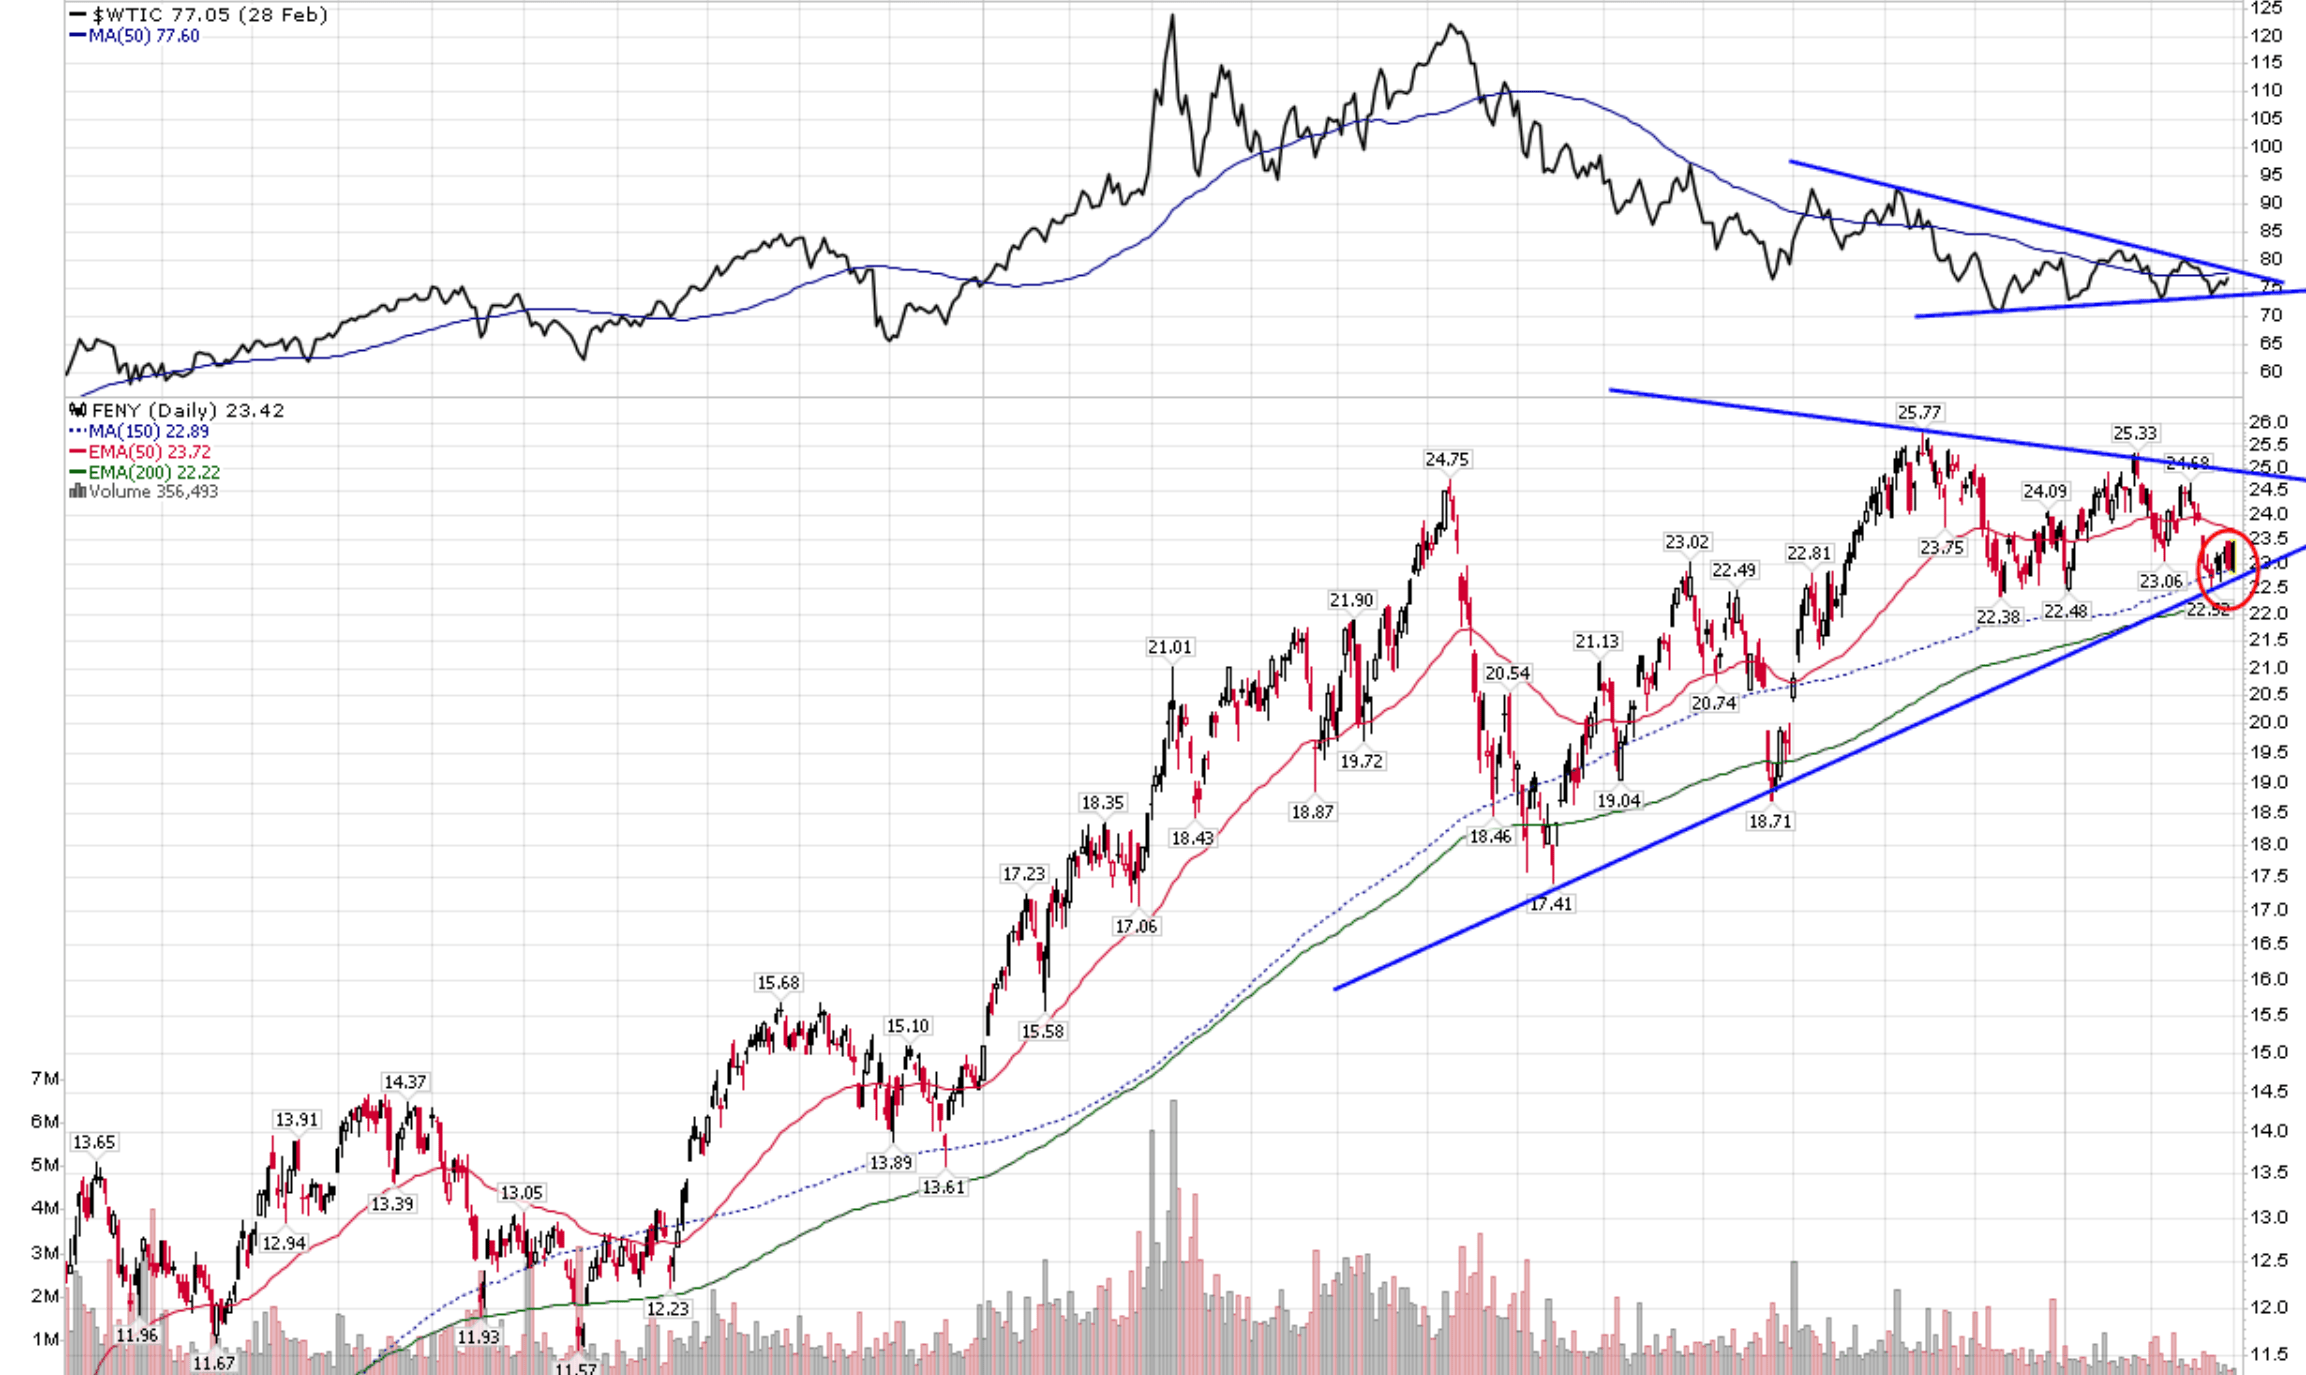
Technically, the FENY ETF has been consolidating near its 150DMA for a few days prior to the China PMI surprise (Figure 12).
Figure 12 - FENY offer good risk/reward near 150DMA (Author created with price chart from stockcharts.com)
If the positive China news can spur crude oil to break out of the triangle pattern that had been constricting its price range, we should expect to see FENY trade back towards 2023 highs near $25 and possibly break out as well.
A long-entry in FENY at current levels provide good risk / reward, as investors can use a failure of recent lows and the 150DMA as a good stop-loss level around $22.50.
Conclusion
The Fidelity MSCI Energy Index ETF provides broad equity exposure to energy companies by tracking the MSCI USA IMI Energy 25/50 Index. FENY performs well against peer ETFs in the past year. A recent positive surprise in Chinese economic data could spur a rally in crude oil prices, which can lead to a break out of the FENY ETF from a multi-month triangle pattern. I believe FENY offers good risk-reward at current levels.
For further details see:
FENY: Good Risk/Reward Entry Point