PXD - FENY: U.S. Oil Sector Deleveraging Vs. Growth
2023-10-26 05:23:24 ET
Summary
- US oil & gas producers focused on deleveraging, not growth.
- Concentrated ETF portfolio may not capture future M&A activity.
- Market not pricing in higher oil prices or volume gains, but sector reducing debt and paying out cashflow.
Summary
The Fidelity MSCI Energy Index ETF ( FENY ) is focused on US oil & gas producers, oil services, LNG & oil refining as well as pipeline transportation companies. It is very concentrated with the top 3 stocks making up 44.6% of the ETF. The recent acquisitions of Hess ( HES ) and Pioneer ( PXD ) highlight the disparity in absolute size vs majors like Exxon ( XOM ) and Chevron ( CVX ). After conducting a bottom-up analysis of 90% of the portfolio, with consensus estimates, I concluded that the market is not pricing higher oil nor volume gains judging from a scant 3% EBITDA increase in the YE24-YE25 period. However, it does appear that the sector will continue to reduce debt and pay out cashflow via dividends and buy backs.
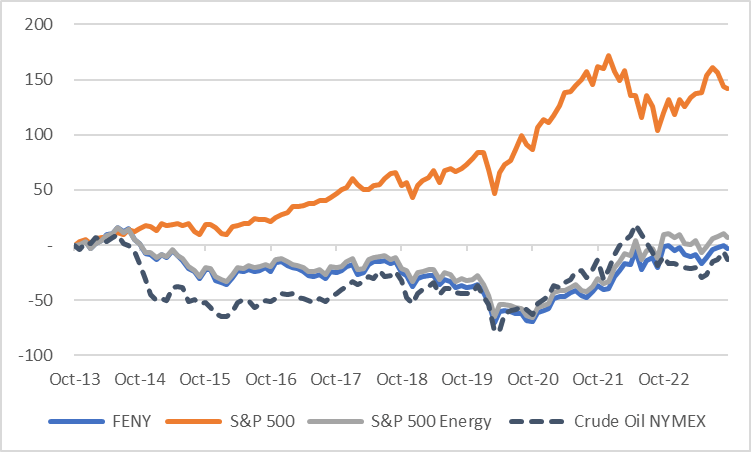
While most oil assets follow the price of oil, this ETF has a slightly lower correlation perhaps due to some exposure to oil refining and pipelines that are less impacted by daily oil price moves. Nonetheless, the sector has been a severe underperformer vs the S&P 500 ( SPY ).
FENY vs Oil and SP500 Energy (Created by author with data from Capital IQ)
Looking Under the Hood
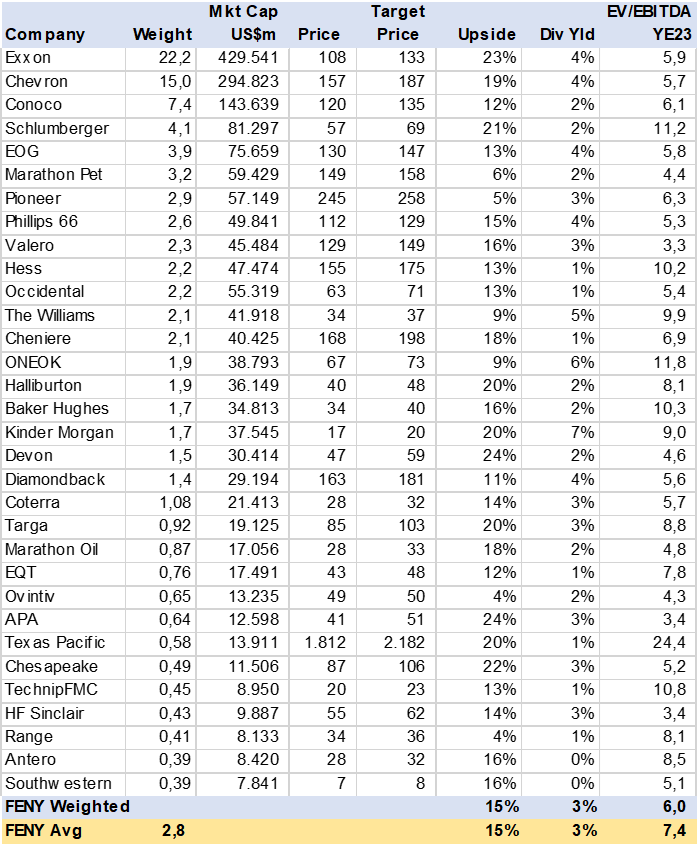
Using consensus estimates for 90% of the ETF portfolio (32 stocks), I calculated the potential total return, dividend yield, EBITDA growth and leverage. As can be imagined, with Exxon, Chevron and ConocoPhillips ( COP ) making up 44% of the portfolio, their operating dynamics are bound to dominate the ETF bottom-up estimates.
I find that the market is positive on valuation with a YE24 upside potential of 15%. However, this is not accompanied by EBITDA growth at just 5% for the same year.
FENY Consensus Valuation (Created by author with data from Capital IQ)
EBITDA Growth Stalls
The market does not appear to be factoring in continued oil price increases nor much volume growth given consensus estimates of just 3% EBITDA growth for the YE24-YE25 period. This is actually worse than appears given a 16% contraction in YE23. The sector does not surpass absolute EBITDA from YE22 levels i.e., the Ukraine invasion impact. The ETF had a weighted EBITDA of US$41bn in YE22 which is estimated to fall to US$31.3bn in YE25.
Stand outs are the oil service stocks, such as Baker Hughes ( BKR ) with consensus EBITDA growth of over 10%. These have greater revenue diversification and may be providing work in LNG and new energy technology such as carbon capture.
FENY Consensus EBITDA Growth (Created by author with data from Capital IQ)
Reducing Leverage
As seen in consensus net debt ((ND)) estimates, the sector is rapidly cutting debt. In the absence of capital expenditures or capex to grow production volumes, the oil & gas producers are using cashflow to pay dividends or buy back stock and to pay down debt. I calculated that the ETFs portfolio may see an accelerating ND reduction of 14% in the YE24-25 period. ND/EBITDA falls from .7x to .5x in this time frame and many companies go net cash. The ND reduction helps offset the lack of EBITDA growth with the EV (Enterprise Value) part of the EV/EBITDA equation declining.
In my view, given the uncertain demand situation due to the global energy transformation or de-carbonization policies, it’s a good strategy to reduce capex, cut debt and literally milk the wells. This may not be the best environment for refineries, but they may be also looking to maximize cash flow.
FENY Consensus Net Debt (Created by author with data from Capital IQ)
Total Return Challenged
I calculated total return (excluding share buybacks) using consensus price targets for YE24 and DPS (dividends per-share) estimates for YE24 and YE25. To arrive at the YE25 price target I used the implied EV/EBITDA target multiple for YE24 and applied it to YE25 EBITDA and Net Debt. As can been seen in the table below, the total return in YE24 (18%) is substantially better than YE25 (6%). This coincides with decelerating EBITDA growth and indicative of the markets inability or unwillingness to forecast long term oil prices, in my view. A few outliers are Chesapeake ( CHK ) and EQT ( EQT ).
FENY Consensus Total Return (Created by author with data from Capital IQ)
Conclusion
This ETF is a hold. Its concentrated portfolio in major oil & gas producers provides oil price risk at the potential top end of prices while limited production growth is not offset by debt reduction. The recent M&A activity may lead investors to seek ETFs with more equal weights or focused on smaller producers.
For further details see:
FENY: U.S. Oil Sector Deleveraging Vs. Growth