FFA - FFA Vs. ETB: Discounted Call Writing Funds
2023-05-10 16:41:30 ET
Summary
- FFA and ETB utilize an options writing strategy rather than being leveraged.
- With no leverage, they can be relatively less volatile during uncertain periods.
- Both are trading at attractive discounts where an investor could consider entering a position.
Written by Nick Ackerman, co-produced by Stanford Chemist. This article was originally published to members of the CEF/ETF Income Laboratory on April 26th, 2023.
The majority of closed-end funds implement leverage in their strategies in an attempt to boost overall returns. That certainly can work during times of bull markets, but unfortunately, we aren't always in a bull market. Call-writing funds can be fairly attractive alternatives to their leveraged counterparts for those more uncertain periods or investors expecting flat markets going forward.
First Trust Enhance Equity Income Fund ( FFA ) and Eaton Vance Tax-Managed Buy-Write Income Fund ( ETB ) are two funds in this space that are worth considering at this time due to attractive valuations. That is, both of these funds are trading at discounts currently, which are near their longer-term average discount.
A discount can be a great place to start getting an idea for an attractively valued CEF. However, that alone doesn't necessarily give us the overall picture. History has shown that looking more at the long-term average can be an even more important metric. ETB has also recently dropped sharply from a near-all-time high premium, potentially setting it up for a more short-term snapback.
YCharts
These are both funds I've covered before, but it has been a little while since I've provided an update for either. As two funds that are operated similarly with similarly attractive valuations, combining both updates comparing the two in one piece seems appropriate.
FFA Basics
- 1-Year Z-score: -0.78.
- Discount: -5.82%.
- Distribution Yield: 7.63%.
- Expense Ratio: 1.13%.
- Leverage: N/A.
- Managed Assets: $350.4 million.
- Structure: Perpetual.
FFA's objective is to "provide a high level of current income and gains and, to a lesser extent, capital appreciation." It attempts to do this by investing in "a diversified portfolio of equity securities." So, we are looking at a rather simple portfolio. It then utilizes an option strategy "on an ongoing and consistent basis... on a portion of the Fund's Managed Assets."
As a smaller fund, entering and exiting the fund for larger investors can be somewhat of an issue. For most retail investors that want to hold longer-term, that is generally less of an issue.
ETB Basics
- 1-Year Z-score: -1.85.
- Discount: -6.30%.
- Distribution Yield: 8.85%.
- Expense Ratio: 1.12%.
- Leverage: N/A.
- Managed Assets: $396.4 million.
- Structure: Perpetual.
ETB's investment objective is "to provide current income and gains, with a secondary objective of capital appreciation."
To achieve that objective, they'll focus on "a diversified portfolio of common stocks and write call options on one or more U.S. indices on a substantial portion of the value of its common stock portfolio to seek to generate current earnings from the option premium."
ETB is the larger fund, but it isn't by much. Therefore, some of the same issues can crop up here, too, due to a lack of liquidity for large investors.
Differences Between FFA Vs. ETB
The overall strategy between the funds is fairly similar in being call-writing funds, but their implementation is a bit different. One of the big differences between FFA and ETB comes up when we look at the options overlay and the number of holdings.
Currently, FFA reported that they are overwritten by around 69%. ETB, on the other hand, will look to overwrite nearly 100% of its portfolio. Additionally, FFA lists 65 holdings, whereas ETB last reported 174. That would make ETB the more diversified fund in terms of overall exposure to a broader range of individual names.
Additionally, while ETB focuses exclusively on writing options against indexes, FFA is more flexible. FFA takes the approach of writing calls against individual positions and indexes. Generally speaking, it can be easier to lose money on index call writing options because, theoretically, losses are unlimited.
This is because you can't own an index directly. You can hold individual positions, so any losses are limited to your cost basis versus whatever a position may be called away at for its strike price. Ideally, the managers would be writing options above their cost basis to produce gains.
In practice, though, these funds carry significant exposure to the components that make up the underlying S&P 500 Indexes that they write against. So, while losses are theoretically unlimited, in practice, these losses are offset by gains in the underlying portfolio positions.
Performance Comparison
Over the longer term, equities tend to rise, and that's where one of the main disadvantages of call-writing funds can come up. During bull markets or rapidly rising markets, they will lag non-optioned writing peers. This goes back to the losses we discussed above. While the underlying portfolio is also rising to offset the losses on the options, those options are still limiting the upside.
Given that the last ten years showed a strong bull market for most of the period, we can see this play out between the two funds. Remember, FFA has less of its portfolio overwritten relative to ETB. Thus, it should probably come with little surprise to see FFA outperform over the longer term on a total NAV return basis.
YCharts
The fund's total share price returns came very close in 2022 due to ETB running up to its large premium, as we noted at the opening of this article.
Conversely to what we saw over the longer term, ETB won out in 2022 in terms of its total NAV return performance. The main driver would seem to be the fund's larger overwrite, helping to provide more gains throughout the year.
YCharts
To measure this, we can take a look at the last annual reports to see what funds produced more gains due to their underlying options. Fortunately, they both have the same fiscal year-end, which lines up with the calendar year-end. We can see that FFA produced written option gains of around 1.4% relative to the starting net asset balance of 2022. ETB's annual report shows us they produced around 5.16% in written options gains relative to its starting net asset value. There is a lot of variability here that can lead to different outcomes.
Again, FFA implements covered call writing as well as index writing. Different expirations and levels of moneyness of writing will all play a role too. This gives us a quick and dirty metric for what fund produced more in terms of options premiums for the fiscal year. It is over a whole 12-month period, which hopefully provides a long enough period to limit some of that variability.
The main takeaway I would draw here is that ETB's more aggressive overwrite strategy should limit volatility relative to FFA during market uncertainty. Over the longer term, in a rising market, both will likely underperform non-option writing peers, as we've often seen occur in most of the last decade. Still, for an investor that wants to reduce volatility and expects a flat market, that's where these funds can provide alpha.
Attractive Distribution Yields
Being CEFs, investors in these funds are looking to get a healthy dose of distributions. Both funds being equity funds will rely significantly on capital gains to fund their distributions. That's where the option of writing premium can come in once again to help as a buffer, but that's only slightly defensive. The premiums from writing options alone don't tend to cover the payouts, so continued deep market losses would take their toll.
Both funds cut their distributions around the Great Financial Crisis ((GFC)). ETB held steady until the latest cut last year. On the other hand, FFA was able to up their payout on several occasions since the GFC. FFA pays a quarterly distribution while ETB pays monthly, which can be more enticing to some income investors.
YCharts
Eaton Vance tends to be pretty quick to cut the distributions on their fund relative to other names. On the other hand, ETB was and still is at a higher distribution rate anyway, which likely contributed to why it was cut in 2022.
YCharts
Portfolio Top Ten Positioning
We already touched on ETB holding a larger number of holdings, but we can take a look at the top ten of each fund to get a better idea of what we are investing in. As CEF investors, we don't want to only look at a discount and see that it is trading lower than its long-term average and buy it. One must be comfortable with the type of exposure they are going to be getting when buying a fund, too.
The portfolios overall are quite similar, but due to the number of holding differences, it seems to play out as expected. That is, significantly larger weightings in FFA's portfolio when looking at the top ten.
FFA Top Ten (First Trust)
Apple ( AAPL ) and Microsoft ( MSFT ) are present in each of these funds as top holdings. However, FFA's allocation to these two names comes to nearly 19% alone. For ETB, it's elevated but more moderate, coming in at around 13.4%. The fact that FFA held a higher allocation to AAPL and MSFT also likely contributed to the fund's better performance in the prior year. Tech stocks were hit hard, but AAPL and MSFT were both relatively better performers.
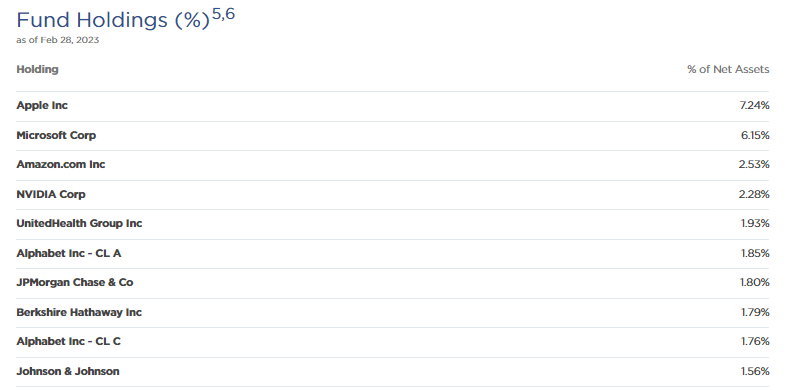
Note that these are reporting for two different periods. First Trust posted holdings as of the end of March, and Eaton Vance is for the end of February.
Neither changes top positions too dramatically since I've been following them. FFA reported a turnover rate of 21% last year, and ETB was also at 21%. However, that was fairly active for ETB, which usually posts much lower turnover. In 2021 it was 6%; in 2020 was 8%. And in 2019, turnover was as low as 2% for the fund.
FFA tends to be more active based on their prior years of turnover rates reported. The average for the last five years was 27.4%.
Conclusion
FFA and ETB are quite similar call-writing funds, but we can see some of their differences when digging into them. We've seen those differences play out in the performance between the funds in different periods. However, both funds also are presenting fairly attractive valuations to consider either at this time. ETB's sharp decline from a significant premium recently has it looking much better than in our previous update when it was at a premium. FFA's discount has widened since our prior update , pushing it near its longer-term average discount.
For further details see:
FFA Vs. ETB: Discounted Call Writing Funds