FFC - FFC: Solid Preferred Stock Fund But Too Much Duration For My Outlook
Summary
- The FFC is preferred stock focused fund with strong long-term historical returns.
- However, the fund took a tumble in 2022 due to the high duration exposure of the portfolio.
- If investors believe interest rates are going to decline, then FFC would be a good choice.
- The fund pays a prudent 6.4% forward yield.
I recently reviewed the Cohen & Steers Limited Duration Preferred & Income Fund ( LDP ) and a reader asked how does LDP compare to the Flaherty & Crumrine Preferred and Income Securities Fund ( FFC ) that he owns. I was curious myself so I decided to take a closer look at the fund.
The FFC fund took a tumble in 2022 due to the portfolio's high duration exposure as the Fed raised interest rates by 425 bps. However, if interest rates were to decline in H2/2023, as many market participants are currently predicting, then FFC may have the most rebound potential out of the peer funds I have reviewed.
Importantly, FFC's distribution policy is the most prudent out of the 4 preferred CEFs that I have looked at. As its NAV declined in 2022, it also shrank its payout, ensuring the fund does not end up as a amortizing 'return of principal' fund.
Overall, I like FFC's distribution policy and long-term returns profile. However, I am concerned about the fund's duration exposure as I have a fundamentally different view on the path of interest rates than market expectations. I believe the Fed is set on a 'higher for longer' path, so FFC would not be my first choice.
Fund Overview
The Flaherty & Crumrine Preferred and Income Securities Fund is a closed-end fund ("CEF") aiming to provide high current income and capital preservation.
The fund achieves its investment objective by primarily investing in a portfolio of preferred and other income producing securities that may include preferred stock, hybrid securities, contingent capital securities ("CoCos"), subordinated debt, and senior debt. The FFC fund may use leverage to enhance returns.
FFC is popular with investors, with over $1.3 billion in managed assets and $836 million in net assets for an effective leverage ratio of 37.5% as of February 3, 2023. FFC charges a 1.29% expense ratio, inclusive of the cost of leverage.
Flaherty & Crumrine Is A Specialized Preferred Manager
Flaherty & Crumrine ("F&C") is an investment manager specializing in the management of preferred and related securities since its inception in 1983. F&C has a dedicated credit research team and has been managing closed-end funds since 1991. The manager's investment approach is to manage credit risk and reinvestment risk, the main pitfalls that can trip up investors on with a high current income focus. F&C's philosophy is to identify and avoid problems early, when the cost of mitigation is relatively little.
Portfolio Holdings
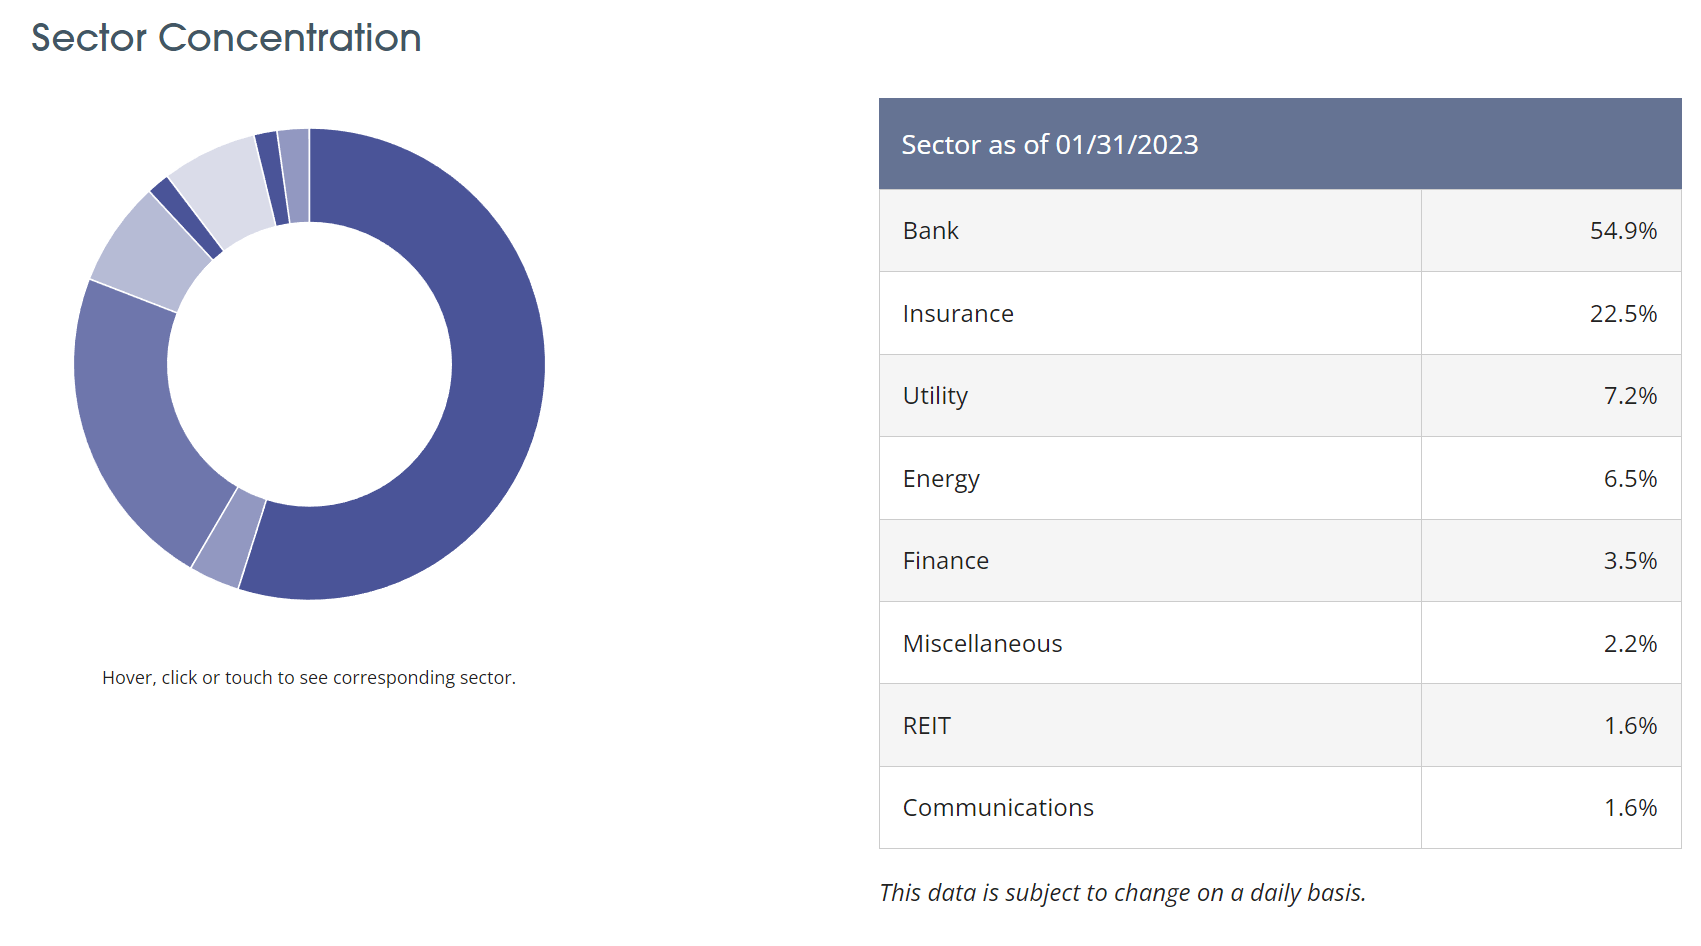
Figure 1 shows the fund's sector allocation. As financial companies are the primary issuers of preferred securities, 55% FFC's assets are invested in the banks and 23% are invested in insurance. Utilities and energy companies are also notable sector weights at 7% respectively.
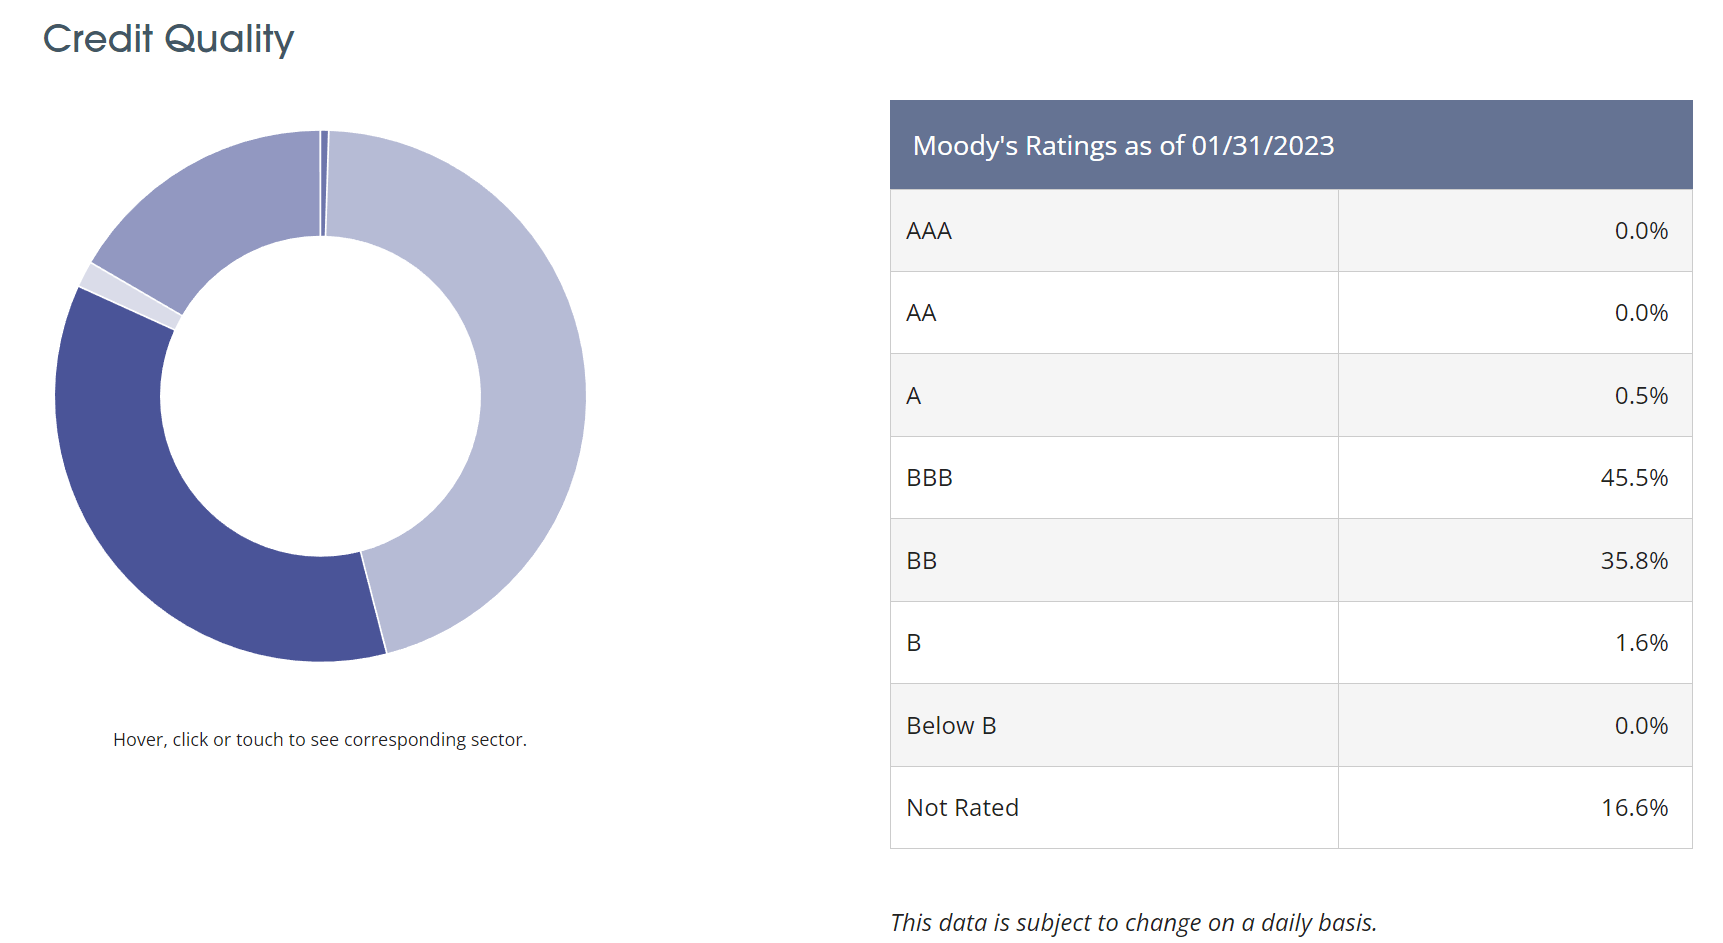
FFC's credit quality allocation is shown in figure 2. The fund has 46% of assets in BBB rated securities and 36% in BB rated securities. 17% of the fund's assets are unrated.
Figure 2 - FFC credit quality allocation (preferredincome.com)
Returns
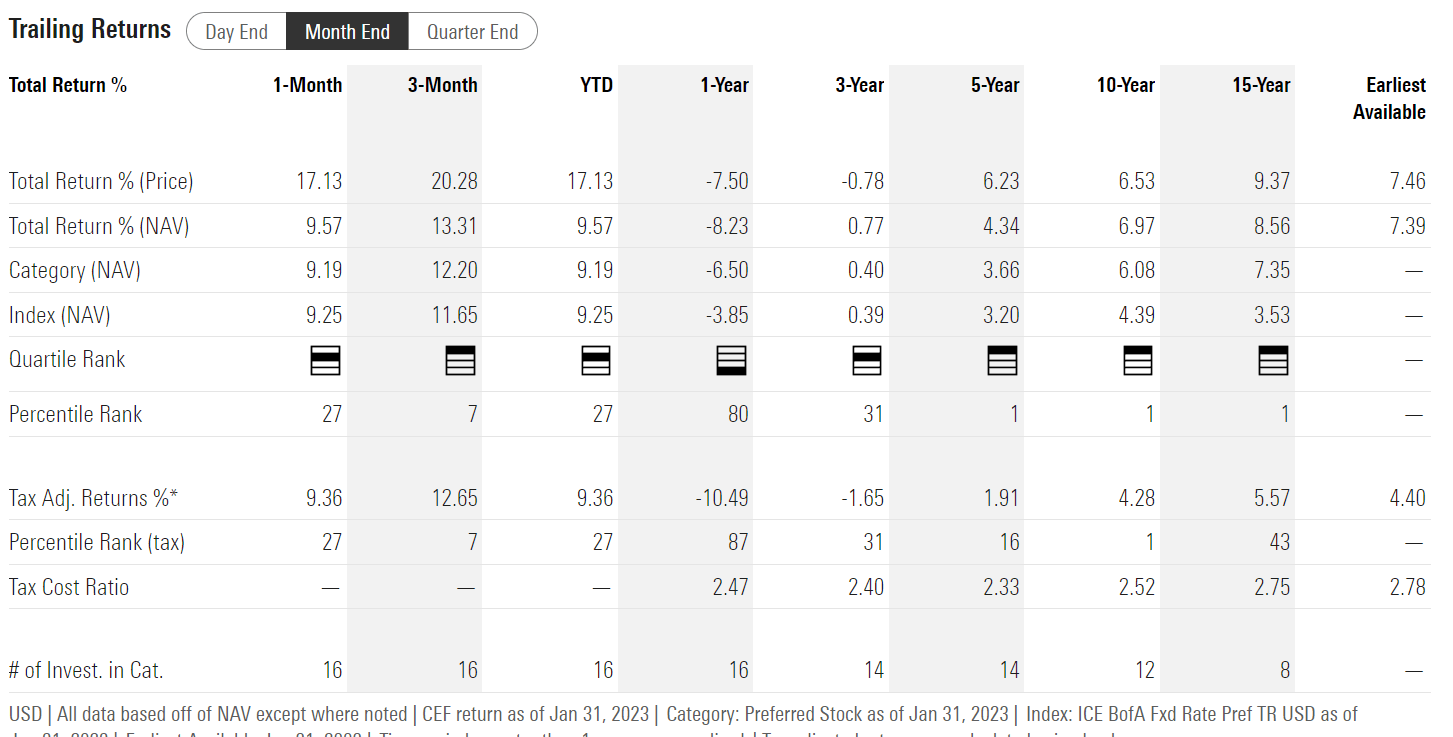
The FFC fund has had a tough 2022, returning -18.8% on a NAV basis, leading to poor 1Yr and 3Yr average annual return performance of -8.2% and 0.8% respectively to January, 31, 2023. However, the fund's long-term performance has been respectable, with 5/10/15Yr average annual returns of 4.3%/7.0%/8.6% respectively (Figure 3).
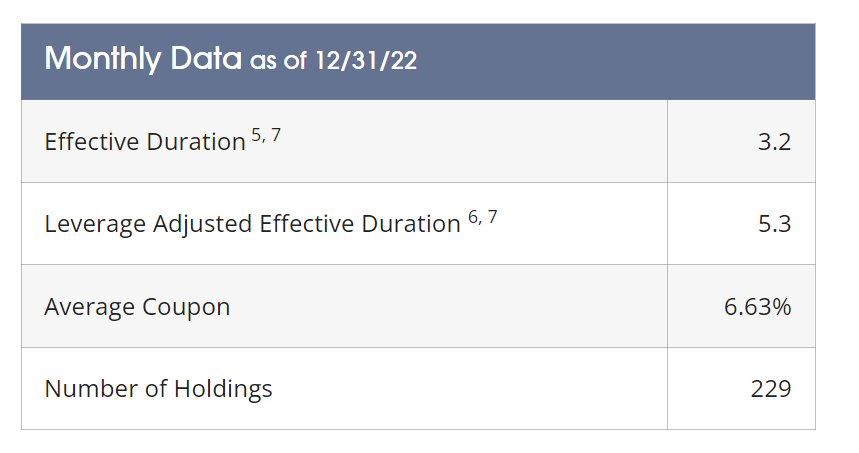
In hindsight, the downfall of FFC's 2022 returns was its leverage adjusted effective duration of 5.3 years. This means that for every 1% increase in interest rates, the portfolio is expected to lose 5.3% (Figure 4).
Figure 4 - FFC has 5.3 year effective duration (preferredincome.com)
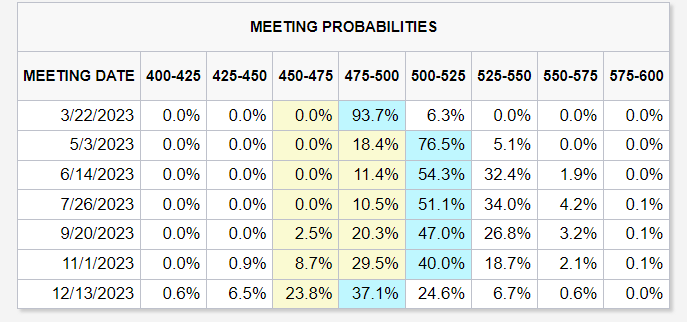
As the Fed increased the Fed Funds rate by 425 bps in 2022, FFC's portfolio was severely impacted by duration. However, if the Fed stop raising rates in 2023 and may even cut them by year end, as the markets are currently predicting, then FFC may have quite a bit of rebound potential due to its duration exposure (Figure 5).
Figure 5 - Market expects the Fed to cut rates in H2/2023 (cmegroup.com)
Distribution & Yield
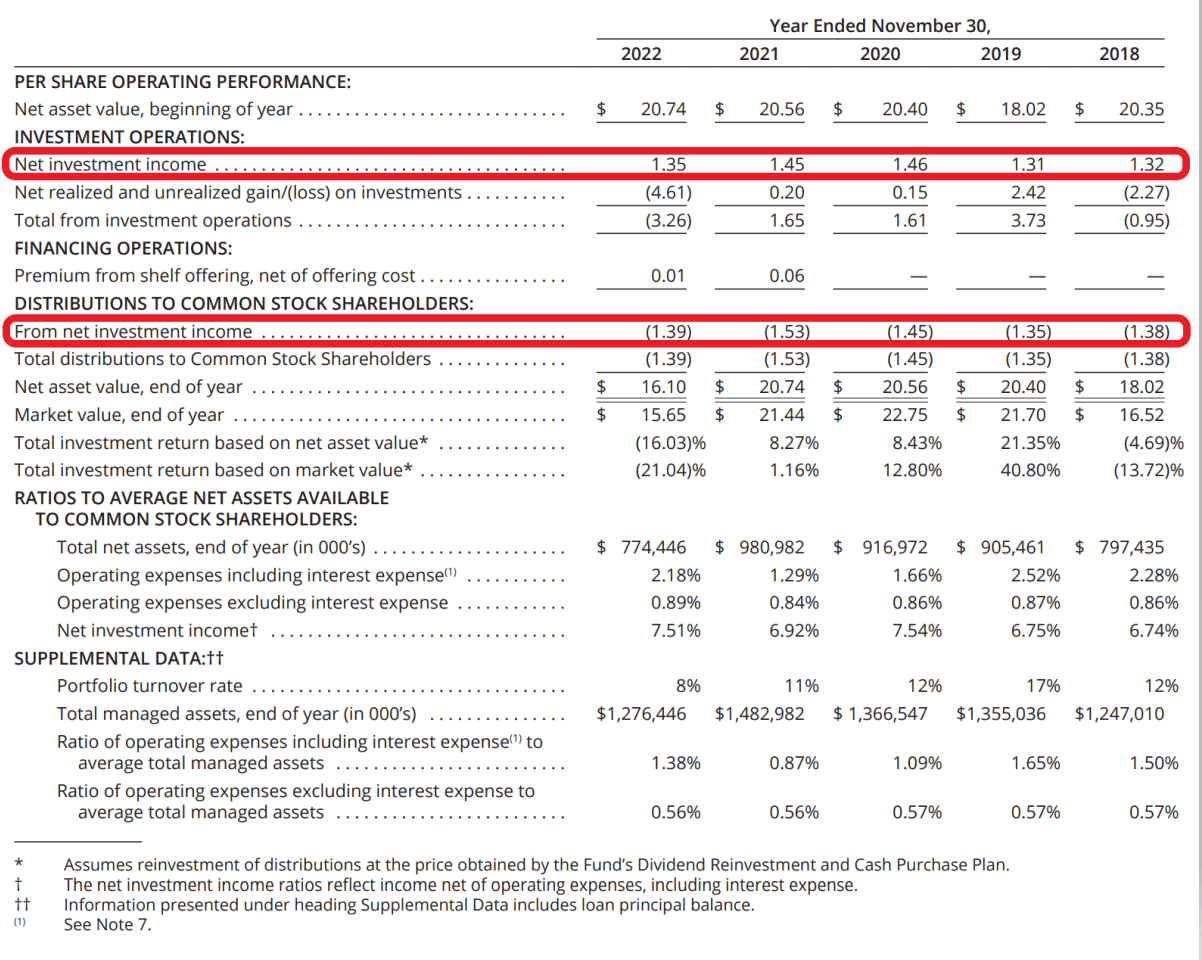
The FFC fund pays a monthly distribution, currently set at $0.093 for February 2023 to April 2023, implying a forward yield of 6.4%. Laudably, the FFC fund has historically paid distributions out of net investment income ("NII") (Figure 6). In 2022, as the fund's NAV declined due to poor investment performance, FFC decided to reduce its monthly distribution from $0.124 at the beginning of 2022 to $0.10 in September, instead of liquidating the NAV to pay an unsustainable yield.
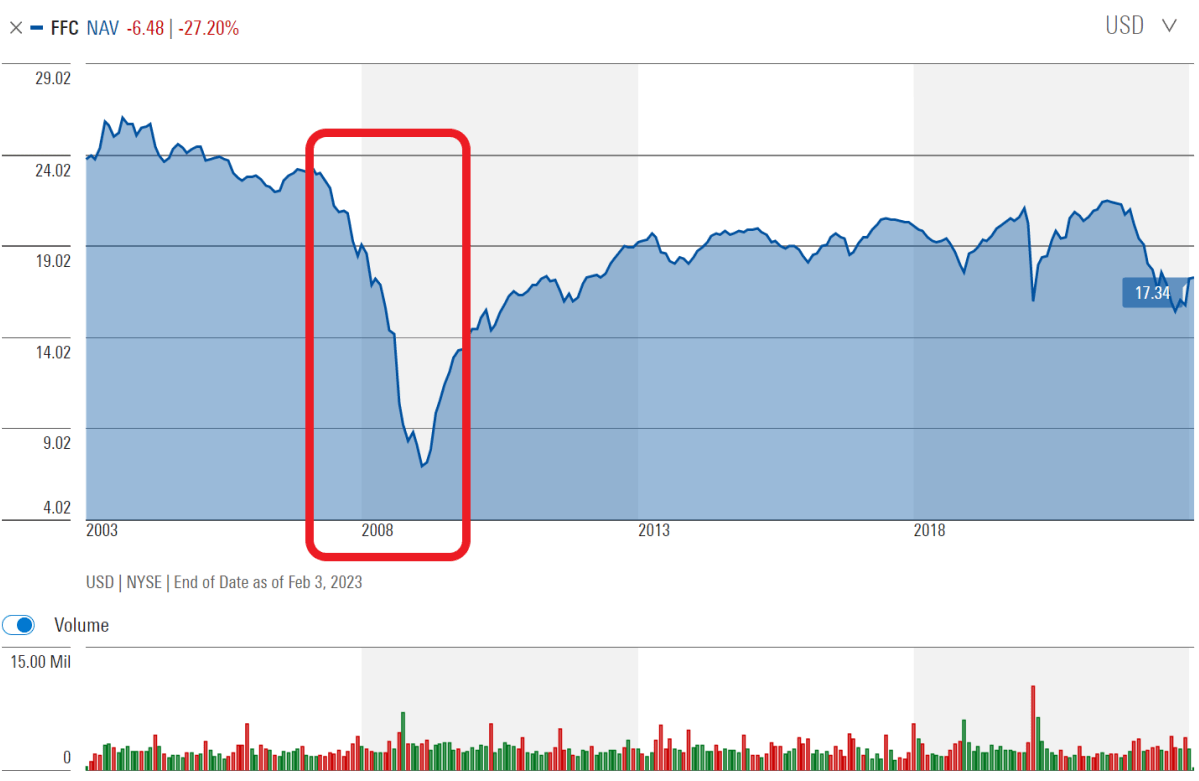
A quick check of FFC's long-term NAV confirms that FFC is not an amortizing 'return of principal' fund that I have written extensively about (Figure 7). However, FFC's long-term NAV progression does highlight a potential risk that is not often discussed, namely, its heavy concentration in the financial services sector.
Figure 7 - FFC does not have an amortizing NAV problem (morningstar.com)
As highlighted in figure 7 above, the 2008/2009 Great Financial Crisis ("GFC") was a terrible period for FFC, as many banks and insurance companies were forced to suspend their preferred dividends. In fact, some financial companies like Lehman Brothers even went bankrupt, wiping out preferred stock holders. While ultimately, most banks and insurers returned to financial health and resumed paying preferred dividends, FFC's NAV never returned to its pre-GFC peaks, indicating permanent loss of capital from the episode. If the global economy suffers a financial crisis similar in scale to the GFC, then FFC shareholders could be at risk due to its heavy concentration in financial services.
On this topic, I would point readers to listen to a recent Oddlots podcast with Steve Eisman as the featured guest. Steve Eisman, for those not familiar, is one of the main characters in Michael Lewis' The Big Short who famously predicted and profited from the 2008 GFC.
According to Mr. Eisman, although he believes the U.S. economy could go into a recession due to the Fed's interest rate hikes, he also believes the financial system is dramatically safer than before the GFC due to regulatory reforms passed after the crisis. For example, he cited Citigroup's leverage as an example; currently, Citigroup is levered 10-to-1 whereas before the GFC, it was levered 35-to-1. So while a pebble could have taken down the financial system in 2008, a meteorite will be required to cause the same kind of damage in 2023.
FFC Vs. Peers
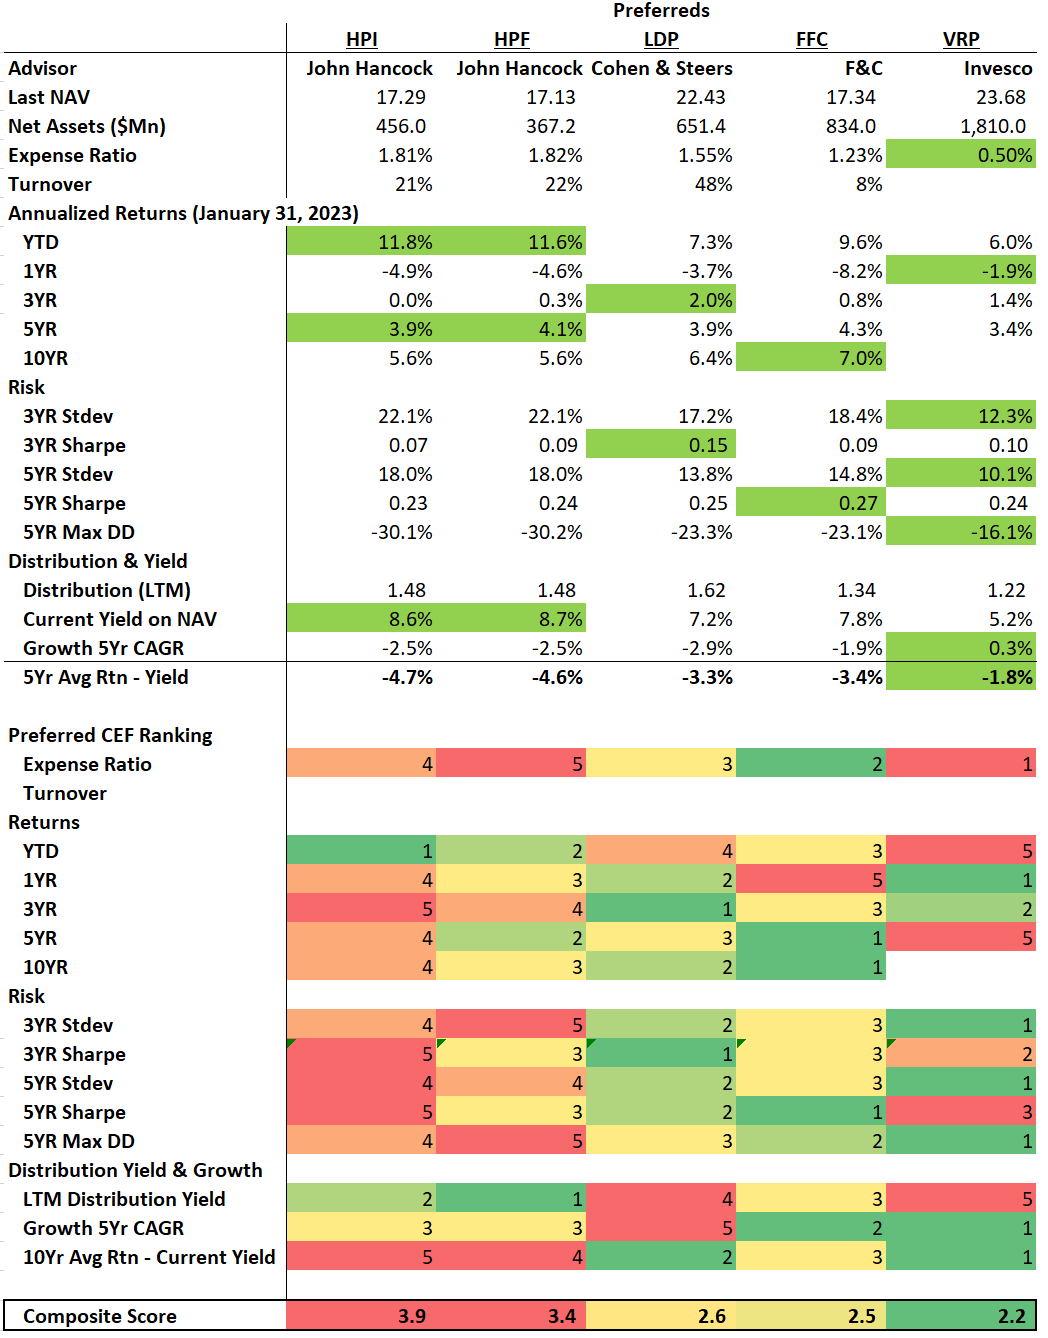
Figure 8 compares the FFC fund to peer funds like the Cohen & Steers Limited Duration Preferred & Income Fund ( LDP ) and the John Hancock Preferred Income Fund ( HPI ) using my proprietary scorecard.
In terms of returns, the FFC fund had the worst 2022 performance out of the 4 preferred CEFs that I track. This negatively dragged down its medium returns. However, FFC has the best 10Yr return out of the group.
Figure 8 - FFC vs. peers (Author created with returns and risk from Morningstar and fund details and distribution from Seeking Alpha)
In terms of risk, the FFC is more volatile than the LDP fund, but better than the John Hancock funds. Its strong long-term returns give it the best 5Yr Sharpe Ratio.
In terms of distribution, FFC's LTM distribution rate is middle of the pack. However, investors should be mindful that FFC's forward distribution annualizes to only 6.4%, so the figure above is overstated.
Overall, I would rank FFC roughly on par with LDP but ahead of the John Hancock funds. As I continue to expand my coverage of preferred CEFs, I expect to fill out this table with additional funds. So stay tuned.
Conclusion
The FFC fund provides high current income through a portfolio of preferred stocks. FFC's performance took a large hit in 2022 due to the portfolio's high duration in the face of the Fed raising interest rates. If interest rates decline, FFC may have the most rebound potential out of the peer funds I have reviewed.
For further details see:
FFC: Solid Preferred Stock Fund But Too Much Duration For My Outlook