IWF - FGRO Does Not Appear Ready For Prime Time Yet
2023-08-04 08:00:00 ET
Summary
- The Fidelity Growth Opportunities ETF is a relatively new ETF with a very high allocation to Technology and Communication Services stocks.
- This article reviews the ETF and briefly compares it to an ETF that invests in the benchmark used by FGRO and a second pure Technology ETF.
- So far, FGRO has lagged both ETFs referenced in Summary #2. That plus its short history garners a Hold rating for now.
(This article was co-produced with Hoya Capital Real Estate )
Introduction
For those in college in the later 70s, Saturday night might mean watching Saturday Night Live on NBC. The seven regular cast members were referred to as the "Not Ready for Prime Time" players as the show aired at 11:30pm in the Eastern time zone. TV's "prime time" was 8-11pm and the "better" players starred there, though many were willing to guest host SNL! Also, several SNL cast members did land other shows once a network thought them "worthy" of an earlier time slot.
When some type of investment takes in billions, others want to get into that same game, become "prime time"players" too. ETFs that invest in S&P 500 Index stocks are a good example with State Street, Vanguard, and iShares all having plain vanilla versions, and there are at least two dozen other ways to play those Large-Cap stocks.
The Fidelity Growth Opportunities ETF ( FGRO ) entered the competition in the winter of 2021. I included a section where I compare this "newbee" against one or two of these growth ETFs.
With barely over two years of results, the Fidelity Growth Opportunities ETF has shown me that it is not ready for "prime time" consideration yet. At the end of this article, I list reasons why I would not consider this ETF currently. As with the SNL cast, it has potential so I would rate it a Hold at this point.
Fidelity Growth Opportunities ETF review
Seeking Alpha describes this ETF as:
The Fidelity Growth Opportunities ETF is an actively managed ETF. The fund invests in growth stocks of companies across diversified market capitalization. The fund employs fundamental analysis with bottom-up stock picking approach to create its portfolio. It uses the Russell 1000 Growth Index as its benchmark. FGRO started on 2/2/2021.
Source: seekingalpha.com FGRO
FGRO has $177m in AUM and charges 59bps in fees, about average for an non-index-based ETF. Fidelity posts a 1.13% TTM Yield for their ETF.
Index review
FGRO does not manage to a benchmark like the other ETFs mentioned above do, but some understanding of the comparison index should give insight to what the FGRO ETF managers are thinking. FTSE Russell describes the index as:
The Russell 1000® Growth Index measures the performance of the largecap growth segment of the US equity universe. It includes those Russell 1000 companies with relatively higher price-to-book ratios, higher I/B/E/S forecast medium term (2 year) growth and higher sales per share historical growth (5 years). The Russell 1000® Growth Index is constructed to provide a comprehensive and unbiased barometer for the large-cap growth segment. The index is completely reconstituted annually in June to ensure new and growing equities are included and that the represented companies continue to reflect growth characteristics.
Source: research.ftserussell.com Index
FGRO holdings review
This ETF follows unusual rules in posting what the ETF holds each day. Fidelity provides this explanation, which includes the risks this adds.
This ETF is different from traditional ETFs. Traditional ETFs tell the public what assets they hold each day. This ETF will not. This may create additional risks for your investment. For example: You may have to pay more money to trade the ETF’s shares. This ETF will provide less information to traders, who tend to charge more for trades when they have less information. The price you pay to buy ETF shares on an exchange may not match the value of the ETF’s portfolio. The same is true when you sell shares. These price differences may be greater for this ETF compared to other ETFs because it provides less information to traders. These additional risks may be even greater in bad or uncertain market conditions. The ETF will publish on its website each day a “Tracking Basket” designed to help trading in shares of the ETF. While the Tracking Basket includes some of the ETF’s holdings, it is not the ETF’s actual portfolio.
Source: digital.fidelity.com FGRO tracking basket
Readers with a Fidelity account can view the tracking basket, which gives current "holdings", otherwise, the 6/30/23 data is the most current available.
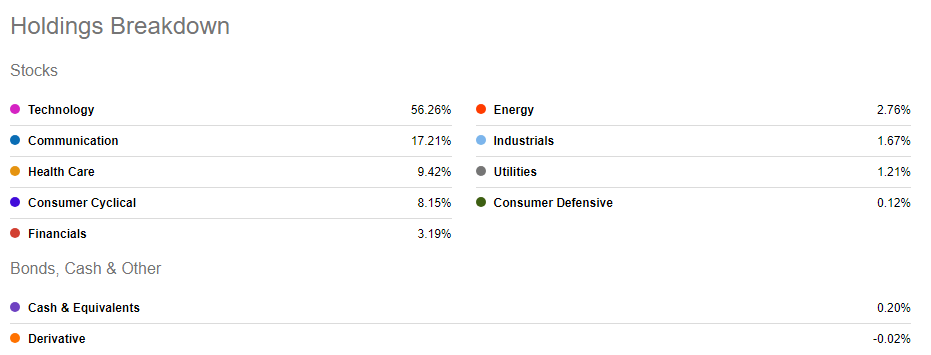
Technology and Communications Services (CS) sectors account for almost 75% of this ETF! Also, one has to remember many CS stocks are highly dependent on technology to deliver what their customers desire. The weight in Technology tops both what the Invesco QQQ Trust ( QQQ ) and the SPDR S&P 500 ETF ( SPY ), two popular choices for such exposure. Later, I will compare these sector allocations against the IWF ETF mentioned earlier. FGRO has no exposure to two sectors: Real Estate or Materials; understandable for a growth-focused ETF.
seekingalpha.com FGRO holdings
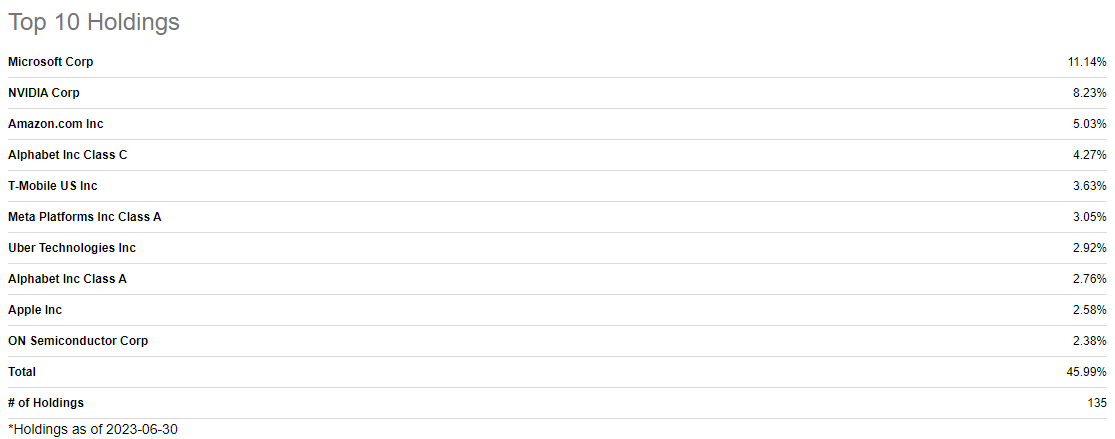
Besides the sector concentration risk mentioned above, there is also concentration risk with the individual holdings as Microsoft ( MSFT ) has 11+% weight and two others top 5%. As shown, ten stocks account for over 45% of the total portfolio of 135 stocks. Without access to a readable holdings list, I am not able to see how much the lower half of the portfolio means to the generating results. NVIDIA ( NVDA ), the second largest holding, while still rated a Buy by both SAS and Wall Street analysts, is up almost 150% in the past year, raising concern, at least to me, that its valuation is getting extreme.
Also notice how low Apple ( AAPL ) is, only 2.58% compared to being the biggest holding in IWF where the weight is 13.05%! How holdings are weighted is part of the "black box" Fidelity uses and doesn't disclose. FGRO holders obviously need a very positive outlook on the Tech sector to even consider owning this ETF. If the FOMC does not pull off the "soft landing" investors seem to be betting on happening, the stocks that FGRO holds could be some of the bigger casualties.
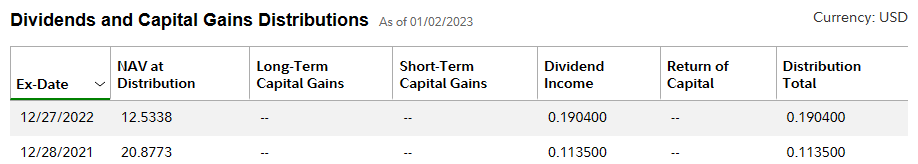
FRGO distribution review
Based on its short history, it appears this ETF has adopted a year-end only distribution policy.
Considering the negligible amount, I doubt investors owning this ETF worry/care about that fact.
Comparing FGRO and IWF ETFs
The reason to own FGRO over IWF is to gain Alpha for your portfolio. As mentioned, FGRO benchmarks against the index that drives the holdings of the IWF ETF. Comparing the two ETFs gives some insight to Fidelity's "black box" algorithm and if investors think the strategy will produce that Alpha for them.
advisors.vanguard.com product compare
The biggest differences is in market-cap allocations, with FGRO holding much more weight below Large-Cap stocks. FGRO also has 7% more in Growth stocks than IWF does. In my view, that helps explain FGRO having a higher StdDev than IWF as Growth stocks should be more volatile compared to Value stocks. One advantage of the sub-LC extra weight is those stocks have less Wall Street coverage. Based on the Efficient Market Theory , that is where investors should earn Alpha as more becomes known about those stocks. Since FGRO doesn't claim to be a LC-focused ETF, I have no issue with the difference in market-cap allocations compared to IWF.
The next table shows sector shifts where FGRO is investing differently than what the benchmark ETF holds. Sectors where the weight differs by more than 4% are shaded in Yellow.
morningstar.com; compiled by Author
As mentioned above, one of those sectors is Technology, with Communication Services being the next over-allocation. FGRO is under allocated in both Consumer sectors, which I find inconsistent for the Consumer Cyclical sector considering where the over-allocations are. These must be the results of the algorithm used by FGRO and where they are hunting for Alpha.
Performance results for all three ETFs
As I mentioned, here I decided to include the IYW ETF since FGRO has such a large Technology exposure. Readers can ignore those results if they disagree.
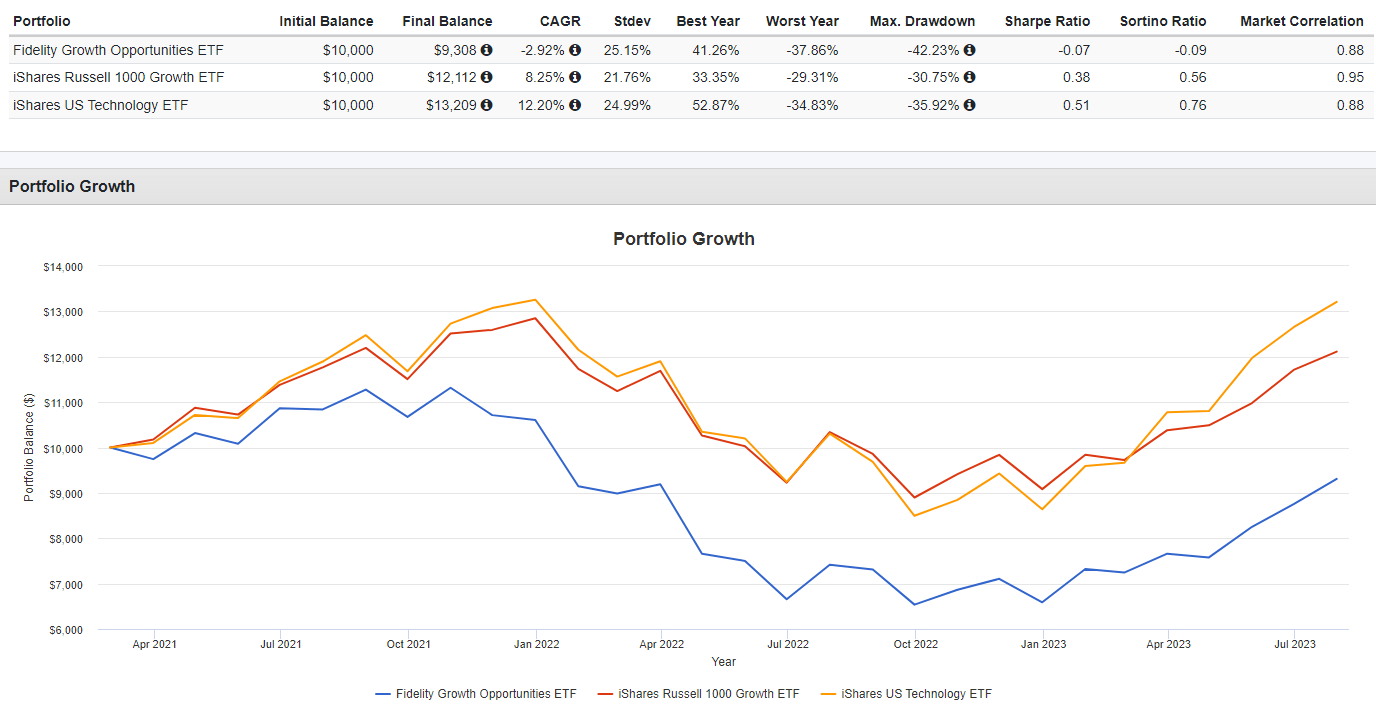
FGRO stumbled right out of the gate, though it has started to redeem itself over the past year, but still trails the pure Technology ETF even over that shorter time period: not unexpected considering what large Tech stocks have done recently.
Portfolio strategy
I have to admit I like owning ETFs that are not tied down to an index; ones like FGRO. I add these to my allocation after building a based of what I call my Core ETFs; ones that do invest based on an index. That adds comfort that I will be matching benchmarks for a large part of my allocation yet have other funds that can "beat the benchmark" and add Alpha. I am in a situation where I do not need my Alpha-generators hitting homers, just lots of singles will do. Translation: I'm willing to take risks but hopefully in a measured way. One measure is wanting at least five years of history before adding an ETF like FGRO to my portfolio. Even if FGRO was the current top performer and I needed more Technology exposure, just over two years of history means it might not make the cut. As with most rules, I am willing to make exceptions.
For me, while not giving FGRO a Sell rating due to its performance history, I will hold off owning it for the following reasons, which obviously do not apply to all investors.
- Preference for funds with more history. FGRO has just over two years.
- Preference for my Alpha-generators investing where analyst coverage is more sparse. Large-Cap Tech stocks are the opposite of that.
- Preference for my Alpha-generators to be pure plays, which I admit usually requires compromise in one of the major variables like market-cap, Growth/Value, or single-sector factors.
- Preference to get paid while I wait. Understanding Tech stocks pay less in dividends does mean I would accept less from those funds.
Final thoughts
Unlike index-based strategies or even most actively-managed ETFs, FGRO's higher level of secrecy makes risk analysis very hard to quantify. Investors are totally dependent on the skills of the ETF's managers, so an important risk management step is being aware if those folks change. Other Fidelity funds struggled after manager changes. I also remember their EM MF imploding after the managers made major bets that blew up so keeping an eye on sector and individual stock weights would be the second important risk control step to take.
My above preferences also summarize where I could see the risk of holding FGRO to be more than what I need at this time in life. I will come back in the winter of 2025 and see how FGRO has done compared to these or similar ETFs after it passes its fourth birthday. For now, FGRO gets a Hold rating.
For further details see:
FGRO Does Not Appear Ready For Prime Time Yet