FID - FID: International Dividend ETF Lagging The Competition
2023-04-04 07:59:43 ET
Summary
- FID invests in dividend aristocrats outside the U.S.
- Its top sector is financials, and its top country is Canada.
- It has a 16% exposure to China through companies listed in Hong Kong.
- The fund has lagged at least 6 competitors since 2016.
- Since inception, it has suffered significant losses, both in share price and in distribution per share.
This article series aims at evaluating ETFs regarding past performance and portfolio quality. As holdings change over time, updated reviews are posted when necessary.
FID strategy and portfolio
First Trust S&P International Dividend Aristocrats Fund ( FID ) has been tracking the S&P International Dividend Aristocrats Index since 8/22/2013. It has 77 holdings, a 12-month distribution yield of 4.14% and a total expense ratio of 0.60%. Distributions are paid quarterly.
As described by First Trust , eligible stocks must:
- Be constituents of the S&P Global Broad Market Index, excluding the U.S.
- Have an average daily traded value of at least $5 million and a float-adjusted market capitalization of at least $1 billion
- Not have decreased dividends any year for at least 10 consecutive years
- Have positive earnings per share
- Have a dividend payout ratio inferior or equal to 100% for addition to the index
- Have an indicated dividend yield inferior or equal to 10%
Then, stocks with the highest indicated dividend yield are considered, with a maximum of 20 stocks by country and a maximum of 35 stocks by GICS sector. On every annual reconstitution, constituents are weighted based on dividend yield, with a limit of 3% by constituent and 25% by country and sector.
About 58% of asset value is in large and mega-cap companies, and 40% in mid-caps. Asia is the heaviest region (44%), followed by Europe (29%) and North America (25%). The top 3 countries are Canada (25.5%), Japan (19%) and Hong Kong (16%). The latter represents a significant exposure to geopolitical and regulatory risks related to China. Other countries are below 10%. The next chart plots the top 10 countries, which represent 94% of asset value.
Country allocation (chart: author; data: First Trust)
Financials are the heaviest sector (25.3%), followed by real estate (16.1%), utilities (15.5%) and industrials (12.4%). Other sectors are below 7% individually and 31% in aggregate.
Sector breakdown (chart: author; data: First Trust)
For valuation and performance, I will take as a benchmark the MSCI ACWI ex USA Investable Market Index, represented in the next table by iShares Core MSCI Total International Stock ETF ( IXUS ). FID is significantly cheaper regarding all the usual valuation ratios.
| FID |
| IXUS |
| Price / Earnings TTM |
| 10.49 |
| 12.44 |
| Price / Book |
| 0.95 |
| 1.6 |
| Price / Sales |
| 0.69 |
| 1.21 |
| Price / Cash Flow |
| 7.81 |
| 8.63 |
The fund is well-diversified: the top 10 holdings, listed below, represent only 18% of asset value. The heaviest one weighs 2.02%, so risks related to individual stocks are low.
| Name |
| Identifier |
| Sector |
| Weight |
| New World Development Company Limited |
| 17.HK |
| Real Estate |
| 2.02% |
| Adecco Group AG |
| ADEN.SW |
| Industrials |
| 1.99% |
| Lenovo Group Limited |
| 992.HK |
| Information Technology |
| 1.96% |
| A2A SpA |
| A2A.IM |
| Utilities |
| 1.94% |
| US Dollar |
|
|
| Other |
| 1.71% |
| Guangdong Investment Limited |
| 270.HK |
| Utilities |
| 1.66% |
| BASF SE |
| BAS.GY |
| Materials |
| 1.64% |
| Bouygues S.A. |
| EN.FP |
| Industrials |
| 1.63% |
| Legal & General Group Plc |
| LGEN.LN |
| Financials |
| 1.60% |
| Longfor Group Holdings Limited |
| 960.HK |
| Real Estate |
| 1.58% |
FID vs. competitors
The next table compares the fund's performance and risk metrics with other non-hedged international dividend funds since 1/1/2016: Schwab Fundamental International Large Company Index ETF ( FNDF ), iShares International Select Dividend ETF ( IDV ), Invesco FTSE RAFI Developed Markets ex-U.S. ETF ( PXF ), First Trust Dow Jones Global Select Dividend Index ETF ( FGD ), SPDR S&P Global Dividend ETF ( WDIV ), and Xtrackers MSCI EAFE High Dividend Yield Equity ETF ( HDEF ).
| since Jan.2016 |
| Total Return |
| Annual Return |
| Drawdown |
| Sharpe ratio |
| Volatility |
| FID |
| 32.36% |
| 3.94% |
| -39.78% |
| 0.29 |
| 16.89% |
| FNDF |
| 63.17% |
| 6.98% |
| -40.14% |
| 0.44 |
| 17.04% |
| IDV |
| 45.67% |
| 5.32% |
| -42.50% |
| 0.34 |
| 18.04% |
| PXF |
| 56.96% |
| 6.41% |
| -41.59% |
| 0.41 |
| 17.48% |
| FGD |
| 51.14% |
| 5.86% |
| -44.84% |
| 0.35 |
| 18.86% |
| WDIV |
| 44.99% |
| 5.26% |
| -42.35% |
| 0.33 |
| 16.48% |
| HDEF |
| 47.77% |
| 5.53% |
| -36.43% |
| 0.39 |
| 15.55% |
| IXUS (bench.) |
| 53.63% |
| 6.10% |
| -36.22% |
| 0.41 |
| 15.79% |
Data calculated with Portfolio123
FID is the worst performer in this list regarding total return and risk-adjusted performance (Sharpe ratio). Only two funds beat the benchmark IXUS: FNDF and PXF.
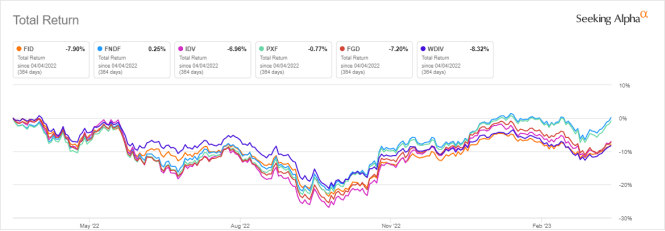
In the last 12 months, FID is in the middle of the pack, whereas FNDF and PXF are leading again.
FID vs. Competitors, last 12 months (Seeking Alpha)
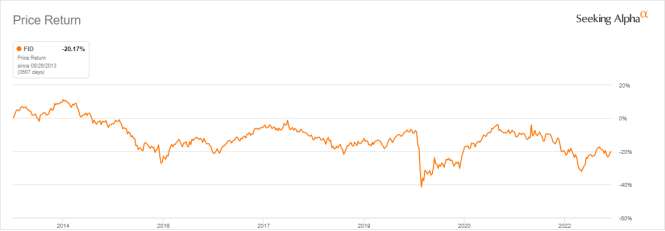
In fact, FID has suffered a capital decay of 20% since inception (measured in share price).
FID share price return (Seeking Alpha)
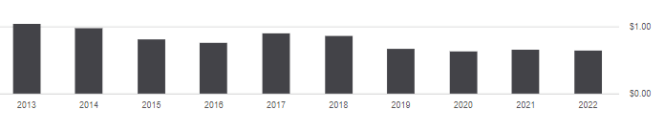
The annual sum of distributions was $1.05 per share in 2013 and $0.65 in 2022. It means a loss of 38% in income stream. To make things worse, the cumulative inflation has been 27% in the same time (based on CPI).
Takeaway
First Trust S&P International Dividend Aristocrats Fund holds 77 stocks of ex-U.S. companies with growing, or at least stable dividends. The heaviest countries in the portfolio are Canada and Japan. Hong Kong comes in 3rd position with 16% of asset value, which represents a significant exposure to geopolitical and regulatory risks related to China. The top 3 sectors are financials, utilities and real estate. Valuation ratios look attractive relative to a global ex-U.S. benchmark. However, past performance is underwhelming: FID has lagged at least 6 other non-hedged international dividend ETFs since January 2016. Moreover, since inception in 2013, it has lost 20% in share price and 38% in distribution.
For further details see:
FID: International Dividend ETF Lagging The Competition