FIDI - FIDI: Unconvincing International ETF
2023-07-09 09:11:39 ET
Summary
- Fidelity International High Dividend ETF holds about 100 stocks, mostly large companies based in Europe, Canada and Japan.
- It is well-diversified across holdings, but overweight in financials.
- FIDI has underperformed two of its close competitors.
- The shares have lost over 26% since 2018 and distributions couldn’t keep pace with inflation.
This dividend ETF article series aims at evaluating products regarding the relative past performance of their strategies and quality of their current portfolios. As holdings and their weights change over time, reviews may be updated when necessary.
FIDI strategy and portfolio
Fidelity International High Dividend ETF ( FIDI ) started investing operations on 01/16/2018 and tracks the Fidelity International High Dividend Index. It has a portfolio of 104 stocks, a dividend yield of 4.99% and a total expense ratio of 0.39%. It pays quarterly distributions.
As described by Fidelity, the underlying index:
is designed to reflect the performance of large and mid-capitalization developed international high dividend-paying stocks that are expected to continue to pay and grow their dividends.
Over 82% of asset value is in large and mega-cap companies. The heaviest country in the portfolio is Japan (20.3%), followed by Canada (13.7%) and the U.K. (12.5%). Other countries are below 9%. European countries have an aggregate weight of 48.4% vs. 36.7% for Asia. The next chart lists the top 10 countries, representing about 91% of assets. Hong Kong, which may represent a geopolitical and regulatory risk related to China, weighs only 4.7%.
Country allocation (Chart: author; data: Fidelity)
The portfolio is overweight in financials (27.3% of assets). Utilities, communication and materials are between 11% and 13% each. Other sectors weigh no more than 10% individually and 33% in aggregate.
Sector breakdown (Chart: author; data: Fidelity)
The next table compares aggregate valuation ratios of FIDI and two of its closest competitors, both unhedged high-yield international equity ETFs:
- Xtrackers MSCI EAFE High Dividend Yield Equity ETF ( HDEF )
- iShares International Select Dividend ETF ( IDV )
| FIDI |
| HDEF |
| IDV |
| Price/earnings TTM |
| 8.44 |
| 8.99 |
| 5.57 |
| Price/book |
| 0.94 |
| 1.47 |
| 0.83 |
| Price/sales |
| 0.91 |
| 0.86 |
| 0.73 |
| Price/cash flow |
| 5.23 |
| 5.79 |
| 3.96 |
FIDI and HDEF look similar in valuation (FIDI has a lower price-to-book though), while IDV is significantly cheaper regarding all these metrics.
The top 10 holdings, listed below, represent 25.7% of asset value. The heaviest one weighs less than 4%, so risks related to individual companies are moderate.
| Primary listing ticker |
| Enel SpA |
| 3.73 |
| ENEL |
| Terna SpA |
| 3.39 |
| TRN |
| Daiwa House Industry Co Ltd |
| 3.21 |
| 1925 |
| Telefonica SA |
| 3.08 |
| TEF |
| Algonquin Power & Utilities Corp |
| 2.91 |
| AQN |
| Power Assets Holdings Ltd |
| 2.61 |
| 6 |
| Nintendo Co Ltd |
| 2.56 |
| 7974 |
| Vodafone Group PLC |
| 2.33 |
| VOD |
| BCE Inc |
| 2.32 |
| BCE |
| SoftBank Corp |
| 2.32 |
| 9434 |
Historical performance
Regarding total return since February 2018, FIDI is in loss and lags its 2 competitors (including dividends).
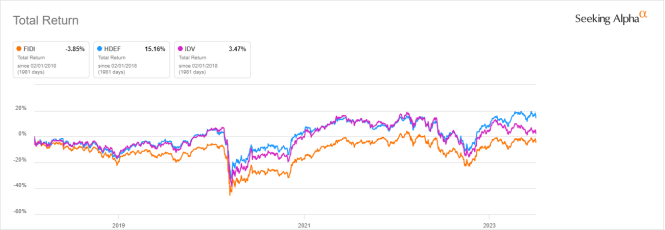
In 2023 to date, FIDI is close behind HDEF and beats IDV by almost 5 percentage points.
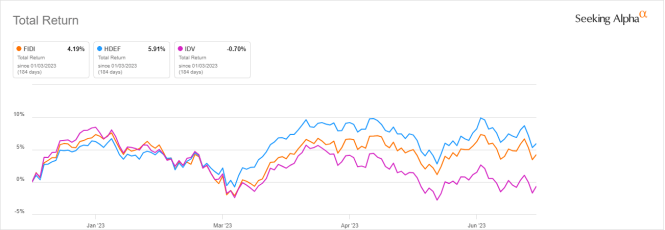
The annual sum of distributions was $0.92 per share in 2019 and $0.95 in 2022. This 3.3% growth is far behind the cumulative inflation: about 15%, based on CPI. Moreover, the share price has lost more than 26% since inception, representing a large capital decay for shareholders.
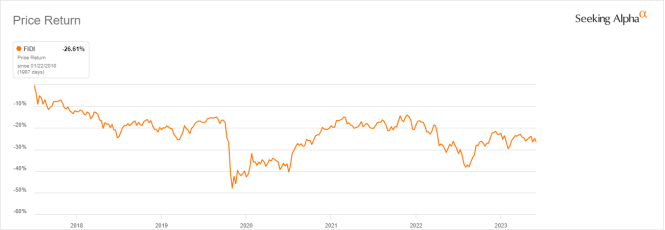
Takeaway
Fidelity International High Dividend ETF is an international high-yield equity ETF holding about 100 stocks, mostly large companies based in Europe, Canada and Japan. It is well-diversified across holdings, but it is overweight in financials. Since its inception in 2018, FIDI has underperformed two close competitors, HDEF and IDV. Moreover, the share price has lost over 26% and distributions couldn’t keep pace with inflation.
For further details see:
FIDI: Unconvincing International ETF