FDUS - Fidus Investment: Another Quarter Of Dividend Hikes And Outperformance
2023-03-14 08:51:28 ET
Summary
- We discuss quarterly results from the BDC Fidus Investment and highlight key income dynamics of the portfolio.
- The company delivered a 3.4% total return over Q4, extending its impressive outperformance streak.
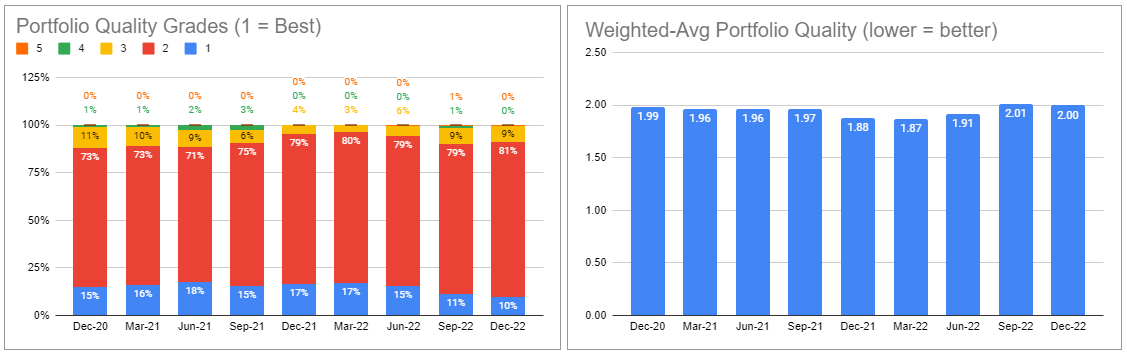
- The base dividend was raised once again while portfolio quality remained stable.
- FDUS valuation is no longer obviously cheap though we consider it to be at the cheaper end of its fair-value range. We continue to hold FDUS stock in our High Income Portfolio.
In this article, we catch up on Q4 results from the business development company Fidus Investment ( FDUS ). FDUS trades at a 13.5% total dividend yield and a 101% valuation.
The company continued to outperform the sector. It also increased its total dividend by 8% to $0.66. This is composed of a 2 cent uptick in the base dividend to $0.41, a $0.15 supplemental dividend and a series of $0.10 quarterly special dividends for each quarter in 2023.
The breakdown of the dividend into three different components is arguably unnecessarily complicated, however, each has a role to play. The base dividend targets the floor the company expects to generate in net income. The supplemental covers the gap between net income and the base dividend. The special dividend is there to gradually push the spillover lower, so it is closer to its target of 3 quarters of the base dividend.
The company also declared a deemed dividend at the end of 2022 of $1.65 per share (large relative to the $2 per share of total dividends paid in 2022). This allows the company to retain the capital and compound it into new lending. The transcript has a very good and lengthy description of how a deemed dividend works so it's worth reading for curious investors.
Quarter Update
Both GAAP and adjusted (i.e. adjusted for incentive fees) net income was pretty flat versus Q3.
Systematic Income BDC Tool
This is despite a strong rise in total investment income as shown below. The key culprits which kept net income subdued was a sizable tax charge (related to the annual excise tax accrual from the large spillover) as well as an increase in general and administrative expenses (due to the ATM program and sundry audit and tax compliance billings).
Systematic Income BDC Tool
The NAV was pretty flat over the quarter despite dividend payments exceeding net income (which would otherwise push NAV lower).
Income Dynamics
Net investment activity was pretty flat as repayments and sales nearly matched new investments. Management gave a sense on the call that the company is struggling to find new investments in excess of its level of repayments. The combination of relatively slow deal activity, robust repayments and decent lending demand on the part of a number of other BDCs kept new investments subdued for FDUS.
Systematic Income BDC Tool
Portfolio yield has increased to 13.8% and stands 2.4% above the median BDC level, allowing FDUS to generate a respectable net income yield despite a subdued level of leverage. FDUS boasts one of the very lowest interest cost profiles, even below the highest-rated BDCs, due to its opportunistic bond issuance, entirely fixed-rate profile and significant SBIC issuance. Its earliest unsecured debt maturity is in 2026.
Systematic Income BDC Tool
Management mentioned it is likely to start using a line of credit (i.e. a floating-rate instrument) in order to take advantage of new opportunities as its leverage is very low - about 0.3x below the sector average and well below its target of 1x.
Systematic Income BDC Tool
FDUS has an unusual floating-rate asset and liability profile. Its floating-rate assets are only 71% of its portfolio vs. a 96% median level. However, all of its liabilities are fixed-rate - well below the 48% median sector level. Combined with its low leverage level, its net income beta is fairly subdued at 8.4% for a 1% rise in short-term rates vs. a 10.7% median BDC level. Overall this means FDUS has not benefited as much as the rest of the sector from the rise in short-term rates.
Systematic Income BDC Tool
Portfolio Quality
One more company went on non-accrual during Q4. Non-accruals on fair-value, however, remain well below the sector median and average levels.
Systematic Income BDC Tool
Portfolio quality according to internal ratings was pretty flat during the quarter.
PIK ticked lower and remains well below the sector average and median levels.
Systematic Income BDC Tool
The company continued to pivot its portfolio to debt investments, particularly first-lien loans. Oddly, it targets its 10% equity allocation cap on a cost rather than fair-value basis. Its equity allocation on cost was 7.3% despite being double that on a fair-value basis. This suggests that we shouldn't expect a similarly rapid pace of its equity portfolio unwind going forward. This is likely to keep its net income from rising rapidly.
Systematic Income BDC Tool
The company generated net realized gains for 8 quarters running - all part of its unwind of the large equity portfolio that has grown in size due to strong performance.
Systematic Income BDC Tool
FDUS shows interest coverage on a LTM basis which will strike investors as oddly high at 3.8x where other BDCs show interest coverage closer to 2x however this lower number is with respect to Q4 only. That said, interest coverage managed to increase over the last couple of quarters - an unusual and welcome profile due to a rotation towards lower-leverage companies.
Return And Valuation Profile
FDUS is one of the best-performing BDCs in our coverage. What's particularly interesting is the divergence in its performance over shorter-time periods. In other words, the outperformance of FDUS has increased more recently - a dynamic that is particularly important in BDC allocation, in our view.
Systematic Income BDC Tool
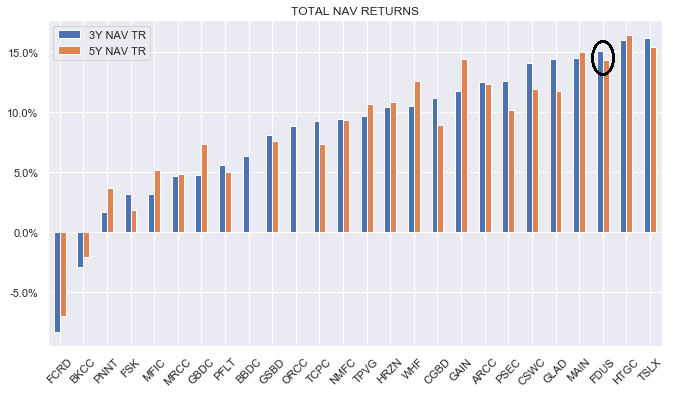
Apart from performance against the average, we like to check in on individual BDC performance as the average can be pulled lower by a handful of horrendous BDCs (e.g. FCRD, BKCC). On this metric, FDUS is near the top of the sector for 3Y and 5Y total NAV returns.
What's also important about BDC performance is consistency. In other words, it's easy enough to find BDCs with strong overall performance but whose performance was stellar several years ago, having come down to earth more recently. That isn't the case with FDUS. As the following chart shows it has consistently outperformed the sector.
Systematic Income BDC Tool
FDUS is not alone in strong performance. However, what sets it apart from other double-digit return performers like [[TSLX]], [[HTGC]] and [[MAIN]] is its still reasonable valuation. Only [[GAIN]] looks better in valuation terms among these strong performers. However, GAIN has a highly undiversified portfolio and is riskier in that sense in our view.
Systematic Income BDC Tool
Although FDUS valuation compares favorably to other strong performers, it is far from cheap relative to its own valuation history. As the following chart shows, its current valuation of 101% is around 5% above its historic average level, even after the recent deflation.
Systematic Income
FDUS valuation has flipped recently. It used to trade cheaper versus the sector until about 2022 at which point it started trading richer to the sector average valuation.
Systematic Income
The following chart shows this more clearly. Its 12% premium to the sector average is the highest in at least 8 years. On this metric, FDUS is no longer cheap. That said, this valuation premium is still very reasonable relative to the company's outperformance in our view.
Systematic Income
Points Of Differential
In this section we highlight the key "tilts" or structural features of FDUS and how they compare to the broader sector.
Unlike some of the larger BDCs like [[ARCC]], [[OCSL]] and [[BXSL]], FDUS is focused primarily on the lower segment of the middle-market sector with EBITDA between $5 and 30m. This makes it a good pairing with these larger BDCs.
Second, FDUS continues to have a relatively high equity portfolio at around 14% or nearly 3x the median BDC. This is unlikely to move all the way down towards the median BDC level of 5% given it's already below the company's allocation cap.
Takeaways
FDUS continues to outperform the sector while growing its net income and raising the dividend. The company's valuation is no longer obviously attractive but remains in the fair-value range in our view. We continue to hold the stock in our High Income Portfolio.
For further details see:
Fidus Investment: Another Quarter Of Dividend Hikes And Outperformance