FDUS - Fidus Q3 Update: Another Dividend Hike For This 16.5% Yielding BDC
2023-11-16 12:30:42 ET
Summary
- We take a look at Q3 results for Fidus Investment Corp.
- Fidus Investment reported a 10% increase in adjusted net income in Q2 and a rise in the NAV.
- The company declared a total dividend of $0.80, an 11% increase from the previous quarter. Its dividend growth has outpaced the sector.
- We recently topped up our FDUS allocation when its valuation moved briefly below the sector average.
In this article, we catch up on Q3 results from the Business Development Company Fidus Investment ( FDUS ). FDUS trades at a total dividend yield of 16.5% and a 101% valuation.
FDUS invests in the lower middle-market segment and is overweight the Technology sector.
FDUS
Quarter Update
Adjusted net income rose once again, this time by close to 10% from the previous quarter.
Systematic Income CEF Tool
The increase was driven primarily by interest income, including PIK income, as base rates pushed slightly higher over the quarter.
Systematic Income CEF Tool
GAAP net income fell, however, as a result of accrued incentive fees.
The company declared a total dividend of $0.80 - an 11% increase from the prior quarter. As many FDUS investors may know, the company's dividend is composed of three parts. The base dividend targets the floor the company expects to generate in net income. The supplemental covers the gap between net income and the base dividend. The special dividend is there to gradually push the spillover lower, so it is closer to its target of 75% of the base dividend.
The company's dividend growth has significantly outpaced the rest of the sector.
Systematic Income CEF Tool
This is, in part, due to its recently adopted formulaic dividend which pays out more than the company's net income - a relatively unusual situation in the BDC space where most companies maintain total dividend coverage above 100%.
Systematic Income CEF Tool
Although this might seem unsustainable (and it is by definition given the temporary nature of the special dividends) it has a number of advantages such as minimizing excise tax and pushing the valuation higher, all else equal.
The NAV rose by close to 1%, reversing some of the weakness seen in prior quarters.
Systematic Income
During the quarter, the company issued 3.2 million shares at an average share price of $19.54, for net proceeds of $61.5 million. This share issuance was accretive to the NAV. The motivation for the issuance was tactical, to take advantage of a premium to NAV, as well as strategic, to potentially take advantage of a likely busier Q4 vs. Q3 as well as a likely busier 2024 vs. 2023.
Income Dynamics
Leverage fell over the quarter to one of the lowest levels in the sector, particularly in terms of regulatory leverage which came in at just 0.5x.
Systematic Income CEF Tool
This was driven in part by the new share issuance, a realized gain as well as by an increase in the NAV. Such a low level of leverage gives the company a lot of room for further portfolio growth.
Systematic Income CEF Tool
FDUS aims to reduce its allocation to equity securities in favor of first-lien holdings. This would not only increase its investment income but also decrease the beta of its overall portfolio.
In the last quarter, first-lien investments made up nearly all of its debt investments. The company did add 14% in new equity investments which is above its 10% target level.
The second-lien portfolio allocation has fallen over time which is good to see however the equity allocation has been sticky so it would be good to see some movement on this front as well.
Systematic Income CEF Tool
Portfolio yield increased slightly however, but what is much more interesting is that interest expense fell. This is extremely unusual in the BDC sector as rising short-term rates have increased the interest expense of credit facilities which have a floating-rate profile.
The reason FDUS interest expense fell was because the company repaid its credit facility and only has fixed-rate debt outstanding. This is in contrast to an average BDC which has about half its financing coming from a credit facility. Credit facilities are relatively expensive ways to raise cash - with a cost of around 6.5-7.5% - versus existing debt, much of which was put on over the previous several years when rates were much lower.
Systematic Income CEF Tool
This means that FDUS has a level of interest expense that is more than 2% below that of the average BDC and is likely to have the lowest interest expense in the entire sector.
This low level of interest expense also improves its net yield profile on the leveraged portion of its portfolio which is 10.5% for FDUS (before fees) and around 6.2% for the average BDC. Its earliest unsecured debt maturity is in 2026 and the first SBIC debenture maturity is in 2025 (latest is in 2033). We would expect the company to again tap its credit facility over the coming quarters as it puts capital to work. However, even as this happens it will be a long while before its overall interest expense rises to the sector average level.
Management has guided that credit spreads have come in around 0.25-5% over the last six months which is a slight headwind to net income, something it shares with the rest of the sector.
Portfolio Quality
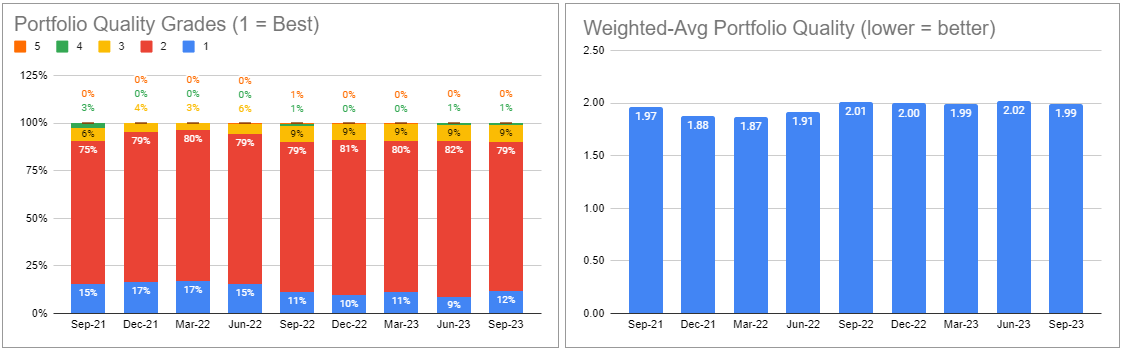
Non-accruals made up 1.3% of the portfolio (across two companies - unchanged from the prior quarter) on a fair-value basis - a slight drop from the previous quarter.
Systematic Income CEF Tool
Portfolio quality as gauged by internal metrics improved slightly.
PIK income continued to rise and is a metric that's worth keeping an eye on. An increase in PIK does not necessarily indicate portfolio concerns as these would also show up in internal ratings, unrealized depreciation (0.4% during the quarter) and non-accruals.
Systematic Income CEF Tool
There was a sizable realized gain on one equity holding which more than offset the unusual prior quarter loss.
Systematic Income CEF Tool
Return And Valuation Profile
Despite being somewhat under the radar, FDUS remains one of the strongest-performing BDCs.
Systematic Income CEF Tool
FDUS has consistently outperformed the sector on a twelve-month trailing basis (yellow line staying above zero).
Systematic Income CEF Tool
Its valuation is trading quite a bit above its longer-term average level.
Systematic Income
The stock spent much of the past year trading above the sector average valuation before temporarily moving below it recently. This was when we topped up our position to the stock. The combination of below-sector valuation and above-sector performance is one that we look for in new allocations. Since then the stock has, once again, moved out to a premium vs. the sector.
Systematic Income
The risks to FDUS is its relatively low level of diversification of 80 portfolio companies which is below the sector average. It also has an above-average equity allocation which can be vulnerable to a protracted equity sell-off. This is mitigated in large part by the company's low level of leverage, however.
FDUS remains one of our largest positions in the BDC sector and one that continues to perform very well.
For further details see:
Fidus Q3 Update: Another Dividend Hike For This 16.5% Yielding BDC