FILL - FILL: Global Energy Equities Attractive Valuation
2023-09-25 11:48:14 ET
Summary
- The iShares MSCI Global Energy Producers ETF is a global equity ETF that focuses on oil and gas majors.
- Oil has rallied over 28% since June, while FILL has moved up by only 13% given its beta to oil prices.
- Higher for longer oil prices into year-end will close that valuation gap.
- With oil prices rising and expected to continue increasing, FILL is a preferred choice over the Energy Select Sector SPDR Fund ETF due to its concentration in European majors which have lower valuation metrics.
Thesis
The iShares MSCI Global Energy Producers ETF (FILL) is an equity exchange traded fund. The vehicle comes via the asset management titan BlackRock/iShares and represents a long position in global energy producers:
The iShares MSCI Global Energy Producers ETF seeks to track the investment results of an index composed of global equities of companies primarily engaged in the business of energy exploration and production.
Versus the much better known sectoral fund Energy Select Sector SPDR Fund ETF (XLE), FILL represents a take on global energy companies rather than just American ones:
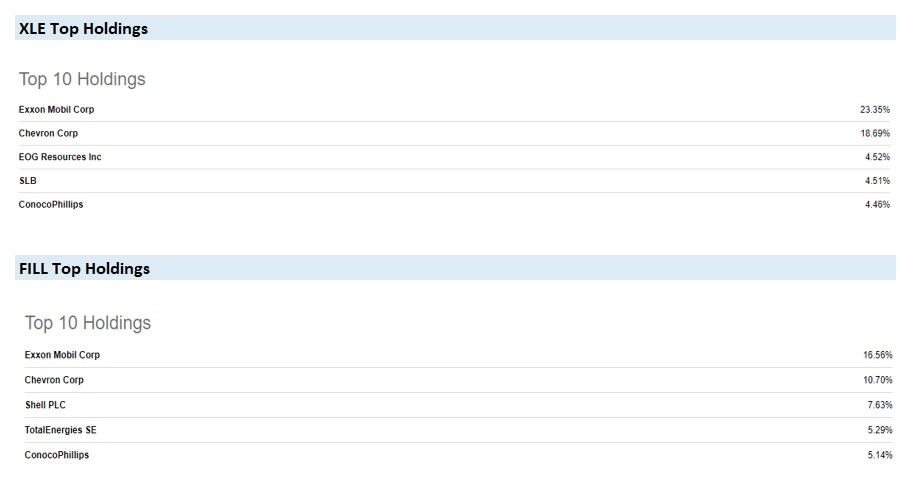
If we look at the top 5 holdings in each fund, we can see how Exxon ( XOM ) and Chevron ( CVX ) are the top two names in each fund, but with different weightings. Secondly FILL contains Shell ( SHEL ) and TotalEnergies ( TTE ) in its top holdings, whereas XLE does not.
A global energy exposure is preferable at this stage of the commodities boom cycle due to undervaluation in European energy equities:
From a valuation standpoint, as measured by the P/E Ratio, American energy companies are expensive compared to European ones. As a reminder, a low Price to Earnings ratio is preferable to high ones, all else equal.
There are several reasons for this state of affairs, including uncertainties regarding the European taxing environment for oil & gas profits, operational ESG requirements and associated pressures which are higher in Europe, and legacy Russian holdings clean-ups.
While the beginning of the commodities cycle saw an outperformance of American Oil & Gas equities, we feel today's environment will normalize total returns across the spectrum:
We can see from the above graph how XOM and CVX have significantly outperformed in the beginning of the cycle, with a 5-year total return sitting at 74% for XOM, 70% for CVX and only 19% for SHEL and 43% for TTE.
With oil prices higher for longer, the valuation gap will narrow as free cash flows are realized and investors navigate towards valuations that are cheaper and with higher FCF yields.
State of the Oil Market
Integrated oil & gas majors like XOM, CVX, SHEL and TTE have oil and gas prices as their primary risk factor, followed by refining margins and prices of ancillary products.
While oil prices as measured by WTI and Brent were depressed in the beginning of the year due to expectations for an economic slowdown, they have rebounded strongly since June:
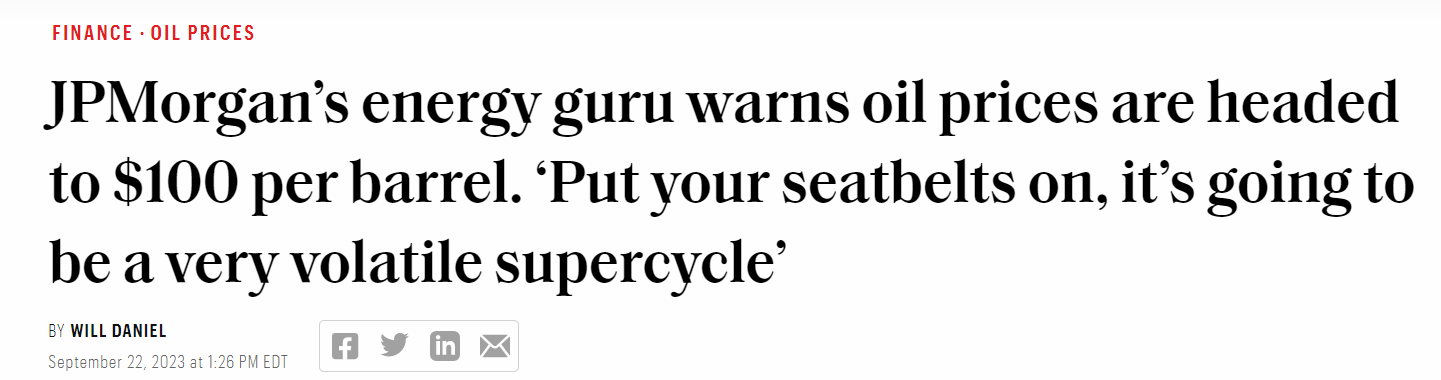
Both WTI crude as measured by the United States Oil ETF ( USO ) and Brent as measured by the United States Brent Oil ETF ( BNO ) are up over 28% since June, with large banks forecasting even higher prices:
As a reminder to readers, there is a differentiation in performance for the actual underlying commodity, as measured by its spot price and futures curve price, and oil and gas majors.
While the commodities themselves trade in the spot and forward market, the large global energy companies that benefit from higher underlying prices have a lag to profit realization. If oil prices stay at current levels, do expect oil & gas majors to have a substantial run-up in the next six months. Commodities are intrinsically volatile, and the market discounts that in energy producer prices. You will not see the same beta in energy producers as in the underlying commodities themselves.
The run-up in prices since June has been more driven by the supply side than the demand side, with Saudi and Russia extending their voluntary oil cuts until the end of the year. Curtailed supply, combined with a demand side that has just been resilient, has put a bid under oil prices:
Goldman Sachs Group Inc. rejoined the $100-a-barrel oil club, raising its forecast for crude back to triple digits as worldwide demand hits unprecedented levels and OPEC+ supply curbs continue to tighten the market.
Source: Bloomberg
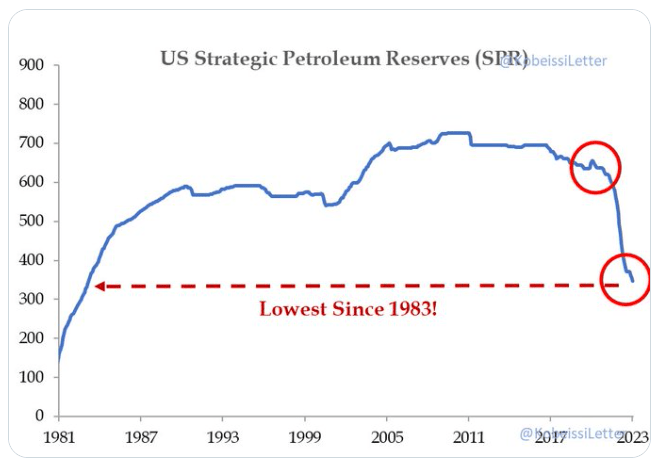
Saudi Arabia has been a flag bearer when it comes to leadership in the OPEC+ cartel. They have been a very smart but unconstrained member, and have sought to maximize profits via putting a soft barrier under oil prices via their voluntary curtailments. As the U.S. was emptying its SPR reserve to counter inflationary pressures, Saudi decided to cut production in response:
The U.S. Strategic Petroleum Reserve was created in 1975 as a response to the oil crises of the 70s, and represents a reserve that the U.S. can access to smooth out periods of temporary curtailments in supply. The current administration has used the SPR reserve as a weapon against inflation, choosing to sell oil from the SPR to move oil prices lower.
As per the above graph, the reserve is less than half what it was three years ago, and we do not think the administration will completely empty it out due to strategic and operational issues. Going forward, the administration will be able to do less and less in terms of moving oil prices lower via SPR drainage.
FILL Holdings
Despite holding over 200 names in its portfolio, the fund is highly concentrated in its top-10 names, which account for over 59% of the fund:
Top Holdings (Fund Fact Sheet)
After Exxon, Chevron, Shell and Total, Conoco Phillips ( COP ) and BP ( BP ) round the top holdings in the fund.
Over half of the collateral in this fund is composed of oil majors, which are called 'integrated oil & gas' in the below table:
Top Sectors (Fund Fact Sheet)
The second sectoral allocation is to exploration and production companies, sub-sector which has a higher beta to oil prices than the majors.
Analytics
AUM: $0.12 billion
Sharpe Ratio: 1.03 (3Y)
Std. Deviation: 30.4 (3Y)
Yield: 3.92%
Z-stat: n/a
Leverage Ratio: 0%
Composition: Global Energy Equities
Expense Ratio: 0.39%
Valuation metrics look attractive
With the S&P 500 trading at a rich 19x P/E ratio, FILL is at the opposite side of the spectrum when it comes down to valuation:
Metrics (Fund Fact Sheet)
At a 6.29x P/E, the fund's components have a substantial amount of run-up before becoming rich. Nobody expects energy equities to trade at high multiples of 15x or above, but a normalization in the majors to 10x, and a 7x valuation for E&Ps is something that can be achieved with prolonged high oil prices.
Valuations are extremely important in today's market. High valuation starting points usually result in losses. We have seen this with hyped tech stocks with inflated P/E ratios in 2021 that have been forced to come down. A low P/E ratio coupled with a high price for the main profit risk factor (oil in this case) opens the door for the market to re-rate said companies, and project higher for longer profits. We feel this is the case for FILL.
Conclusion
FILL is an equities exchange traded fund. The vehicle focuses on global energy equities, and contains all the global oil & gas majors. When compared to the better known XLE fund, FILL has a lower allocation to XOM and CVX, while containing BP, TTE and SHEL. The fund is concentrated, with the top-10 holdings accounting for over 59% of the ETF.
The main risk factor for FILL is constituted by oil prices. Both Brent and WTI have been on a tear since June, up over +28%. Oil equities have rallied less, given their beta to oil prices. However, higher prices for longer will see that difference in valuation narrow, as profits are monetized via the extraction and processing of oil.
FILL is also a preferred choice over XLE at this stage, given the high concentration of European majors, which have much lower valuation metrics as measured by P/E ratios. We feel the U.S. administration has less flexibility in further SPR releases to combat higher oil prices, and we are going to see WTI rally into year-end. With major banks calling for oil to go above $100 per barrel, energy equities are a good trade to be had versus owning the commodity outright. We are a Buy for FILL here.
For further details see:
FILL: Global Energy Equities, Attractive Valuation